Matplotlib Scatter
Matplotlib is a powerful data visualization library in Python that allows you to create a wide range of plots and charts. One of the most commonly used plot types in Matplotlib is the scatter plot. Scatter plots are useful for visualizing the relationship between two variables by showing how data points are distributed on a 2D plane.
In this tutorial, we will explore how to create scatter plots using Matplotlib and customize them to make them more informative and visually appealing.
Basic Scatter Plot
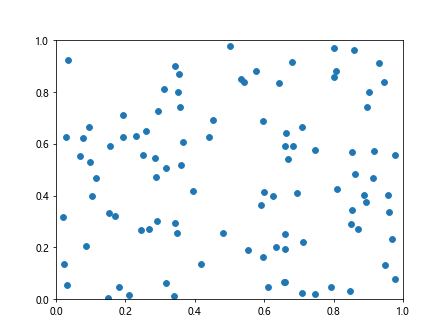
The simplest way to create a scatter plot in Matplotlib is by using the scatter() function. Let’s start by creating a basic scatter plot with randomly generated data.
import matplotlib.pyplot as plt
import numpy as np

# Generate random data
x = np.random.rand(100)
y = np.random.rand(100)

plt.scatter(x, y)
plt.show()
Output:
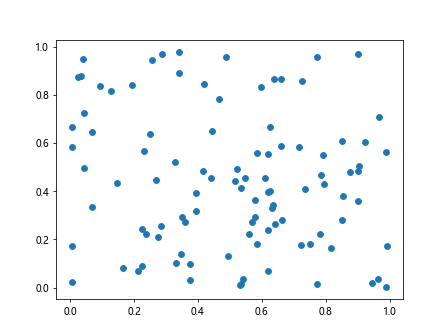
In this example, we use np.random.rand() to generate 100 random values for x and y, and then we plot them using plt.scatter(). Finally, we use plt.show() to display the plot.
Customizing Scatter Plot
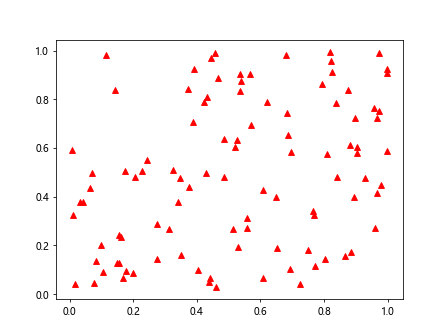
Color and Marker
You can customize the color and marker style of the data points in a scatter plot by specifying the color and marker parameters in the scatter() function.
import matplotlib.pyplot as plt
import numpy as np

# Generate random data
x = np.random.rand(100)
y = np.random.rand(100)

plt.scatter(x, y, color='red', marker='^')
plt.show()
Output:
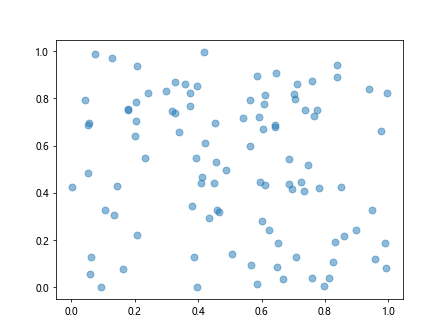
Size and Transparency
You can also customize the size and transparency of the data points using the s and alpha parameters.
import matplotlib.pyplot as plt
import numpy as np

# Generate random data
x = np.random.rand(100)
y = np.random.rand(100)

plt.scatter(x, y, s=50, alpha=0.5)
plt.show()
Output:
Highlight Specific Data Points
You can highlight specific data points by using conditional statements to define which points should be plotted with different colors, markers, or sizes.
import matplotlib.pyplot as plt
import numpy as np

# Generate random data
x = np.random.rand(100)
y = np.random.rand(100)
colors = np.where((x > 0.5) & (y > 0.5), 'red', 'blue')
markers = ['o' if c == 'red' else '^' for c in colors]

plt.scatter(x, y, c=colors, marker=markers)
plt.show()
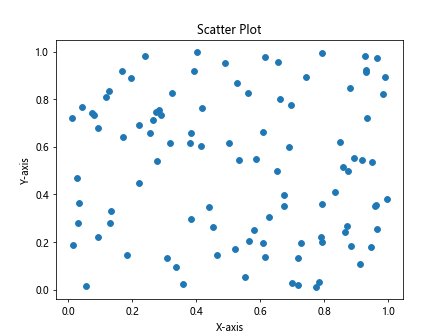
Adding Labels and Title
To make the scatter plot more informative, you can add labels to the x and y axes, as well as a title to the plot.
import matplotlib.pyplot as plt
import numpy as np

# Generate random data
x = np.random.rand(100)
y = np.random.rand(100)

plt.scatter(x, y)
plt.xlabel('X-axis')
plt.ylabel('Y-axis')
plt.title('Scatter Plot')
plt.show()
Output:
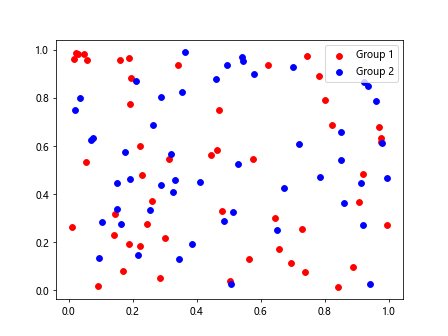
Multiple Scatter Plots
You can create multiple scatter plots in the same figure by calling scatter() multiple times before displaying the plot with show().
import matplotlib.pyplot as plt
import numpy as np

# Generate random data
x = np.random.rand(100)
y = np.random.rand(100)
x1 = np.random.rand(50)
y1 = np.random.rand(50)
x2 = np.random.rand(50)
y2 = np.random.rand(50)

plt.scatter(x1, y1, color='red', label='Group 1')
plt.scatter(x2, y2, color='blue', label='Group 2')
plt.legend()
plt.show()
Output:
Controlling Axes Limits
You can control the limits of the x and y axes using the xlim() and ylim() functions.
import matplotlib.pyplot as plt
import numpy as np

# Generate random data
x = np.random.rand(100)
y = np.random.rand(100)

plt.scatter(x, y)
plt.xlim(0, 1)
plt.ylim(0, 1)
plt.show()
Output:
Save Scatter Plot to File
You can save the scatter plot to a file in various formats such as PNG, PDF, or SVG.
import matplotlib.pyplot as plt
import numpy as np

# Generate random data
x = np.random.rand(100)
y = np.random.rand(100)

plt.scatter(x, y)
plt.savefig('scatter_plot.png')
Matplotlib Scatter Conclusion
In this tutorial, we have learned how to create and customize scatter plots using Matplotlib in Python. Scatter plots are a powerful tool for visualizing the relationship between two variables and identifying patterns in data. By customizing various aspects of the plot such as color, marker style, size, transparency, and axis labels, you can create informative and visually appealing scatter plots for your data analysis tasks. Experiment with different parameters and settings to create scatter plots that best represent your data and communicate your findings effectively.