Matplotlib Legend Outside Plot
When creating plots with Matplotlib, it is often necessary to include a legend to help viewers understand the data being presented. By default, the legend is usually placed inside the plot area, which can sometimes overlap with the plot itself. In this article, we will explore how to move the legend outside of the plot area for a cleaner and more organized visual representation of the data.
Basic Legend Placement
Let’s start by creating a simple plot using Matplotlib and placing the legend inside the plot area.
import matplotlib.pyplot as plt

x = [1, 2, 3, 4, 5]
y1 = [2, 3, 5, 7, 11]
y2 = [1, 4, 9, 16, 25]

plt.plot(x, y1, label='Prime numbers')
plt.plot(x, y2, label='Square numbers')
plt.legend()
plt.show()
Output:
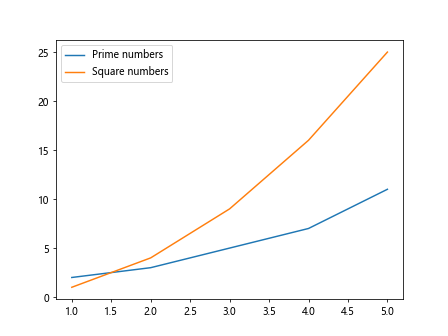
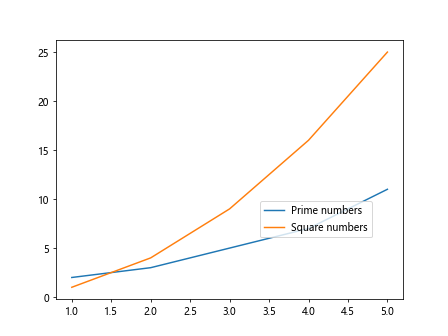
In the above code, the legend for the two lines is placed inside the plot area by default.
Moving the Legend Outside the Plot
To move the legend outside the plot, we can use the bbox_to_anchor parameter of the legend function. This parameter allows us to specify the position of the legend relative to the plot area as a tuple (x, y) where (0, 0) is the bottom left of the plot and (1, 1) is the top right.
import matplotlib.pyplot as plt
x = [1, 2, 3, 4, 5]
y1 = [2, 3, 5, 7, 11]
y2 = [1, 4, 9, 16, 25]
plt.plot(x, y1, label='Prime numbers')
plt.plot(x, y2, label='Square numbers')
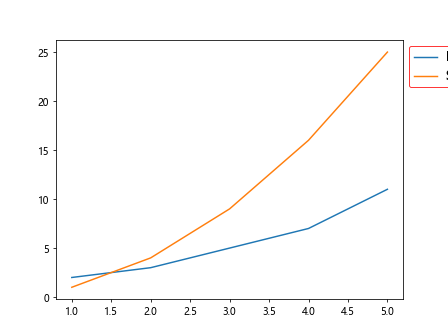
plt.legend(loc='upper left', bbox_to_anchor=(1, 1))
plt.show()
Output:
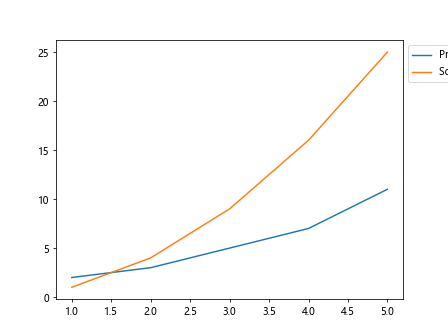
In this code, we have moved the legend to the top right corner of the plot by setting bbox_to_anchor=(1, 1).
Customizing Legend Position and Appearance
We can further customize the position and appearance of the legend by using additional parameters of the legend function. For example, we can specify the borderaxespad parameter to add padding around the legend to prevent it from overlapping with the plot lines.
import matplotlib.pyplot as plt

x = [1, 2, 3, 4, 5]
y1 = [2, 3, 5, 7, 11]
y2 = [1, 4, 9, 16, 25]

plt.plot(x, y1, label='Prime numbers')
plt.plot(x, y2, label='Square numbers')
plt.legend(loc='upper left', bbox_to_anchor=(1, 1), borderaxespad=10)
plt.show()
Output:
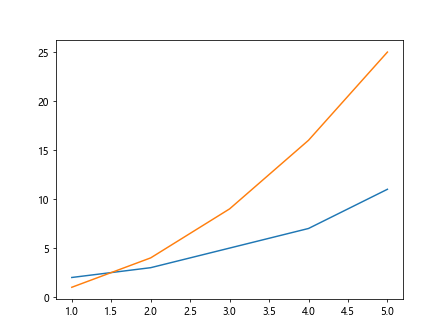
In this code, we have added borderaxespad=10 to create a padding of 10 points around the legend.
Multiple Legends
If we have multiple legends in a plot, we can use the handles parameter of the legend function to specify which plot elements should be included in each legend.
import matplotlib.pyplot as plt

x = [1, 2, 3, 4, 5]
y1 = [2, 3, 5, 7, 11]
y2 = [1, 4, 9, 16, 25]

line1, = plt.plot(x, y1, label='Prime numbers')
line2, = plt.plot(x, y2, label='Square numbers')

plt.legend(handles=[line1], labels=['Prime numbers'], loc='upper left', bbox_to_anchor=(1, 1))
plt.legend(handles=[line2], labels=['Square numbers'], loc='lower right', bbox_to_anchor=(1, 0))
plt.show()
Output:
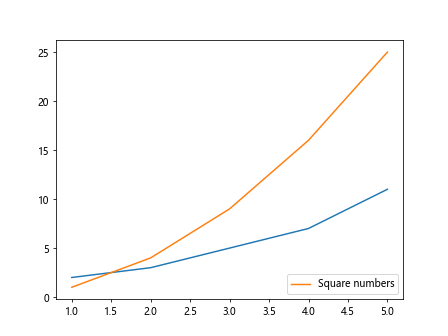
In this code, we have created separate legends for the prime numbers and square numbers using the handles parameter.
Customizing Legend Fonts and Colors
We can also customize the fonts and colors of the legend text and background by using the prop and edgecolor parameters of the legend function.
import matplotlib.pyplot as plt

x = [1, 2, 3, 4, 5]
y1 = [2, 3, 5, 7, 11]
y2 = [1, 4, 9, 16, 25]

plt.plot(x, y1, label='Prime numbers')
plt.plot(x, y2, label='Square numbers')
plt.legend(loc='upper left', bbox_to_anchor=(1, 1), prop={'size': 12, 'weight': 'bold'}, edgecolor='red')
plt.show()
Output:
In this code, we have set the font size to 12 and font weight to bold, and the legend border color to red.
Adding a Title to the Legend
If we want to add a title to the legend, we can use the title parameter of the legend function.
import matplotlib.pyplot as plt

x = [1, 2, 3, 4, 5]
y1 = [2, 3, 5, 7, 11]
y2 = [1, 4, 9, 16, 25]

plt.plot(x, y1, label='Prime numbers')
plt.plot(x, y2, label='Square numbers')
plt.legend(loc='upper left', bbox_to_anchor=(1, 1), title='Number Types')
plt.show()
Output:
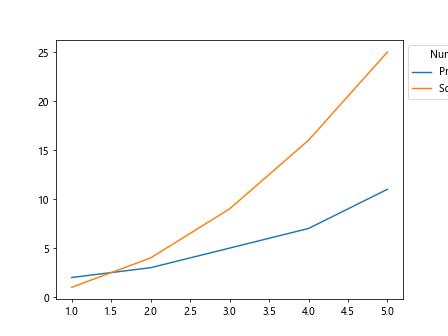
In this code, we have added a title ‘Number Types’ to the legend.
Changing Legend Position with Axes Coordinates
Another way to move the legend outside the plot is by using axes coordinates to specify the relative position of the legend to the plot area.
import matplotlib.pyplot as plt

x = [1, 2, 3, 4, 5]
y1 = [2, 3, 5, 7, 11]
y2 = [1, 4, 9, 16, 25]

plt.plot(x, y1, label='Prime numbers')
plt.plot(x, y2, label='Square numbers')
plt.legend(loc='lower right', bbox_to_anchor=(1.05, 0.05), borderaxespad=5)
plt.show()
Output:
In this code, we have used bbox_to_anchor=(1.05, 0.05) to move the legend slightly outside the plot area.
Using External Libraries
There are also external libraries that provide additional functionalities for legends in Matplotlib. One such library is matplotlib-legend, which allows for more customization options and easier manipulation of legends.
from matplotlib_legend import legend
import matplotlib.pyplot as plt

x = [1, 2, 3, 4, 5]
y1 = [2, 3, 5, 7, 11]
y2 = [1, 4, 9, 16, 25]

plt.plot(x, y1, label='Prime numbers')
plt.plot(x, y2, label='Square numbers')
legend(loc='upper left', bbox_to_anchor=(1, 1), title='Number Types', fontsize=12, border_color='green')
plt.show()
In this code, we have used the legend function from the matplotlib_legend library to create a legend with a green border and a font size of 12.
Matplotlib Legend Outside Plot Summary
In this article, we have explored various ways to move the legend outside the plot in Matplotlib. By customizing the legend position, appearance, and using external libraries, we can create visually appealing and informative plots for data visualization. Experiment with the examples provided to enhance your plot designs and improve the overall presentation of your data.