matplotlib rotate x axis labels
Matplotlib is a popular data visualization library in Python that allows users to create a wide variety of plots and charts. One common task when creating plots is the need to rotate the x-axis labels for better readability. In this article, we will explore different methods to rotate x-axis labels in Matplotlib.
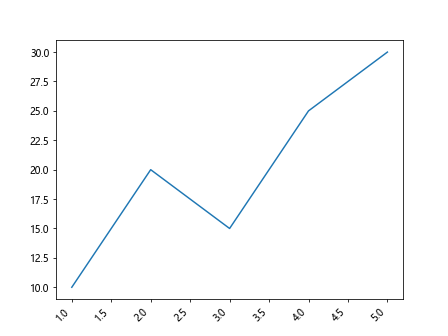
Method 1: Using plt.xticks() with rotation argument
import matplotlib.pyplot as plt

# Sample data
x = [1, 2, 3, 4, 5]
y = [10, 20, 15, 25, 30]

plt.plot(x, y)
plt.xticks(rotation=45) # Rotate x-axis labels by 45 degrees
plt.show()
Output:

In this example, we use plt.xticks() with the rotation argument to rotate the x-axis labels by 45 degrees. This method allows us to specify the rotation angle for the x-axis labels.
Method 2: Using plt.setp() to rotate x-axis labels
import matplotlib.pyplot as plt

# Sample data
x = [1, 2, 3, 4, 5]
y = [10, 20, 15, 25, 30]

plt.plot(x, y)
plt.setp(plt.gca().get_xticklabels(), rotation=90) # Rotate x-axis labels by 90 degrees
plt.show()
Output:

In this example, we use plt.setp() to set properties for the x-axis labels. We access the x-axis labels using plt.gca().get_xticklabels() and rotate them by 90 degrees.
Method 3: Using plt.xticks() with rotation_mode argument
import matplotlib.pyplot as plt

# Sample data
x = [1, 2, 3, 4, 5]
y = [10, 20, 15, 25, 30]

plt.plot(x, y)
plt.xticks(rotation=45, rotation_mode='anchor') # Rotate x-axis labels by 45 degrees with anchor rotation mode
plt.show()
Output:

In this example, we use plt.xticks() with the rotation_mode argument set to ‘anchor’. This rotation mode rotates the x-axis labels around their anchor point, which can be useful when dealing with long labels.
Method 4: Using plt.xticks() with custom labels
import matplotlib.pyplot as plt

# Sample data
x = [1, 2, 3, 4, 5]
y = [10, 20, 15, 25, 30]

labels = ['This is a long label that needs rotation', 'Label 2', 'Label 3', 'Label 4', 'Label 5']

plt.plot(x, y)
plt.xticks(x, labels, rotation=45) # Rotate x-axis labels by 45 degrees with custom labels
plt.show()
Output:
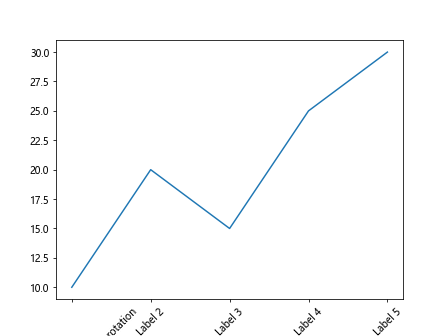
In this example, we provide custom labels for the x-axis using the labels list and rotate them by 45 degrees using plt.xticks().
Method 5: Rotating x-axis labels for a bar chart
import matplotlib.pyplot as plt

# Sample data
x = ['Label 1', 'Label 2', 'Label 3', 'Label 4', 'Label 5']
y = [10, 20, 15, 25, 30]

plt.bar(x, y)
plt.xticks(rotation=90) # Rotate x-axis labels by 90 degrees for a bar chart
plt.show()
Output:
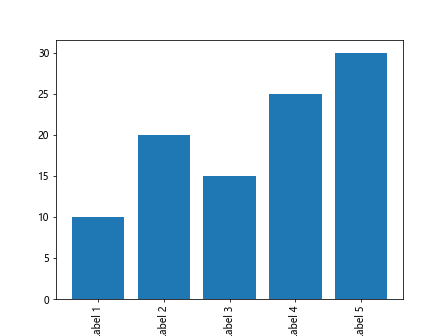
In this example, we create a bar chart and rotate the x-axis labels by 90 degrees for better readability.
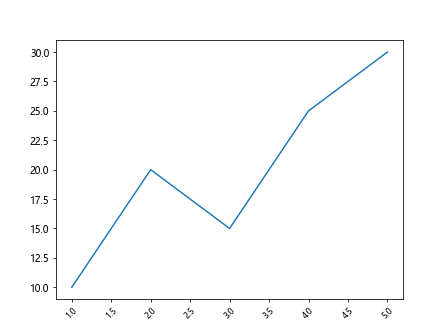
Method 6: Adding padding to rotated x-axis labels
import matplotlib.pyplot as plt

# Sample data
x = [1, 2, 3, 4, 5]
y = [10, 20, 15, 25, 30]

plt.plot(x, y)
plt.xticks(rotation=45, ha='right') # Rotate x-axis labels by 45 degrees with right alignment
plt.show()
Output:
In this example, we use the ha='right' argument in plt.xticks() to right-align the x-axis labels after rotating them by 45 degrees.
Method 7: Rotating x-axis labels with custom font properties
import matplotlib.pyplot as plt
from matplotlib.font_manager import FontProperties

# Sample data
x = [1, 2, 3, 4, 5]
y = [10, 20, 15, 25, 30]

plt.plot(x, y)
font = FontProperties()
font.set_size('small') # Set font size to small
plt.xticks(rotation=45, fontproperties=font) # Rotate x-axis labels by 45 degrees with custom font properties
plt.show()
Output:
In this example, we create custom font properties for the x-axis labels using FontProperties() and set the font size to ‘small’ before rotating them by 45 degrees.
Method 8: Rotating x-axis labels with a specific font style
import matplotlib.pyplot as plt
from matplotlib.font_manager import FontProperties

# Sample data
x = [1, 2, 3, 4, 5]
y = [10, 20, 15, 25, 30]

plt.plot(x, y)
font = FontProperties()
font.set_family('serif') # Set font family to serif
plt.xticks(rotation=45, fontproperties=font) # Rotate x-axis labels by 45 degrees with specific font style
plt.show()
Output:

In this example, we set the font family to ‘serif’ for the x-axis labels using FontProperties() before rotating them by 45 degrees.
Method 9: Rotating x-axis labels with custom label size
import matplotlib.pyplot as plt

# Sample data
x = [1, 2, 3, 4, 5]
y = [10, 20, 15, 25, 30]

plt.plot(x, y)
plt.xticks(fontsize=8) # Set font size to 8 for x-axis labels
plt.xticks(rotation=45) # Rotate x-axis labels by 45 degrees with custom label size
plt.show()
Output:

In this example, we set the font size to 8 for the x-axis labels using the fontsize argument in plt.xticks() before rotating them by 45 degrees.
Method 10: Rotating x-axis labels with a specific font weight
import matplotlib.pyplot as plt
from matplotlib.font_manager import FontProperties

# Sample data
x = [1, 2, 3, 4, 5]
y = [10, 20, 15, 25, 30]

plt.plot(x, y)
font = FontProperties()
font.set_weight('bold') # Set font weight to bold
plt.xticks(rotation=45, fontproperties=font) # Rotate x-axis labels by 45 degrees with specific font weight
plt.show()
Output:
In this example, we set the font weight to ‘bold’ for the x-axis labels using FontProperties() before rotating them by 45 degrees.
matplotlib rotate x axis labels Conclusion
In this article, we explored different methods to rotate x-axis labels in Matplotlib. We covered various techniques such as using plt.xticks() with rotation angle, custom labels, padding, font properties, and specific styles. By applying these methods, you can enhance the readability of your plots and charts with rotated x-axis labels. Experiment with these examples to find the best approach for your visualization needs in Matplotlib.