Mastering Matplotlib: A Comprehensive Guide to subplots_adjust
Matplotlib subplots_adjust is a powerful function in the matplotlib library that allows you to fine-tune the layout of your subplots. This article will provide an in-depth exploration of matplotlib subplots_adjust, covering its various parameters, use cases, and practical examples. By the end of this guide, you’ll have a thorough understanding of how to use matplotlib subplots_adjust to create perfectly spaced and aligned plots.
Understanding the Basics of Matplotlib subplots_adjust
Matplotlib subplots_adjust is a function that adjusts the spacing between and around subplots in a figure. It provides precise control over the layout of your plots, allowing you to create visually appealing and well-organized visualizations. The function is particularly useful when working with multiple subplots or when you need to customize the spacing to accommodate titles, labels, or other elements.
Let’s start with a simple example to demonstrate the basic usage of matplotlib subplots_adjust:
import matplotlib.pyplot as plt
import numpy as np

# Create a figure with two subplots
fig, (ax1, ax2) = plt.subplots(2, 1, figsize=(8, 6))

# Plot some data
x = np.linspace(0, 10, 100)
ax1.plot(x, np.sin(x))
ax2.plot(x, np.cos(x))

# Add titles
ax1.set_title('Sine Wave - how2matplotlib.com')
ax2.set_title('Cosine Wave - how2matplotlib.com')

# Adjust the spacing between subplots
plt.subplots_adjust(hspace=0.5)

plt.show()
Output:
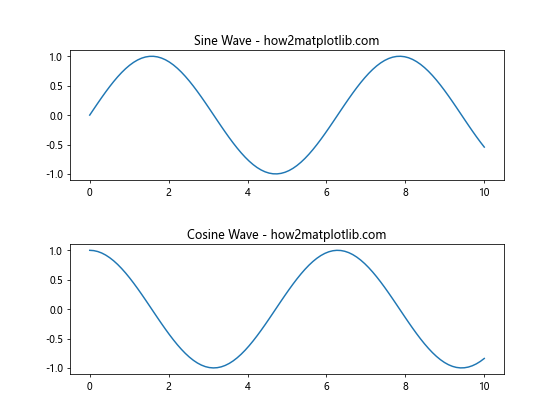
In this example, we create a figure with two subplots arranged vertically. We plot a sine wave in the first subplot and a cosine wave in the second subplot. By using plt.subplots_adjust(hspace=0.5), we increase the vertical space between the two subplots, making it easier to read the titles and distinguish between the plots.
Exploring the Parameters of Matplotlib subplots_adjust
Matplotlib subplots_adjust offers several parameters that allow you to control different aspects of the subplot layout. Let’s examine each of these parameters in detail:
left: The left side of the subplots of the figureright: The right side of the subplots of the figurebottom: The bottom of the subplots of the figuretop: The top of the subplots of the figurewspace: The width of the padding between subplots, as a fraction of the average axes widthhspace: The height of the padding between subplots, as a fraction of the average axes height
Let’s create an example that demonstrates the use of all these parameters:
import matplotlib.pyplot as plt
import numpy as np
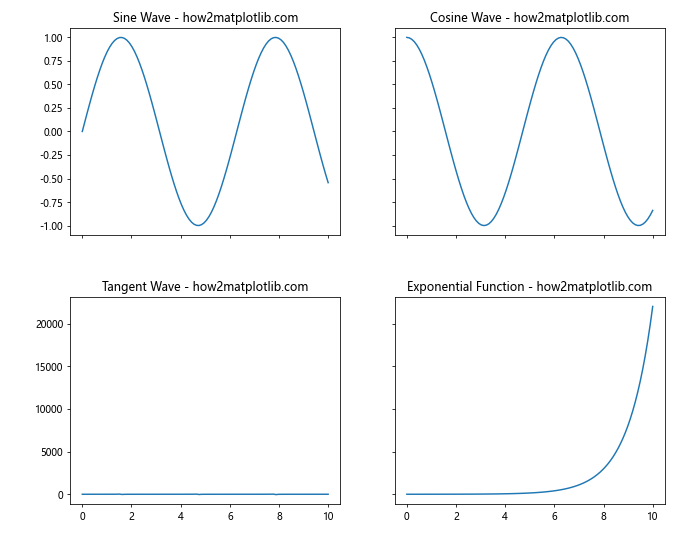
# Create a figure with four subplots
fig, ((ax1, ax2), (ax3, ax4)) = plt.subplots(2, 2, figsize=(10, 8))
# Plot some data
x = np.linspace(0, 10, 100)
ax1.plot(x, np.sin(x))
ax2.plot(x, np.cos(x))
ax3.plot(x, np.tan(x))
ax4.plot(x, np.exp(x))
# Add titles
ax1.set_title('Sine Wave - how2matplotlib.com')
ax2.set_title('Cosine Wave - how2matplotlib.com')
ax3.set_title('Tangent Wave - how2matplotlib.com')
ax4.set_title('Exponential Function - how2matplotlib.com')
# Adjust the spacing using all parameters
plt.subplots_adjust(left=0.1, right=0.95, bottom=0.1, top=0.95, wspace=0.3, hspace=0.4)
plt.show()
Output:
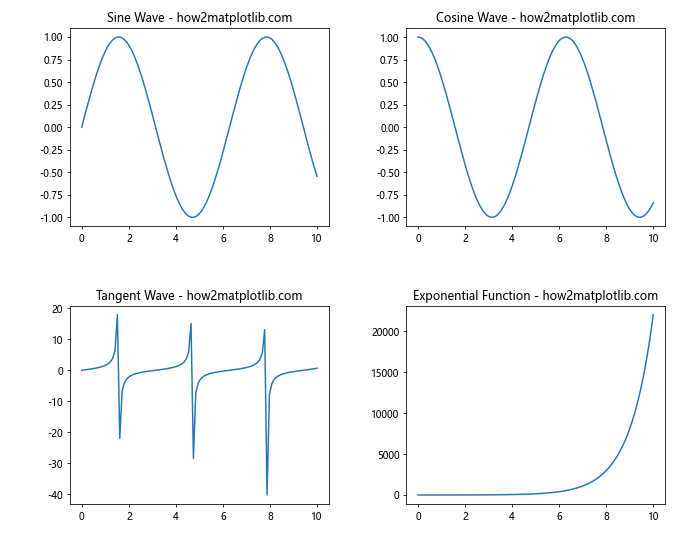
In this example, we create a 2×2 grid of subplots and use all the parameters of matplotlib subplots_adjust to customize the layout:
left=0.1andright=0.95adjust the horizontal margins of the entire figure.bottom=0.1andtop=0.95adjust the vertical margins of the entire figure.wspace=0.3sets the width of the padding between subplots.hspace=0.4sets the height of the padding between subplots.
These adjustments ensure that the subplots are well-spaced and that there’s enough room for titles and labels.
Fine-tuning Subplot Spacing with Matplotlib subplots_adjust
One of the key advantages of matplotlib subplots_adjust is its ability to fine-tune the spacing between subplots. This is particularly useful when working with plots that have different sizes or when you need to accommodate varying amounts of text or other elements.
Let’s look at an example where we create subplots of different sizes and use matplotlib subplots_adjust to optimize the layout:
import matplotlib.pyplot as plt
import numpy as np

# Create a figure with subplots of different sizes
fig = plt.figure(figsize=(12, 8))
ax1 = plt.subplot2grid((3, 3), (0, 0), colspan=2)
ax2 = plt.subplot2grid((3, 3), (0, 2), rowspan=2)
ax3 = plt.subplot2grid((3, 3), (1, 0), colspan=2)
ax4 = plt.subplot2grid((3, 3), (2, 0), colspan=3)

# Plot some data
x = np.linspace(0, 10, 100)
ax1.plot(x, np.sin(x))
ax2.plot(x, np.cos(x))
ax3.plot(x, np.tan(x))
ax4.plot(x, np.exp(x))

# Add titles
ax1.set_title('Sine Wave - how2matplotlib.com')
ax2.set_title('Cosine Wave - how2matplotlib.com')
ax3.set_title('Tangent Wave - how2matplotlib.com')
ax4.set_title('Exponential Function - how2matplotlib.com')

# Adjust the spacing using subplots_adjust
plt.subplots_adjust(left=0.05, right=0.95, bottom=0.05, top=0.95, wspace=0.3, hspace=0.4)

plt.show()
Output:
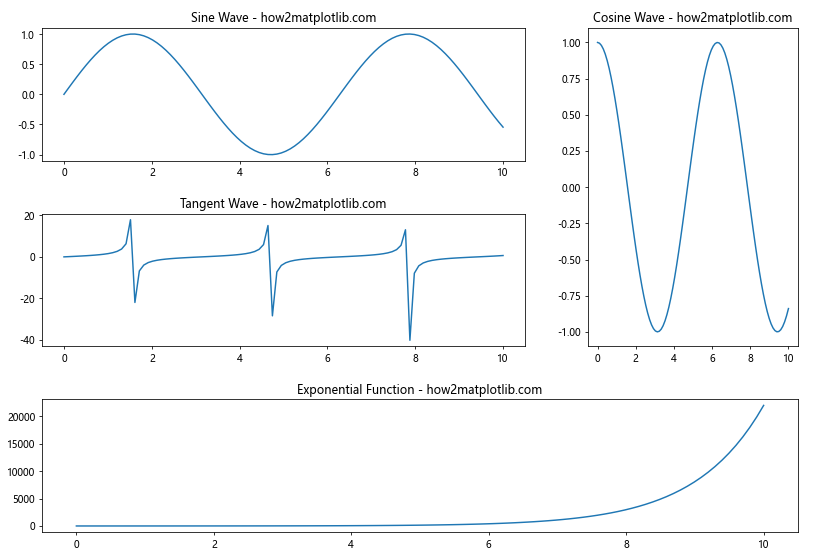
In this example, we create four subplots of different sizes using plt.subplot2grid(). We then use matplotlib subplots_adjust to optimize the spacing between these differently sized subplots. The wspace and hspace parameters are particularly important here, as they help maintain a consistent look despite the varying subplot sizes.
Using Matplotlib subplots_adjust with Tight Layout
While matplotlib subplots_adjust gives you fine-grained control over subplot spacing, sometimes you might want a quick and automatic way to adjust your layout. Matplotlib provides the tight_layout() function for this purpose. However, you can still use matplotlib subplots_adjust in conjunction with tight_layout() for even more control.
Here’s an example that demonstrates this combination:
import matplotlib.pyplot as plt
import numpy as np

# Create a figure with four subplots
fig, ((ax1, ax2), (ax3, ax4)) = plt.subplots(2, 2, figsize=(10, 8))

# Plot some data
x = np.linspace(0, 10, 100)
ax1.plot(x, np.sin(x))
ax2.plot(x, np.cos(x))
ax3.plot(x, np.tan(x))
ax4.plot(x, np.exp(x))

# Add titles with long text
ax1.set_title('Sine Wave with a Very Long Title - how2matplotlib.com')
ax2.set_title('Cosine Wave with an Even Longer Title - how2matplotlib.com')
ax3.set_title('Tangent Wave with the Longest Title of All - how2matplotlib.com')
ax4.set_title('Exponential Function with a Moderately Long Title - how2matplotlib.com')

# Use tight_layout first
plt.tight_layout()

# Then adjust with subplots_adjust
plt.subplots_adjust(top=0.9)

plt.show()
Output:
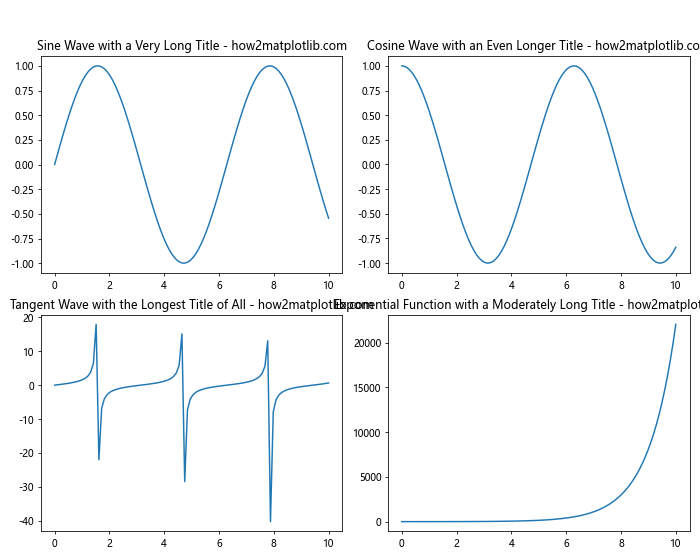
In this example, we first use plt.tight_layout() to automatically adjust the spacing. Then, we use matplotlib subplots_adjust to make a final adjustment to the top margin, giving more space for the long titles.
Matplotlib subplots_adjust for Complex Layouts
When working with complex layouts involving many subplots, matplotlib subplots_adjust becomes even more valuable. It allows you to fine-tune the spacing to create visually appealing and informative multi-plot figures.
Let’s create an example with a more complex layout:
import matplotlib.pyplot as plt
import numpy as np

# Create a figure with a complex layout
fig = plt.figure(figsize=(15, 10))
gs = fig.add_gridspec(3, 3)

ax1 = fig.add_subplot(gs[0, :2])
ax2 = fig.add_subplot(gs[0, 2])
ax3 = fig.add_subplot(gs[1, :])
ax4 = fig.add_subplot(gs[2, 0])
ax5 = fig.add_subplot(gs[2, 1:])

# Plot some data
x = np.linspace(0, 10, 100)
ax1.plot(x, np.sin(x))
ax2.plot(x, np.cos(x))
ax3.plot(x, np.tan(x))
ax4.plot(x, np.exp(x))
ax5.plot(x, np.log(x))

# Add titles
ax1.set_title('Sine Wave - how2matplotlib.com')
ax2.set_title('Cosine Wave - how2matplotlib.com')
ax3.set_title('Tangent Wave - how2matplotlib.com')
ax4.set_title('Exponential Function - how2matplotlib.com')
ax5.set_title('Logarithmic Function - how2matplotlib.com')

# Adjust the spacing using subplots_adjust
plt.subplots_adjust(left=0.05, right=0.95, bottom=0.05, top=0.95, wspace=0.3, hspace=0.4)

plt.show()
Output:
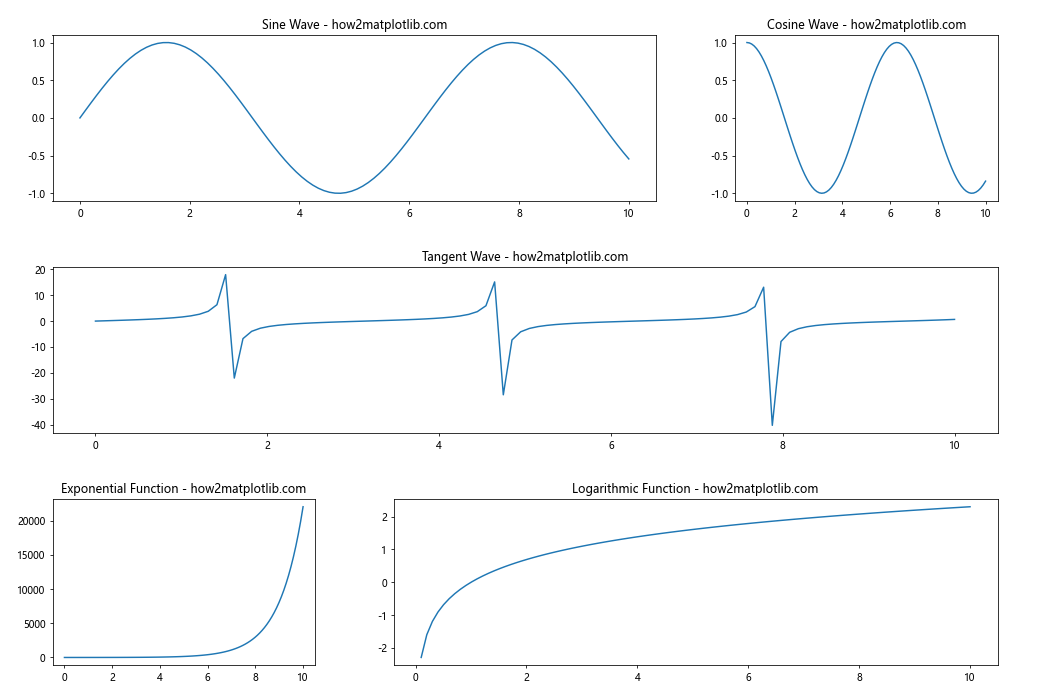
In this example, we create a complex layout with five subplots of varying sizes. We use matplotlib subplots_adjust to ensure that all subplots are well-spaced and that there’s enough room for titles and labels.
Matplotlib subplots_adjust for Annotations and Text
When adding annotations or text to your plots, you may need to adjust the spacing to accommodate these elements. Matplotlib subplots_adjust can help you create space for these additional components.
Here’s an example that demonstrates how to use matplotlib subplots_adjust to make room for annotations:
import matplotlib.pyplot as plt
import numpy as np

# Create a figure with two subplots
fig, (ax1, ax2) = plt.subplots(2, 1, figsize=(10, 8))

# Plot some data
x = np.linspace(0, 10, 100)
ax1.plot(x, np.sin(x))
ax2.plot(x, np.cos(x))

# Add titles
ax1.set_title('Sine Wave - how2matplotlib.com')
ax2.set_title('Cosine Wave - how2matplotlib.com')

# Add annotations
ax1.annotate('Peak', xy=(np.pi/2, 1), xytext=(np.pi/2 + 1, 1.2),
             arrowprops=dict(facecolor='black', shrink=0.05))
ax2.annotate('Trough', xy=(np.pi, -1), xytext=(np.pi + 1, -1.2),
             arrowprops=dict(facecolor='black', shrink=0.05))

# Adjust the spacing to make room for annotations
plt.subplots_adjust(left=0.1, right=0.9, bottom=0.1, top=0.9, hspace=0.4)

plt.show()
Output:
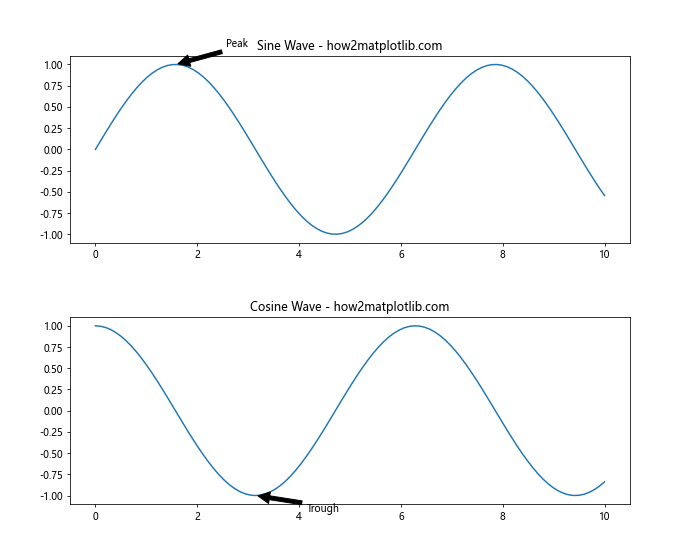
In this example, we add annotations to both subplots. We then use matplotlib subplots_adjust to increase the spacing between the subplots (hspace=0.4) and adjust the margins to ensure that the annotations are fully visible.
Using Matplotlib subplots_adjust with Colorbars
When working with plots that include colorbars, you may need to adjust the layout to accommodate these additional elements. Matplotlib subplots_adjust can help you create a balanced layout that includes both the plots and their associated colorbars.
Here’s an example that demonstrates how to use matplotlib subplots_adjust with colorbars:
import matplotlib.pyplot as plt
import numpy as np

# Create a figure with two subplots
fig, (ax1, ax2) = plt.subplots(1, 2, figsize=(12, 5))

# Create some data
data1 = np.random.rand(10, 10)
data2 = np.random.rand(10, 10)

# Create heatmaps
im1 = ax1.imshow(data1, cmap='viridis')
im2 = ax2.imshow(data2, cmap='plasma')

# Add colorbars
cbar1 = fig.colorbar(im1, ax=ax1)
cbar2 = fig.colorbar(im2, ax=ax2)

# Add titles
ax1.set_title('Heatmap 1 - how2matplotlib.com')
ax2.set_title('Heatmap 2 - how2matplotlib.com')

# Adjust the spacing to accommodate colorbars
plt.subplots_adjust(left=0.1, right=0.9, bottom=0.1, top=0.9, wspace=0.4)

plt.show()
Output:
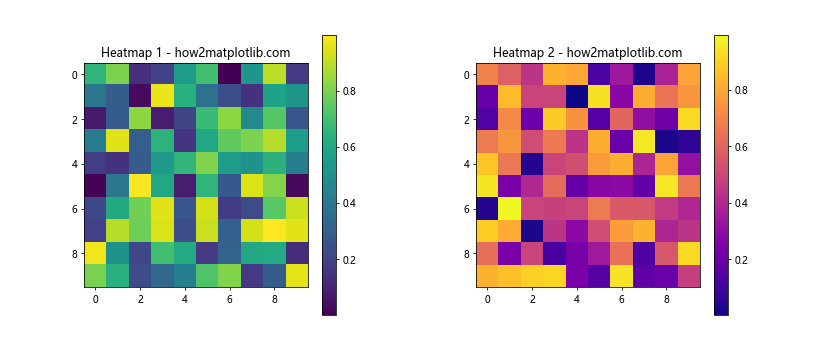
In this example, we create two heatmaps with colorbars. We use matplotlib subplots_adjust to increase the spacing between the subplots (wspace=0.4) and adjust the margins to ensure that both the heatmaps and their colorbars are fully visible.
Matplotlib subplots_adjust for Different Aspect Ratios
When working with subplots that have different aspect ratios, matplotlib subplots_adjust can help you create a balanced layout. This is particularly useful when combining plots of different types or when working with data that naturally has different aspect ratios.
Here’s an example that demonstrates how to use matplotlib subplots_adjust with subplots of different aspect ratios:
import matplotlib.pyplot as plt
import numpy as np

# Create a figure with three subplots
fig = plt.figure(figsize=(12, 8))
ax1 = fig.add_subplot(221)
ax2 = fig.add_subplot(223)
ax3 = fig.add_subplot(122)

# Plot some data
x = np.linspace(0, 10, 100)
ax1.plot(x, np.sin(x))
ax2.plot(x, np.cos(x))

# Create a heatmap
data = np.random.rand(10, 10)
im = ax3.imshow(data, cmap='viridis', aspect='auto')

# Add a colorbar to the heatmap
cbar = fig.colorbar(im, ax=ax3)

# Add titles
ax1.set_title('Sine Wave - how2matplotlib.com')
ax2.set_title('Cosine Wave - how2matplotlib.com')
ax3.set_title('Heatmap - how2matplotlib.com')

# Adjust the spacing to accommodate different aspect ratios
plt.subplots_adjust(left=0.1, right=0.9, bottom=0.1, top=0.9, wspace=0.4, hspace=0.4)

plt.show()
Output:
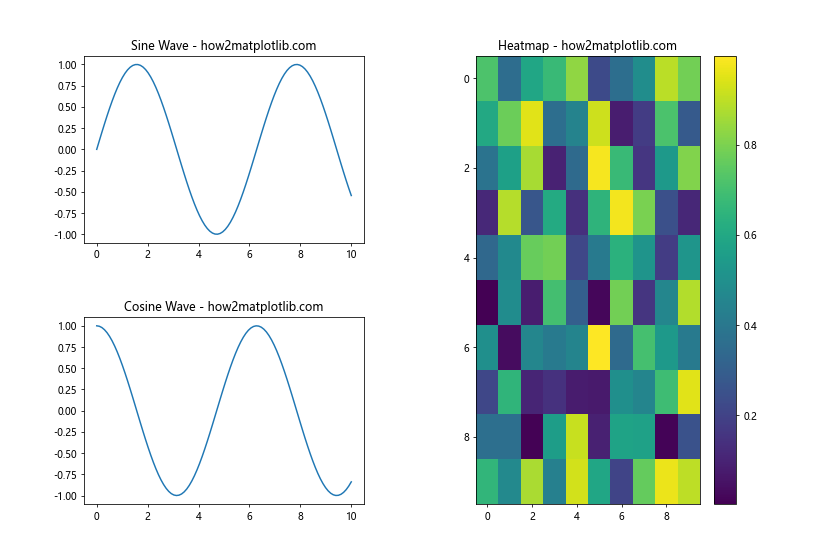
In this example, we create three subplots with different aspect ratios: two line plots and one heatmap. We use matplotlib subplots_adjust to create a balanced layout that accommodates these different plot types.
Matplotlib subplots_adjust for Shared Axes
When creating subplots with shared axes, you may need to adjust the spacing to ensure that labels and tick marks are visible and not overlapping. Matplotlib subplots_adjust can help you fine-tune the layout in these cases.
Here’s an example that demonstrates how to use matplotlib subplots_adjust with shared axes:
import matplotlib.pyplot as plt
import numpy as np

# Create a figure with four subplots sharing axes
fig, ((ax1, ax2), (ax3, ax4)) = plt.subplots(2, 2, figsize=(10, 8), sharex='col', sharey='row')

# Plot some data
x = np.linspace(0, 10, 100)
ax1.plot(x, np.sin(x))
ax2.plot(x, np.cos(x))
ax3.plot(x, np.tan(x))
ax4.plot(x, np.exp(x))

# Add titles
ax1.set_title('Sine Wave - how2matplotlib.com')
ax2.set_title('Cosine Wave - how2matplotlib.com')
ax3.set_title('Tangent Wave - how2matplotlib.com')
ax4.set_title('Exponential Function - how2matplotlib.com')

# Adjust the spacing for shared axes
plt.subplots_adjust(left=0.1, right=0.95, bottom=0.1, top=0.95, wspace=0.2, hspace=0.3)

plt.show()
Output:
In this example, we create four subplots with shared x-axes for each column and shared y-axes for each row. We use matplotlib subplots_adjust to fine-tune the spacing, ensuring that all labels and tick marks are visible without overlapping.
Matplotlib subplots_adjust for Polar Plots
When working with polar plots, you may need to adjust the spacing differently compared to Cartesian plots. Matplotlib subplots_adjust can help you create an optimal layout for polar plots as well.
Here’s an example that demonstrates how to use matplotlib subplots_adjust with polar plots:
import matplotlib.pyplot as plt
import numpy as np

# Create a figure with two polar subplots
fig, (ax1, ax2) = plt.subplots(1, 2, figsize=(12, 5), subplot_kw=dict(projection='polar'))

# Create some data
r = np.linspace(0, 2, 100)
theta = 2 * np.pi * r

# Plot the data
ax1.plot(theta, r)
ax2.plot(theta, r**2)

# Add titles
ax1.set_title('Linear Spiral - how2matplotlib.com')
ax2.set_title('Quadratic Spiral - how2matplotlib.com')

# Adjust the spacing for polar plots
plt.subplots_adjust(left=0.1, right=0.9, bottom=0.1, top=0.9, wspace=0.3)

plt.show()
Output:
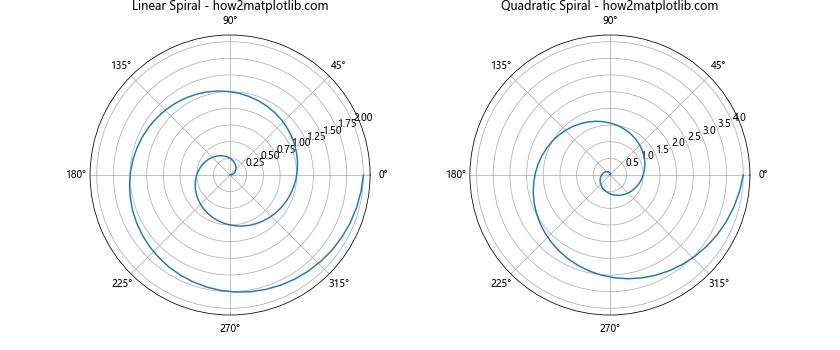
In this example, we create two polar subplots. We use matplotlib subplots_adjust to increase the spacing between the subplots (wspace=0.3) and adjust the margins to ensure that both polar plots are fully visible and well-spaced.
Matplotlib subplots_adjust for 3D Plots
When working with 3D plots, you may need to adjust the spacing to accommodate the additional depth dimension. Matplotlib subplots_adjust can help you create an optimal layout for 3D plots as well.
Here’s an example that demonstrates how to use matplotlib subplots_adjust with 3D plots:
import matplotlib.pyplot as plt
import numpy as np
from mpl_toolkits.mplot3d import Axes3D

# Create a figure with two 3D subplots
fig = plt.figure(figsize=(12, 5))
ax1 = fig.add_subplot(121, projection='3d')
ax2 = fig.add_subplot(122, projection='3d')

# Create some data
x = np.linspace(-5, 5, 100)
y = np.linspace(-5, 5, 100)
X, Y = np.meshgrid(x, y)
Z1 = np.sin(np.sqrt(X**2 + Y**2))
Z2 = np.cos(np.sqrt(X**2 + Y**2))

# Plot the data
surf1 = ax1.plot_surface(X, Y, Z1, cmap='viridis')
surf2 = ax2.plot_surface(X, Y, Z2, cmap='plasma')

# Add titles
ax1.set_title('3D Sine Function - how2matplotlib.com')
ax2.set_title('3D Cosine Function - how2matplotlib.com')

# Adjust the spacing for 3D plots
plt.subplots_adjust(left=0.05, right=0.95, bottom=0.05, top=0.95, wspace=0.2)

plt.show()
Output:
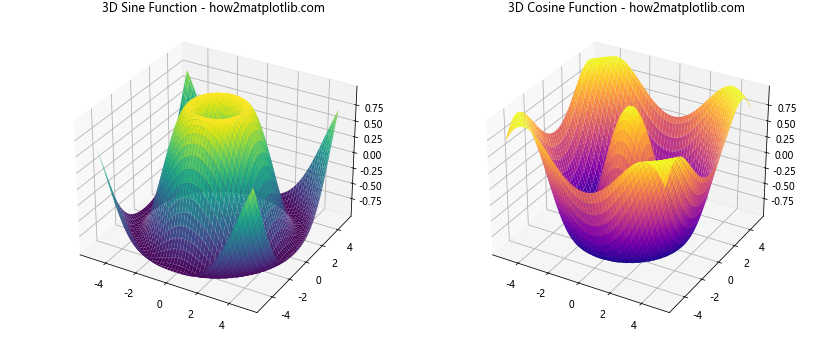
In this example, we create two 3D subplots. We use matplotlib subplots_adjust to fine-tune the spacing, ensuring that both 3D plots are fully visible and well-spaced.
Matplotlib subplots_adjust for Animations
When creating animations with matplotlib, you may need to adjust the spacing to ensure that all elements are visible throughout the animation. Matplotlib subplots_adjust can be used in conjunction with animation functions to create well-spaced animated plots.
Here’s an example that demonstrates how to use matplotlib subplots_adjust with animations:
import matplotlib.pyplot as plt
import numpy as np
from matplotlib.animation import FuncAnimation

# Create a figure with two subplots
fig, (ax1, ax2) = plt.subplots(2, 1, figsize=(8, 8))

# Initialize empty plots
line1, = ax1.plot([], [], lw=2)
line2, = ax2.plot([], [], lw=2)

# Set up plot limits
ax1.set_xlim(0, 2*np.pi)
ax1.set_ylim(-1, 1)
ax2.set_xlim(0, 2*np.pi)
ax2.set_ylim(-1, 1)

# Add titles
ax1.set_title('Sine Wave Animation - how2matplotlib.com')
ax2.set_title('Cosine Wave Animation - how2matplotlib.com')

# Adjust the spacing
plt.subplots_adjust(left=0.1, right=0.9, bottom=0.1, top=0.9, hspace=0.4)

# Animation function
def animate(frame):
    x = np.linspace(0, 2*np.pi, 1000)
    y1 = np.sin(x + frame/10)
    y2 = np.cos(x + frame/10)
    line1.set_data(x, y1)
    line2.set_data(x, y2)
    return line1, line2

# Create the animation
anim = FuncAnimation(fig, animate, frames=100, interval=50, blit=True)

plt.show()
Output:
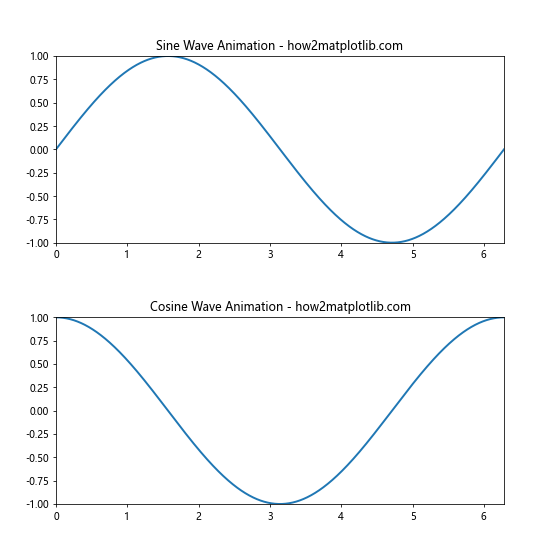
In this example, we create an animation with two subplots showing animated sine and cosine waves. We use matplotlib subplots_adjust to increase the spacing between the subplots (hspace=0.4) and adjust the margins to ensure that both animated plots are fully visible throughout the animation.
Conclusion: Mastering Matplotlib subplots_adjust
Throughout this comprehensive guide, we’ve explored the power and versatility of matplotlib subplots_adjust. We’ve seen how this function can be used to fine-tune the layout of subplots in a wide variety of scenarios, from simple two-plot layouts to complex multi-plot figures, and even in animations.
Key takeaways from this guide include:
- Matplotlib subplots_adjust provides fine-grained control over subplot spacing and margins.
- The function offers six main parameters: left, right, bottom, top, wspace, and hspace.
- Matplotlib subplots_adjust can be used in conjunction with other layout functions like tight_layout() for even more control.
- It’s particularly useful for complex layouts, plots with annotations or colorbars, and plots with different aspect ratios.
- Matplotlib subplots_adjust can be applied to various types of plots, including polar plots and 3D plots.
- When creating animations, matplotlib subplots_adjust can help ensure all elements remain visible throughout the animation.
By mastering matplotlib subplots_adjust, you’ll be able to create perfectly spaced and visually appealing plots for any data visualization scenario. Remember to experiment with the parameters to find the optimal layout for your specific plots, and don’t hesitate to combine subplots_adjust with other matplotlib functions for even more control over your visualizations.
As you continue to work with matplotlib, you’ll find that subplots_adjust becomes an indispensable tool in your data visualization toolkit. Whether you’re creating simple plots for personal analysis or complex visualizations for professional presentations, the ability to fine-tune your subplot layouts will help you communicate your data more effectively and create more impactful visualizations.