How to Add a Y-Axis Label to the Secondary Y-Axis in Matplotlib
How to Add a Y-Axis Label to the Secondary Y-Axis in Matplotlib is an essential skill for data visualization enthusiasts and professionals alike. Matplotlib, a powerful plotting library for Python, offers various ways to customize and enhance your plots. One of the most common requirements when working with dual-axis plots is adding a label to the secondary y-axis. This article will provide a detailed exploration of the techniques and best practices for adding y-axis labels to the secondary y-axis in Matplotlib.
Understanding the Importance of Secondary Y-Axis Labels
Before diving into the specifics of how to add a y-axis label to the secondary y-axis in Matplotlib, it’s crucial to understand why this feature is important. When creating plots with two different scales or units on the y-axis, a secondary y-axis becomes necessary to represent the data accurately. Adding a label to this secondary y-axis helps viewers understand the context and meaning of the plotted data.
For example, you might want to plot temperature and humidity on the same graph, with temperature on the primary y-axis and humidity on the secondary y-axis. In this case, adding appropriate labels to both axes is crucial for clear communication of the data.
Let’s start with a simple example of how to create a plot with a secondary y-axis and add labels to both axes:
import matplotlib.pyplot as plt
import numpy as np

# Generate sample data
x = np.linspace(0, 10, 100)
y1 = np.sin(x)
y2 = np.cos(x)

# Create the figure and primary y-axis
fig, ax1 = plt.subplots()

# Plot data on the primary y-axis
ax1.plot(x, y1, 'b-', label='Sine')
ax1.set_xlabel('X-axis')
ax1.set_ylabel('Primary Y-axis (Sine)', color='b')
ax1.tick_params(axis='y', labelcolor='b')

# Create the secondary y-axis
ax2 = ax1.twinx()

# Plot data on the secondary y-axis
ax2.plot(x, y2, 'r-', label='Cosine')
ax2.set_ylabel('Secondary Y-axis (Cosine)', color='r')
ax2.tick_params(axis='y', labelcolor='r')

# Add a title
plt.title('How to Add a Y-Axis Label to the Secondary Y-Axis in Matplotlib')

# Add legend
lines1, labels1 = ax1.get_legend_handles_labels()
lines2, labels2 = ax2.get_legend_handles_labels()
ax1.legend(lines1 + lines2, labels1 + labels2, loc='upper right')

plt.tight_layout()
plt.show()
Output:
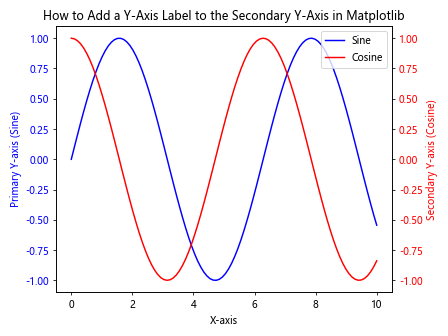
In this example, we’ve created a plot with two y-axes, each with its own label. The primary y-axis (left) shows the sine function, while the secondary y-axis (right) displays the cosine function. Both axes have distinct labels and colors to differentiate them.
Methods for Adding Y-Axis Labels to the Secondary Y-Axis
Now that we understand the basics, let’s explore different methods for adding y-axis labels to the secondary y-axis in Matplotlib. We’ll cover various techniques and scenarios to help you master this skill.
Method 1: Using the set_ylabel() Function
The most straightforward method to add a y-axis label to the secondary y-axis in Matplotlib is by using the set_ylabel() function. This function allows you to set the label text, color, and other properties.
Here’s an example demonstrating how to use set_ylabel() for both primary and secondary y-axes:
import matplotlib.pyplot as plt
import numpy as np

# Generate sample data
x = np.linspace(0, 10, 100)
y1 = np.exp(x)
y2 = np.log(x)

# Create the figure and primary y-axis
fig, ax1 = plt.subplots()

# Plot data on the primary y-axis
ax1.plot(x, y1, 'b-', label='Exponential')
ax1.set_xlabel('X-axis')
ax1.set_ylabel('Primary Y-axis (Exponential)', color='b')
ax1.tick_params(axis='y', labelcolor='b')

# Create the secondary y-axis
ax2 = ax1.twinx()

# Plot data on the secondary y-axis
ax2.plot(x, y2, 'r-', label='Logarithmic')
ax2.set_ylabel('Secondary Y-axis (Logarithmic)', color='r')
ax2.tick_params(axis='y', labelcolor='r')

# Add a title
plt.title('How to Add a Y-Axis Label to the Secondary Y-Axis in Matplotlib')

# Add legend
lines1, labels1 = ax1.get_legend_handles_labels()
lines2, labels2 = ax2.get_legend_handles_labels()
ax1.legend(lines1 + lines2, labels1 + labels2, loc='upper left')

plt.tight_layout()
plt.show()
Output:
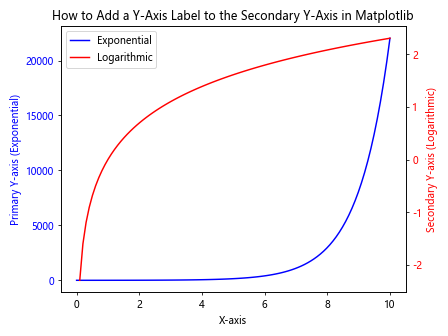
In this example, we’ve used set_ylabel() to add labels to both the primary and secondary y-axes. The primary y-axis shows an exponential function, while the secondary y-axis displays a logarithmic function. Each axis has its own color-coded label for clarity.
Method 2: Customizing Y-Axis Label Properties
When adding a y-axis label to the secondary y-axis in Matplotlib, you may want to customize various properties of the label, such as font size, style, or rotation. The set_ylabel() function accepts additional parameters to achieve this customization.
Here’s an example demonstrating how to customize y-axis label properties:
import matplotlib.pyplot as plt
import numpy as np

# Generate sample data
x = np.linspace(0, 10, 100)
y1 = x**2
y2 = x**3

# Create the figure and primary y-axis
fig, ax1 = plt.subplots()

# Plot data on the primary y-axis
ax1.plot(x, y1, 'b-', label='Quadratic')
ax1.set_xlabel('X-axis')
ax1.set_ylabel('Primary Y-axis (Quadratic)', color='b', fontsize=12, fontweight='bold')
ax1.tick_params(axis='y', labelcolor='b')

# Create the secondary y-axis
ax2 = ax1.twinx()

# Plot data on the secondary y-axis
ax2.plot(x, y2, 'r-', label='Cubic')
ax2.set_ylabel('Secondary Y-axis (Cubic)', color='r', fontsize=12, fontweight='bold', rotation=-90, labelpad=15)
ax2.tick_params(axis='y', labelcolor='r')

# Add a title
plt.title('How to Add a Y-Axis Label to the Secondary Y-Axis in Matplotlib')

# Add legend
lines1, labels1 = ax1.get_legend_handles_labels()
lines2, labels2 = ax2.get_legend_handles_labels()
ax1.legend(lines1 + lines2, labels1 + labels2, loc='upper left')

plt.tight_layout()
plt.show()
Output:
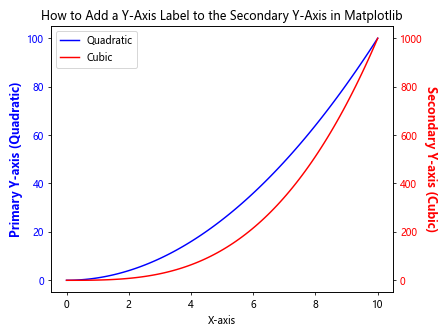
In this example, we’ve customized the y-axis labels for both the primary and secondary axes. The primary y-axis label is set to bold with a font size of 12, while the secondary y-axis label is also bold, with a font size of 12, rotated 90 degrees counterclockwise, and given extra padding.
Method 3: Using Text Annotation for Y-Axis Labels
Another approach to add a y-axis label to the secondary y-axis in Matplotlib is by using text annotation. This method gives you more control over the label’s position and orientation.
Here’s an example demonstrating how to use text annotation for y-axis labels:
import matplotlib.pyplot as plt
import numpy as np

# Generate sample data
x = np.linspace(0, 10, 100)
y1 = np.sin(x)
y2 = np.cos(x)

# Create the figure and primary y-axis
fig, ax1 = plt.subplots()

# Plot data on the primary y-axis
ax1.plot(x, y1, 'b-', label='Sine')
ax1.set_xlabel('X-axis')
ax1.tick_params(axis='y', labelcolor='b')

# Create the secondary y-axis
ax2 = ax1.twinx()

# Plot data on the secondary y-axis
ax2.plot(x, y2, 'r-', label='Cosine')
ax2.tick_params(axis='y', labelcolor='r')

# Add y-axis labels using text annotation
ax1.text(-0.1, 0.5, 'Primary Y-axis (Sine)', color='b', rotation=90, va='center', ha='right', transform=ax1.transAxes)
ax2.text(1.1, 0.5, 'Secondary Y-axis (Cosine)', color='r', rotation=-90, va='center', ha='left', transform=ax2.transAxes)

# Add a title
plt.title('How to Add a Y-Axis Label to the Secondary Y-Axis in Matplotlib')

# Add legend
lines1, labels1 = ax1.get_legend_handles_labels()
lines2, labels2 = ax2.get_legend_handles_labels()
ax1.legend(lines1 + lines2, labels1 + labels2, loc='upper right')

plt.tight_layout()
plt.show()
Output:
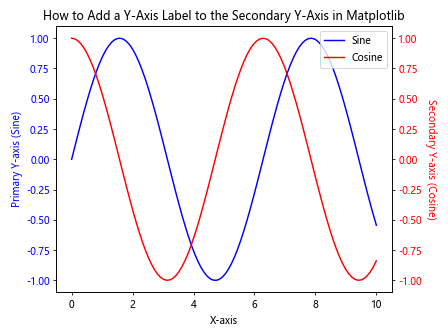
In this example, we’ve used the text() function to add y-axis labels as text annotations. This method allows for precise positioning of the labels and offers more flexibility in terms of orientation and placement.
Method 4: Adding Y-Axis Labels to Multiple Secondary Y-Axes
In some cases, you may need to add y-axis labels to multiple secondary y-axes. Matplotlib allows you to create multiple secondary y-axes, each with its own label.
Here’s an example demonstrating how to add y-axis labels to multiple secondary y-axes:
import matplotlib.pyplot as plt
import numpy as np

# Generate sample data
x = np.linspace(0, 10, 100)
y1 = np.sin(x)
y2 = np.cos(x)
y3 = np.tan(x)

# Create the figure and primary y-axis
fig, ax1 = plt.subplots()

# Plot data on the primary y-axis
ax1.plot(x, y1, 'b-', label='Sine')
ax1.set_xlabel('X-axis')
ax1.set_ylabel('Primary Y-axis (Sine)', color='b')
ax1.tick_params(axis='y', labelcolor='b')

# Create the first secondary y-axis
ax2 = ax1.twinx()

# Plot data on the first secondary y-axis
ax2.plot(x, y2, 'r-', label='Cosine')
ax2.set_ylabel('Secondary Y-axis 1 (Cosine)', color='r')
ax2.tick_params(axis='y', labelcolor='r')

# Create the second secondary y-axis
ax3 = ax1.twinx()

# Offset the right spine of ax3 to the right
ax3.spines['right'].set_position(('axes', 1.2))

# Plot data on the second secondary y-axis
ax3.plot(x, y3, 'g-', label='Tangent')
ax3.set_ylabel('Secondary Y-axis 2 (Tangent)', color='g')
ax3.tick_params(axis='y', labelcolor='g')

# Add a title
plt.title('How to Add a Y-Axis Label to the Secondary Y-Axis in Matplotlib')

# Add legend
lines1, labels1 = ax1.get_legend_handles_labels()
lines2, labels2 = ax2.get_legend_handles_labels()
lines3, labels3 = ax3.get_legend_handles_labels()
ax1.legend(lines1 + lines2 + lines3, labels1 + labels2 + labels3, loc='upper right')

plt.tight_layout()
plt.show()
Output:
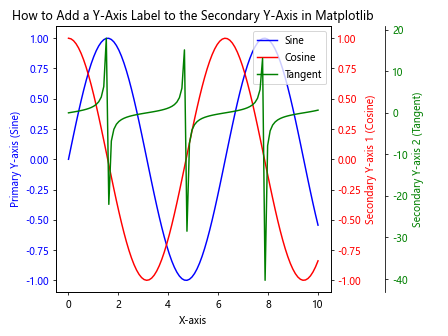
In this example, we’ve created two secondary y-axes in addition to the primary y-axis. Each axis has its own label and color scheme. The second secondary y-axis is offset to the right to avoid overlapping with the first secondary y-axis.
Advanced Techniques for Y-Axis Label Customization
Now that we’ve covered the basics of how to add a y-axis label to the secondary y-axis in Matplotlib, let’s explore some advanced techniques for further customization.
Technique 1: Using LaTeX for Mathematical Expressions in Y-Axis Labels
Matplotlib supports LaTeX rendering for text, allowing you to include mathematical expressions in your y-axis labels. This is particularly useful when dealing with scientific or mathematical data.
Here’s an example demonstrating how to use LaTeX in y-axis labels:
import matplotlib.pyplot as plt
import numpy as np

# Enable LaTeX rendering
plt.rcParams['text.usetex'] = True
plt.rcParams['font.family'] = 'serif'

# Generate sample data
x = np.linspace(0, 10, 100)
y1 = np.sin(x)
y2 = np.cos(x)

# Create the figure and primary y-axis
fig, ax1 = plt.subplots()

# Plot data on the primary y-axis
ax1.plot(x, y1, 'b-', label='Sine')
ax1.set_xlabel('X-axis')
ax1.set_ylabel(r'Primary Y-axis ($\sin(x)$)', color='b')
ax1.tick_params(axis='y', labelcolor='b')

# Create the secondary y-axis
ax2 = ax1.twinx()

# Plot data on the secondary y-axis
ax2.plot(x, y2, 'r-', label='Cosine')
ax2.set_ylabel(r'Secondary Y-axis ($\cos(x)$)', color='r')
ax2.tick_params(axis='y', labelcolor='r')

# Add a title
plt.title('How to Add a Y-Axis Label to the Secondary Y-Axis in Matplotlib')

# Add legend
lines1, labels1 = ax1.get_legend_handles_labels()
lines2, labels2 = ax2.get_legend_handles_labels()
ax1.legend(lines1 + lines2, labels1 + labels2, loc='upper right')

plt.tight_layout()
plt.show()
In this example, we’ve used LaTeX rendering to include mathematical expressions (sin(x) and cos(x)) in the y-axis labels. This technique is particularly useful when dealing with complex mathematical or scientific notation.
Technique 2: Adding Gradient Colors to Y-Axis Labels
To make your y-axis labels more visually appealing, you can add gradient colors. This technique can help distinguish between different axes and add a professional touch to your plots.
Here’s an example demonstrating how to add gradient colors to y-axis labels:
import matplotlib.pyplot as plt
import numpy as np
from matplotlib.colors import LinearSegmentedColormap

# Generate sample data
x = np.linspace(0, 10, 100)
y1 = np.exp(x)
y2 = np.log(x)

# Create custom colormaps
cmap1 = LinearSegmentedColormap.from_list("", ["blue", "cyan"])
cmap2 = LinearSegmentedColormap.from_list("", ["red", "yellow"])

# Create the figure and primary y-axis
fig, ax1 = plt.subplots()

# Plot data on the primary y-axis
ax1.plot(x, y1, 'b-', label='Exponential')
ax1.set_xlabel('X-axis')
ax1.tick_params(axis='y', labelcolor='b')

# Create the secondary y-axis
ax2 = ax1.twinx()

# Plot data on the secondary y-axis
ax2.plot(x, y2, 'r-', label='Logarithmic')
ax2.tick_params(axis='y', labelcolor='r')

# Add gradient-colored y-axis labels
gradient1 = np.linspace(0, 1, 256).reshape(1, -1)
gradient2 = np.linspace(0, 1, 256).reshape(1, -1)

ax1.imshow(gradient1, cmap=cmap1, aspect='auto', extent=[-1, -0.5, 0, 1])
ax1.text(-0.7, 0.5, 'Primary Y-axis (Exponential)', rotation=90, va='center', ha='center', fontweight='bold')

ax2.imshow(gradient2, cmap=cmap2, aspect='auto', extent=[1, 1.5, 0, 1])
ax2.text(1.3, 0.5, 'Secondary Y-axis (Logarithmic)', rotation=-90, va='center', ha='center', fontweight='bold')

# Add a title
plt.title('How to Add a Y-Axis Label to the Secondary Y-Axis in Matplotlib')

# Add legend
lines1, labels1 = ax1.get_legend_handles_labels()
lines2, labels2 = ax2.get_legend_handles_labels()
ax1.legend(lines1 + lines2, labels1 + labels2, loc='upper left')

plt.tight_layout()
plt.show()
Output:
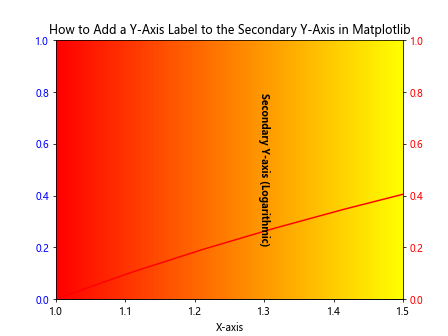
In this example, we’ve created custom colormaps and used them to add gradient-colored backgrounds to the y-axis labels. This technique adds a visually appealing element to the plot while still clearly distinguishing between the primary and secondary y-axes.
Technique 3: Adding Icons or Symbols to Y-Axis Labels
To make your y-axis labels more informative or visually interesting, you can add icons or symbols alongside the text. This can be particularly useful when dealing with specific units or categories.
Here’s an example demonstrating how to add icons to y-axis labels:
import matplotlib.pyplot as plt
import numpy as np
from matplotlib.offsetbox import OffsetImage, AnnotationBbox

# Generate sample data
x = np.linspace(0, 10, 100)
y1 = np.sin(x)
y2 = np.cos(x)

# Create the figure and primary y-axis
fig, ax1 = plt.subplots()

# Plot data on the primary y-axis
ax1.plot(x, y1, 'b-', label='Temperature')
ax1.set_xlabel('X-axis')
ax1.tick_params(axis='y', labelcolor='b')

# Create the secondary y-axis
ax2 = ax1.twinx()

# Plot data on the secondary y-axis
ax2.plot(x, y2, 'r-', label='Humidity')
ax2.tick_params(axis='y', labelcolor='r')

# Add y-axis labels with icons
def add_icon(ax, icon_path, label, color, x, y, rotation):
    icon = plt.imread(icon_path)
    im = OffsetImage(icon, zoom=0.03)
    ab = AnnotationBbox(im, (x, y), xycoords='axes fraction', frameon=False)
    ax.add_artist(ab)
    ax.text(x, y, f' {label}', color=color, rotation=rotation, va='center', ha='left' if rotation == 0 else 'center')

add_icon(ax1, 'temperature_icon.png', 'Temperature (°C)', 'b', -0.1, 0.5, 90)
add_icon(ax2, 'humidity_icon.png', 'Humidity (%)', 'r', 1.1, 0.5, -90)

# Add a title
plt.title('How to Add a Y-Axis Label to the Secondary Y-Axis in Matplotlib')

# Add legend
lines1, labels1 = ax1.get_legend_handles_labels()
lines2, labels2 = ax2.get_legend_handles_labels()
ax1.legend(lines1 + lines2, labels1 + labels2, loc='upper right')

plt.tight_layout()
plt.show()
In this example, we’ve added custom icons to the y-axis labels using the OffsetImage and AnnotationBbox classes. This technique allows you to include small images or symbols alongside your y-axis labels, making them more informative and visually appealing.
Best Practices for Adding Y-Axis Labels to Secondary Y-Axes
When adding y-axis labels to secondary y-axes in Matplotlib, it’s important to follow some best practices to ensure your plots are clear, informative, and visually appealing. Here are some guidelines to keep in mind:
- Use clear and concise labels: Make sure your y-axis labels are easy to understand and accurately describe the data being displayed.
Choose appropriate colors: Use contrasting colors for primary and secondary y-axis labels to make them easily distinguishable.
Maintain consistency: If you’re creating multiple plots, use consistent labeling conventions across all of them.
Avoid overcrowding: If you have multiple y-axes, make sure the labels don’t overlap or clutter the plot.
Consider rotation: Rotating y-axis labels can sometimes improve readability, especially for longer labels.
Use units: Include units of measurement in your y-axis labels when applicable.
Adjust font size: Make sure your y-axis labels are legible by choosing an appropriate font size.
Align labels properly: Ensure that y-axis labels are properly aligned with their respective axes.
Use LaTeX for mathematical expressions: When dealing with complex mathematical notation, use LaTeX rendering for clarity.
Test for accessibility: Consider color-blind friendly color schemes and ensure that your labels are readable for all users.
Let’s apply these best practices in an example: