How to Add a Title to a Matplotlib Legend
How to add a title to a Matplotlib legend is an essential skill for creating informative and professional-looking visualizations. This article will explore various methods and techniques for adding titles to legends in Matplotlib, providing detailed explanations and examples along the way.
Understanding the Importance of Legend Titles
Before diving into the specifics of how to add a title to a Matplotlib legend, it’s crucial to understand why legend titles are important. Legend titles provide context and clarity to your plots, making them more accessible and informative for your audience. By learning how to add a title to a Matplotlib legend, you can enhance the overall quality and effectiveness of your data visualizations.
Basic Method: Using the title Parameter
The simplest way to add a title to a Matplotlib legend is by using the title parameter in the legend() function. This method is straightforward and works well for most basic plotting scenarios.
Here’s a simple example of how to add a title to a Matplotlib legend using this method:
import matplotlib.pyplot as plt

# Create some sample data
x = [1, 2, 3, 4, 5]
y1 = [2, 4, 6, 8, 10]
y2 = [1, 3, 5, 7, 9]

# Create the plot
plt.figure(figsize=(8, 6))
plt.plot(x, y1, label='Line 1')
plt.plot(x, y2, label='Line 2')

# Add a legend with a title
plt.legend(title='How to add a title to a Matplotlib legend\nhow2matplotlib.com')

plt.xlabel('X-axis')
plt.ylabel('Y-axis')
plt.title('Sample Plot with Legend Title')
plt.show()
Output:
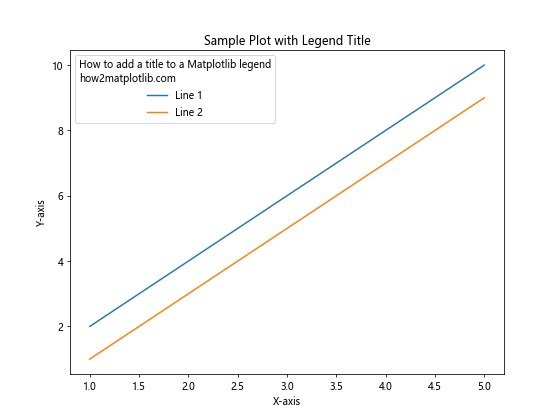
In this example, we create a simple plot with two lines and add a legend with a title using the title parameter in the legend() function. The title “How to add a title to a Matplotlib legend” is added to the legend, along with the website URL “how2matplotlib.com”.
Customizing Legend Title Appearance
When learning how to add a title to a Matplotlib legend, it’s important to know that you can customize the appearance of the legend title to match your visualization style. Matplotlib provides various options to modify the font size, color, and style of the legend title.
Here’s an example demonstrating how to customize the legend title appearance:
import matplotlib.pyplot as plt

# Create some sample data
x = [1, 2, 3, 4, 5]
y1 = [2, 4, 6, 8, 10]
y2 = [1, 3, 5, 7, 9]

# Create the plot
plt.figure(figsize=(8, 6))
plt.plot(x, y1, label='Line 1')
plt.plot(x, y2, label='Line 2')

# Add a legend with a customized title
legend = plt.legend(title='How to add a title to a Matplotlib legend\nhow2matplotlib.com')
plt.setp(legend.get_title(), fontsize='12', color='red', fontweight='bold')

plt.xlabel('X-axis')
plt.ylabel('Y-axis')
plt.title('Sample Plot with Customized Legend Title')
plt.show()
Output:
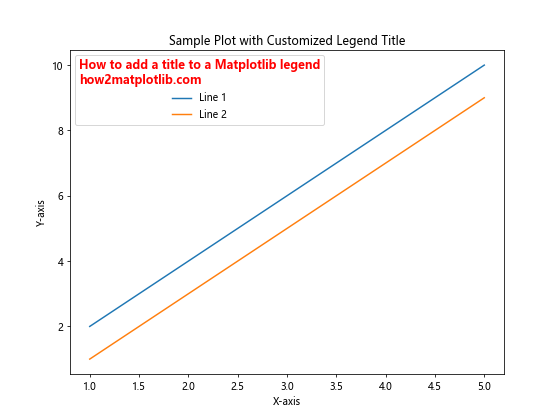
In this example, we use the setp() function to customize the legend title’s appearance. We set the font size to 12, color to red, and make it bold. This demonstrates how to add a title to a Matplotlib legend with custom styling.
Adding a Title to a Legend Outside the Plot Area
Sometimes, you may want to position the legend outside the plot area. In such cases, you can still add a title to the Matplotlib legend using a slightly different approach.
Here’s an example of how to add a title to a Matplotlib legend positioned outside the plot area:
import matplotlib.pyplot as plt

# Create some sample data
x = [1, 2, 3, 4, 5]
y1 = [2, 4, 6, 8, 10]
y2 = [1, 3, 5, 7, 9]

# Create the plot
fig, ax = plt.subplots(figsize=(10, 6))
ax.plot(x, y1, label='Line 1')
ax.plot(x, y2, label='Line 2')

# Add a legend outside the plot area with a title
legend = ax.legend(title='How to add a title to a Matplotlib legend\nhow2matplotlib.com',
                   loc='center left', bbox_to_anchor=(1, 0.5))

ax.set_xlabel('X-axis')
ax.set_ylabel('Y-axis')
ax.set_title('Sample Plot with Legend Outside')
plt.tight_layout()
plt.show()
Output:
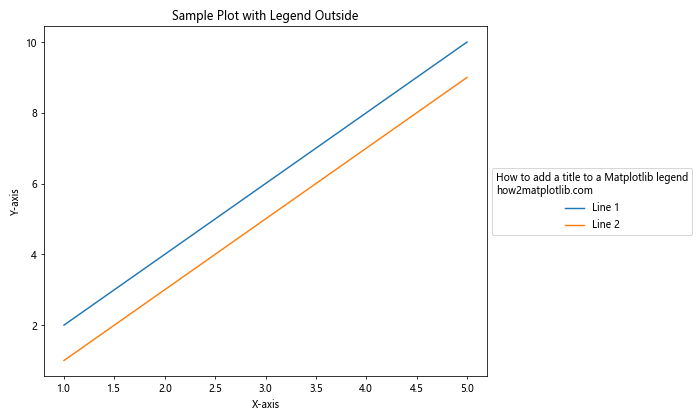
In this example, we position the legend outside the plot area using the bbox_to_anchor parameter. The legend title is added using the title parameter, demonstrating how to add a title to a Matplotlib legend in different plot configurations.
Using ax.legend() vs plt.legend()
When learning how to add a title to a Matplotlib legend, it’s important to understand the difference between using ax.legend() and plt.legend(). The former is used when working with Axes objects, while the latter is used in the pyplot interface.
Here’s an example comparing both approaches:
import matplotlib.pyplot as plt

# Create some sample data
x = [1, 2, 3, 4, 5]
y1 = [2, 4, 6, 8, 10]
y2 = [1, 3, 5, 7, 9]

# Create a figure with two subplots
fig, (ax1, ax2) = plt.subplots(1, 2, figsize=(12, 5))

# Plot on the first subplot using ax.legend()
ax1.plot(x, y1, label='Line 1')
ax1.plot(x, y2, label='Line 2')
ax1.legend(title='How to add a title to a Matplotlib legend\nax.legend() - how2matplotlib.com')
ax1.set_title('Using ax.legend()')

# Plot on the second subplot using plt.legend()
plt.sca(ax2)
plt.plot(x, y1, label='Line 1')
plt.plot(x, y2, label='Line 2')
plt.legend(title='How to add a title to a Matplotlib legend\nplt.legend() - how2matplotlib.com')
plt.title('Using plt.legend()')

plt.tight_layout()
plt.show()
Output:
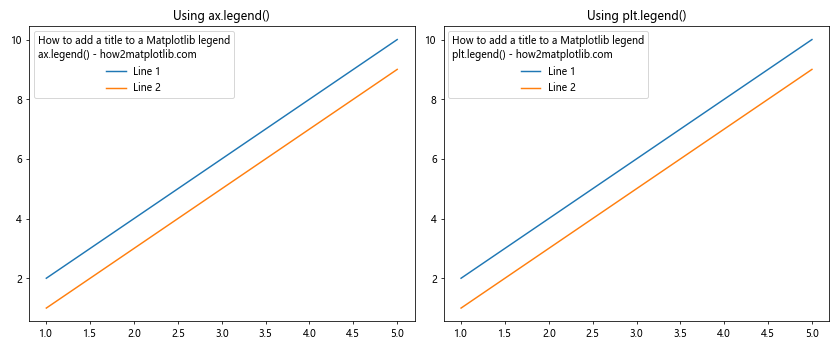
This example demonstrates how to add a title to a Matplotlib legend using both ax.legend() and plt.legend(). The first subplot uses the Axes object method, while the second subplot uses the pyplot interface.
Adding Multiple Legend Titles
In some cases, you might want to add multiple titles to your Matplotlib legend. While there isn’t a built-in method to do this directly, you can achieve this effect by combining legend titles with additional text elements.
Here’s an example of how to add multiple titles to a Matplotlib legend:
import matplotlib.pyplot as plt

# Create some sample data
x = [1, 2, 3, 4, 5]
y1 = [2, 4, 6, 8, 10]
y2 = [1, 3, 5, 7, 9]

# Create the plot
fig, ax = plt.subplots(figsize=(8, 6))
ax.plot(x, y1, label='Line 1')
ax.plot(x, y2, label='Line 2')

# Add a legend with a primary title
legend = ax.legend(title='How to add a title to a Matplotlib legend\nhow2matplotlib.com')

# Add a secondary title above the legend
ax.text(1.05, 1.05, 'Secondary Title', transform=ax.transAxes,
        fontweight='bold', va='top', ha='left')

ax.set_xlabel('X-axis')
ax.set_ylabel('Y-axis')
ax.set_title('Sample Plot with Multiple Legend Titles')
plt.tight_layout()
plt.show()
Output:
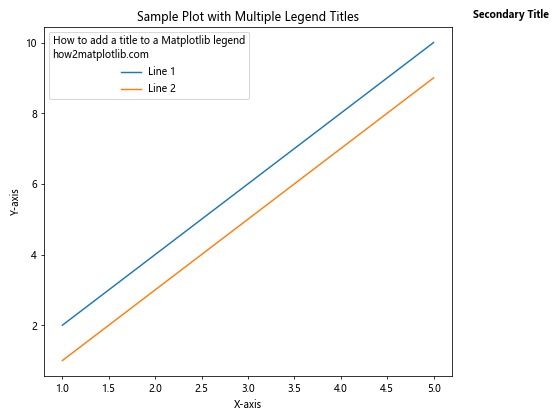
In this example, we add a primary title to the legend using the title parameter, and then use the ax.text() method to add a secondary title above the legend. This demonstrates a creative way to add multiple titles when learning how to add a title to a Matplotlib legend.
Adding a Title to a Legend in Subplots
When working with subplots, you might want to add titles to legends in each subplot. Here’s an example of how to add a title to a Matplotlib legend in a subplot configuration:
import matplotlib.pyplot as plt

# Create some sample data
x = [1, 2, 3, 4, 5]
y1 = [2, 4, 6, 8, 10]
y2 = [1, 3, 5, 7, 9]

# Create a figure with two subplots
fig, (ax1, ax2) = plt.subplots(1, 2, figsize=(12, 5))

# Plot on the first subplot
ax1.plot(x, y1, label='Line 1')
ax1.plot(x, y2, label='Line 2')
ax1.legend(title='How to add a title to a Matplotlib legend\nSubplot 1 - how2matplotlib.com')
ax1.set_title('Subplot 1')

# Plot on the second subplot
ax2.plot(x, y2, label='Line 3')
ax2.plot(x, y1, label='Line 4')
ax2.legend(title='How to add a title to a Matplotlib legend\nSubplot 2 - how2matplotlib.com')
ax2.set_title('Subplot 2')

plt.tight_layout()
plt.show()
Output:
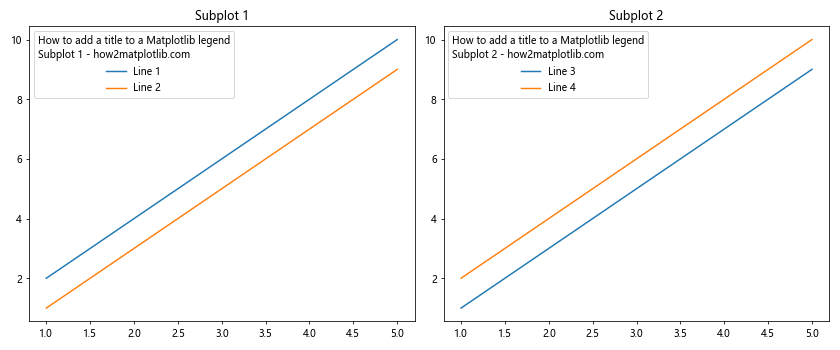
This example demonstrates how to add a title to a Matplotlib legend in each subplot of a figure. Each legend has its own title, showing how this technique can be applied to more complex plot layouts.
Using a Custom Legend Title Location
Sometimes, you might want to position the legend title in a custom location relative to the legend box. Here’s an example of how to add a title to a Matplotlib legend with a custom title location:
import matplotlib.pyplot as plt

# Create some sample data
x = [1, 2, 3, 4, 5]
y1 = [2, 4, 6, 8, 10]
y2 = [1, 3, 5, 7, 9]

# Create the plot
fig, ax = plt.subplots(figsize=(8, 6))
ax.plot(x, y1, label='Line 1')
ax.plot(x, y2, label='Line 2')

# Add a legend with a custom title location
legend = ax.legend(loc='upper right')
legend.set_title('How to add a title to a Matplotlib legend\nhow2matplotlib.com', prop={'size': 10})
legend._loc = 3  # Place the title on top of the legend box

ax.set_xlabel('X-axis')
ax.set_ylabel('Y-axis')
ax.set_title('Sample Plot with Custom Legend Title Location')
plt.show()
Output:
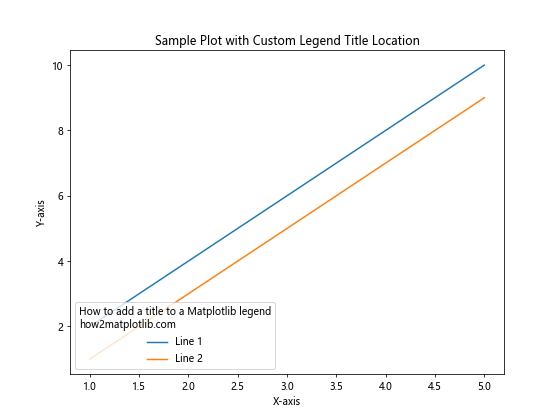
In this example, we create the legend first, then set its title using the set_title() method. By adjusting the _loc attribute of the legend, we can control the position of the title relative to the legend box.
Adding a Title to a Legend with Multiple Columns
When dealing with many legend entries, you might want to organize them into multiple columns. Here’s how to add a title to a Matplotlib legend with multiple columns:
import matplotlib.pyplot as plt

# Create some sample data
x = [1, 2, 3, 4, 5]
y1 = [2, 4, 6, 8, 10]
y2 = [1, 3, 5, 7, 9]
y3 = [3, 5, 7, 9, 11]
y4 = [4, 6, 8, 10, 12]

# Create the plot
fig, ax = plt.subplots(figsize=(10, 6))
ax.plot(x, y1, label='Line 1')
ax.plot(x, y2, label='Line 2')
ax.plot(x, y3, label='Line 3')
ax.plot(x, y4, label='Line 4')

# Add a legend with multiple columns and a title
legend = ax.legend(title='How to add a title to a Matplotlib legend\nhow2matplotlib.com',
                   ncol=2, loc='upper center', bbox_to_anchor=(0.5, -0.05))

ax.set_xlabel('X-axis')
ax.set_ylabel('Y-axis')
ax.set_title('Sample Plot with Multi-column Legend')
plt.tight_layout()
plt.show()
Output:
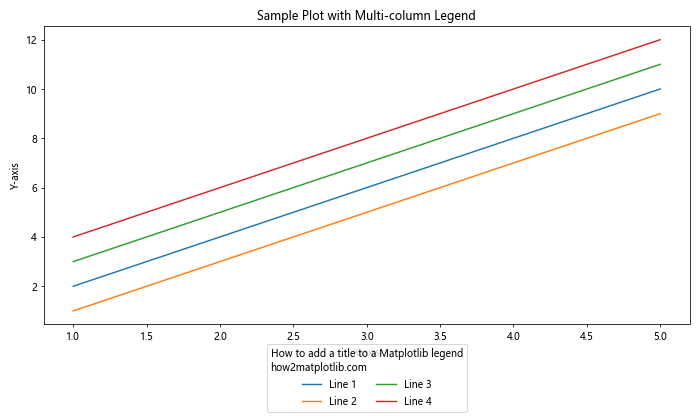
This example demonstrates how to add a title to a Matplotlib legend that has multiple columns. The ncol parameter is used to specify the number of columns in the legend.
Adding a Title to a Legend in a 3D Plot
When working with 3D plots in Matplotlib, you can still add titles to legends. Here’s an example of how to add a title to a Matplotlib legend in a 3D plot:
import matplotlib.pyplot as plt
import numpy as np
from mpl_toolkits.mplot3d import Axes3D

# Create some sample data
x = np.linspace(-5, 5, 100)
y = np.linspace(-5, 5, 100)
X, Y = np.meshgrid(x, y)
Z1 = np.sin(np.sqrt(X**2 + Y**2))
Z2 = np.cos(np.sqrt(X**2 + Y**2))

# Create the 3D plot
fig = plt.figure(figsize=(10, 8))
ax = fig.add_subplot(111, projection='3d')

# Plot the surfaces
surf1 = ax.plot_surface(X, Y, Z1, cmap='viridis', alpha=0.7, label='Surface 1')
surf2 = ax.plot_surface(X, Y, Z2, cmap='plasma', alpha=0.7, label='Surface 2')

# Add a legend with a title
legend = ax.legend(title='How to add a title to a Matplotlib legend\n3D Plot - how2matplotlib.com')

ax.set_xlabel('X-axis')
ax.set_ylabel('Y-axis')
ax.set_zlabel('Z-axis')
ax.set_title('3D Plot with Legend Title')
plt.show()
Output:
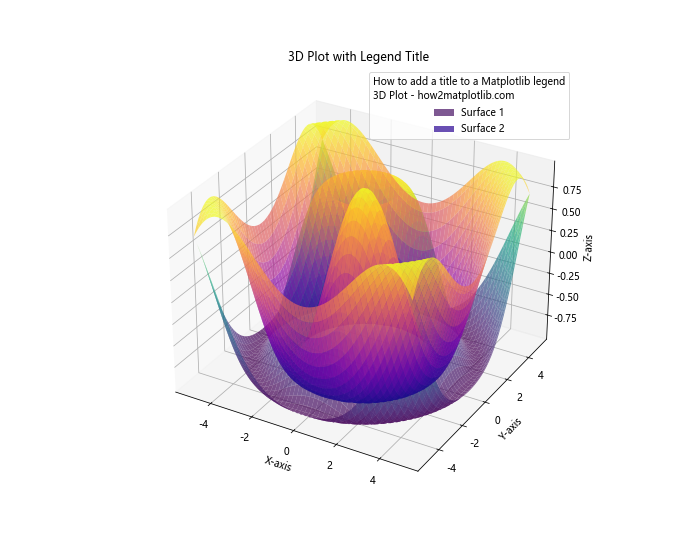
This example shows how to add a title to a Matplotlib legend in a 3D plot. The process is similar to 2D plots, but you need to work with the 3D Axes object.
Using HTML-like Tags in Legend Titles
Matplotlib supports some HTML-like tags in text elements, including legend titles. This feature can be useful when you want to add formatting to your legend title. Here’s an example of how to add a title to a Matplotlib legend using HTML-like tags:
import matplotlib.pyplot as plt

# Create some sample data
x = [1, 2, 3, 4, 5]
y1 = [2, 4, 6, 8, 10]
y2 = [1, 3, 5, 7, 9]

# Create the plot
fig, ax = plt.subplots(figsize=(8, 6))
ax.plot(x, y1, label='Line 1')
ax.plot(x, y2, label='Line 2')

# Add a legend with a title using HTML-like tags
legend = ax.legend(title='How to add a title to a Matplotlib legend\n'
                         'how2matplotlib.com')

# Enable the use of HTML-like tags
plt.rcParams['legend.title_fontsize'] = 'large'
legend.get_title().set_fontsize('large')
plt.setp(legend.get_title(), multialignment='center')

ax.set_xlabel('X-axis')
ax.set_ylabel('Y-axis')
ax.set_title('Sample Plot with Formatted Legend Title')plt.show()
Output:
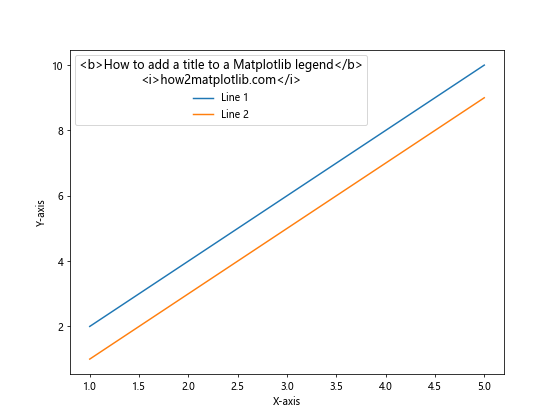
In this example, we use HTML-like tags for bold and for italic text in the legend title. This demonstrates how to add a title to a Matplotlib legend with additional formatting options.
Adding a Title to a Legend with Custom Markers
When working with plots that use custom markers, you might want to include these markers in your legend. Here’s an example of how to add a title to a Matplotlib legend that includes custom markers:
import matplotlib.pyplot as plt

# Create some sample data
x = [1, 2, 3, 4, 5]
y1 = [2, 4, 6, 8, 10]
y2 = [1, 3, 5, 7, 9]

# Create the plot
fig, ax = plt.subplots(figsize=(8, 6))
ax.plot(x, y1, 'ro-', label='Red Circles')
ax.plot(x, y2, 'bs--', label='Blue Squares')

# Add a scatter plot with custom markers
ax.scatter([2, 4], [5, 8], marker='^', s=100, c='green', label='Green Triangles')

# Add a legend with a title
legend = ax.legend(title='How to add a title to a Matplotlib legend\nCustom Markers - how2matplotlib.com')

ax.set_xlabel('X-axis')
ax.set_ylabel('Y-axis')
ax.set_title('Sample Plot with Custom Markers and Legend Title')
plt.show()
Output:
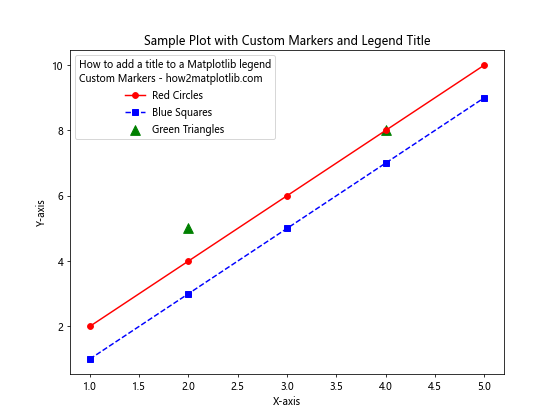
This example demonstrates how to add a title to a Matplotlib legend that includes custom markers. The legend automatically includes the markers used in the plot, making it easy for viewers to identify different data series.
Adding a Title to a Legend in a Pie Chart
Pie charts are another type of plot where you might want to add a title to the legend. Here’s an example of how to add a title to a Matplotlib legend in a pie chart:
import matplotlib.pyplot as plt

# Create some sample data
sizes = [30, 20, 25, 15, 10]
labels = ['A', 'B', 'C', 'D', 'E']
colors = ['red', 'green', 'blue', 'yellow', 'orange']

# Create the pie chart
fig, ax = plt.subplots(figsize=(8, 8))
ax.pie(sizes, labels=labels, colors=colors, autopct='%1.1f%%', startangle=90)

# Add a legend with a title
legend = ax.legend(title='How to add a title to a Matplotlib legend\nPie Chart - how2matplotlib.com',
                   loc='center left', bbox_to_anchor=(1, 0.5))

ax.set_title('Sample Pie Chart with Legend Title')
plt.axis('equal')  # Equal aspect ratio ensures that pie is drawn as a circle
plt.tight_layout()
plt.show()
Output:
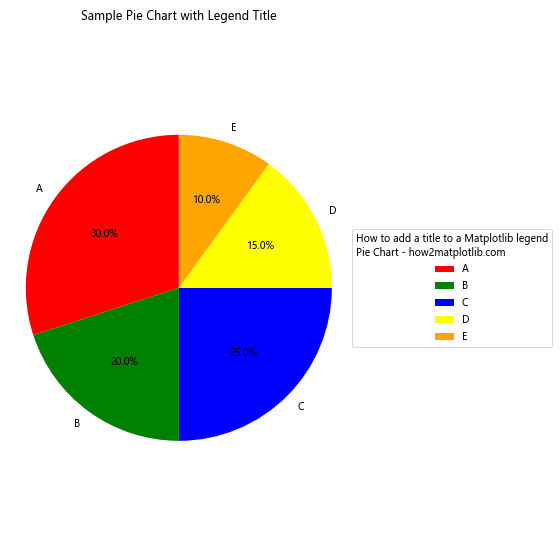
This example shows how to add a title to a Matplotlib legend in a pie chart. The legend is positioned outside the pie chart for better visibility.
Adding a Title to a Legend with Color Bars
When working with plots that use color mappings, you might want to include a color bar in your legend. Here’s an example of how to add a title to a Matplotlib legend that includes a color bar:
import matplotlib.pyplot as plt
import numpy as np

# Create some sample data
x = np.linspace(0, 10, 100)
y = np.linspace(0, 10, 100)
X, Y = np.meshgrid(x, y)
Z = np.sin(X) * np.cos(Y)

# Create the plot
fig, ax = plt.subplots(figsize=(10, 8))
im = ax.imshow(Z, cmap='viridis', extent=[0, 10, 0, 10])

# Add a color bar
cbar = fig.colorbar(im, ax=ax)
cbar.set_label('Z values')

# Add some line plots
ax.plot([2, 8], [3, 7], 'r-', label='Line 1')
ax.plot([3, 7], [8, 2], 'b--', label='Line 2')

# Add a legend with a title
legend = ax.legend(title='How to add a title to a Matplotlib legend\nwith Color Bar - how2matplotlib.com',
                   loc='upper right')

ax.set_xlabel('X-axis')
ax.set_ylabel('Y-axis')
ax.set_title('Sample Plot with Color Bar and Legend Title')
plt.show()
Output:
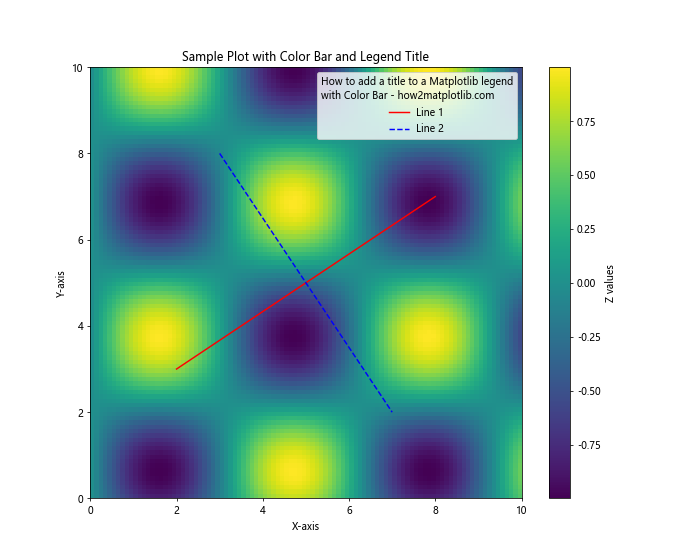
This example demonstrates how to add a title to a Matplotlib legend in a plot that includes both a color bar and regular line plots. The legend title helps to explain the context of the legend entries.
Adding a Title to a Legend with Multiple Plots
When creating a figure with multiple plots, you might want to add a title to a shared legend. Here’s an example of how to add a title to a Matplotlib legend that covers multiple plots:
import matplotlib.pyplot as plt

# Create some sample data
x = [1, 2, 3, 4, 5]
y1 = [2, 4, 6, 8, 10]
y2 = [1, 3, 5, 7, 9]
y3 = [5, 4, 3, 2, 1]
y4 = [3, 6, 9, 12, 15]

# Create a figure with four subplots
fig, ((ax1, ax2), (ax3, ax4)) = plt.subplots(2, 2, figsize=(12, 10))

# Plot data on each subplot
ax1.plot(x, y1, 'r-', label='Line 1')
ax2.plot(x, y2, 'b--', label='Line 2')
ax3.plot(x, y3, 'g-.', label='Line 3')
ax4.plot(x, y4, 'm:', label='Line 4')

# Set titles for each subplot
ax1.set_title('Subplot 1')
ax2.set_title('Subplot 2')
ax3.set_title('Subplot 3')
ax4.set_title('Subplot 4')

# Add a shared legend with a title
handles, labels = [], []
for ax in [ax1, ax2, ax3, ax4]:
    for h, l in zip(*ax.get_legend_handles_labels()):
        handles.append(h)
        labels.append(l)

fig.legend(handles, labels, title='How to add a title to a Matplotlib legend\nMultiple Plots - how2matplotlib.com',
           loc='center right', bbox_to_anchor=(0.98, 0.5))

plt.tight_layout()
plt.subplots_adjust(right=0.85)
plt.show()
Output:
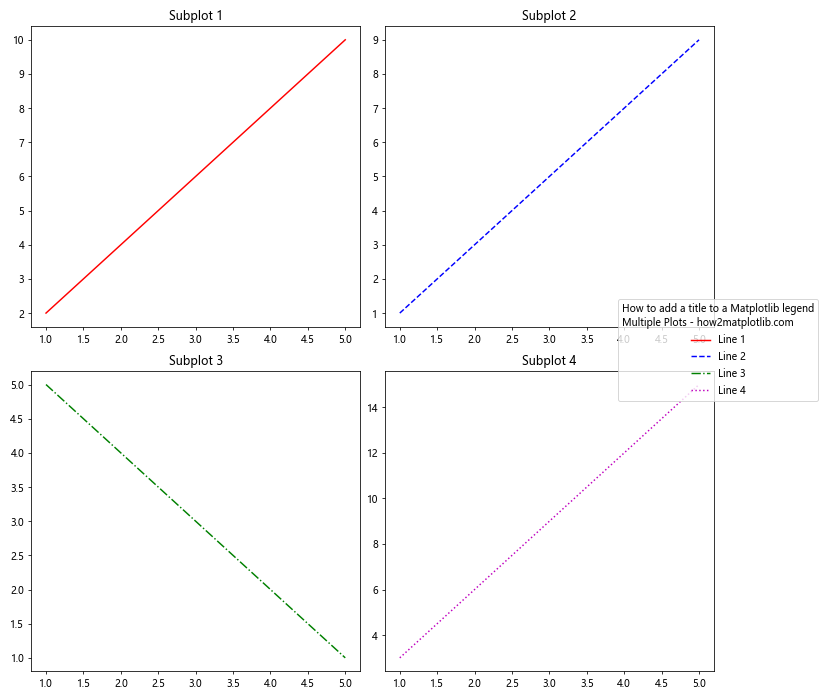
This example shows how to add a title to a Matplotlib legend that is shared among multiple subplots. The legend is placed to the right of all subplots and includes entries from each subplot.
Conclusion
Learning how to add a title to a Matplotlib legend is an essential skill for creating informative and professional-looking visualizations. Throughout this article, we’ve explored various methods and techniques for adding titles to legends in different plot types and configurations.
We’ve covered:
- Basic methods for adding legend titles
- Customizing legend title appearance
- Positioning legends and their titles
- Working with legends in subplots and 3D plots
- Using HTML-like tags for formatting
- Adding titles to legends with custom markers and color bars
- Creating shared legends for multiple plots
By mastering these techniques, you’ll be able to create more informative and visually appealing plots that effectively communicate your data. Remember that the key to success is practice and experimentation. Don’t hesitate to try different approaches and customize your legend titles to best suit your specific visualization needs.