How to Add Axes to a Figure in Matplotlib
How to Add Axes to a Figure in Matplotlib is a fundamental skill for creating customized and complex visualizations using the popular Python plotting library. This article will provide an in-depth exploration of various techniques and methods to add axes to a figure in Matplotlib, covering everything from basic concepts to advanced customization options.
Understanding Figures and Axes in Matplotlib
Before diving into how to add axes to a figure in Matplotlib, it’s essential to understand the relationship between figures and axes. In Matplotlib, a figure is the top-level container that holds all the plot elements, while axes are the actual plotting areas within the figure.
When you create a plot using Matplotlib, you’re essentially adding axes to a figure. The default behavior of many Matplotlib functions is to create a new figure and add a single set of axes to it. However, for more complex visualizations or when you need greater control over your plots, knowing how to add axes to a figure in Matplotlib becomes crucial.
Let’s start with a basic example of how to add axes to a figure in Matplotlib:
import matplotlib.pyplot as plt

# Create a new figure
fig = plt.figure()

# Add axes to the figure
ax = fig.add_subplot(111)

# Plot some data
x = [1, 2, 3, 4, 5]
y = [2, 4, 6, 8, 10]
ax.plot(x, y, label='how2matplotlib.com')

# Add labels and title
ax.set_xlabel('X-axis')
ax.set_ylabel('Y-axis')
ax.set_title('How to Add Axes to a Figure in Matplotlib')

# Add legend
ax.legend()

# Display the plot
plt.show()
Output:
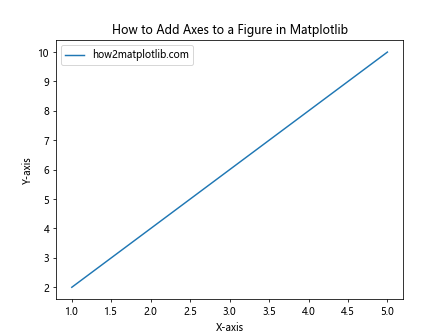
In this example, we first create a figure using plt.figure(). Then, we add axes to the figure using the add_subplot() method. The 111 argument specifies that we want a single subplot in a 1×1 grid. After adding the axes, we can use various methods to plot data, set labels, and customize the appearance of the plot.
Adding Multiple Axes to a Figure
One of the key advantages of knowing how to add axes to a figure in Matplotlib is the ability to create multiple subplots within a single figure. This is particularly useful when you want to compare different datasets or show related information side by side.
Here’s an example of how to add multiple axes to a figure in Matplotlib:
import matplotlib.pyplot as plt
import numpy as np

# Create a new figure
fig = plt.figure(figsize=(10, 5))

# Add multiple axes to the figure
ax1 = fig.add_subplot(121)
ax2 = fig.add_subplot(122)

# Generate some data
x = np.linspace(0, 10, 100)
y1 = np.sin(x)
y2 = np.cos(x)

# Plot data on the first axes
ax1.plot(x, y1, label='Sine - how2matplotlib.com')
ax1.set_title('Sine Wave')
ax1.set_xlabel('X-axis')
ax1.set_ylabel('Y-axis')
ax1.legend()

# Plot data on the second axes
ax2.plot(x, y2, label='Cosine - how2matplotlib.com')
ax2.set_title('Cosine Wave')
ax2.set_xlabel('X-axis')
ax2.set_ylabel('Y-axis')
ax2.legend()

# Adjust the layout and display the plot
plt.tight_layout()
plt.show()
Output:
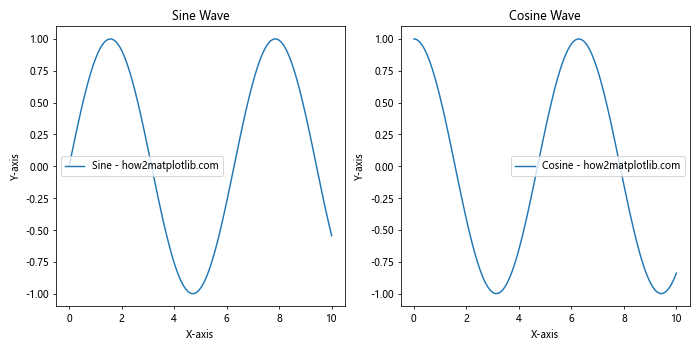
In this example, we create a figure with two subplots side by side. The add_subplot() method is called twice, with arguments 121 and 122, indicating that we want two subplots in a 1×2 grid. We then plot different data on each set of axes, demonstrating how to add axes to a figure in Matplotlib for creating multiple subplots.
Using GridSpec for Complex Layouts
For more complex layouts when adding axes to a figure in Matplotlib, you can use the GridSpec class. This allows for greater flexibility in arranging subplots and creating custom layouts.
Here’s an example of how to use GridSpec to add axes to a figure in Matplotlib:
import matplotlib.pyplot as plt
import matplotlib.gridspec as gridspec
import numpy as np

# Create a new figure
fig = plt.figure(figsize=(12, 8))

# Create a GridSpec object
gs = gridspec.GridSpec(3, 3)

# Add axes to the figure using GridSpec
ax1 = fig.add_subplot(gs[0, :])
ax2 = fig.add_subplot(gs[1, :-1])
ax3 = fig.add_subplot(gs[1:, -1])
ax4 = fig.add_subplot(gs[-1, 0])
ax5 = fig.add_subplot(gs[-1, -2])

# Generate some data
x = np.linspace(0, 10, 100)
y1 = np.sin(x)
y2 = np.cos(x)
y3 = np.tan(x)
y4 = x**2
y5 = np.sqrt(x)

# Plot data on each axes
ax1.plot(x, y1, label='Sine - how2matplotlib.com')
ax2.plot(x, y2, label='Cosine - how2matplotlib.com')
ax3.plot(x, y3, label='Tangent - how2matplotlib.com')
ax4.plot(x, y4, label='Square - how2matplotlib.com')
ax5.plot(x, y5, label='Square Root - how2matplotlib.com')

# Set titles for each subplot
ax1.set_title('How to Add Axes to a Figure in Matplotlib: Sine')
ax2.set_title('How to Add Axes to a Figure in Matplotlib: Cosine')
ax3.set_title('How to Add Axes to a Figure in Matplotlib: Tangent')
ax4.set_title('How to Add Axes to a Figure in Matplotlib: Square')
ax5.set_title('How to Add Axes to a Figure in Matplotlib: Square Root')

# Add legends to each subplot
for ax in [ax1, ax2, ax3, ax4, ax5]:
    ax.legend()

# Adjust the layout and display the plot
plt.tight_layout()
plt.show()
Output:
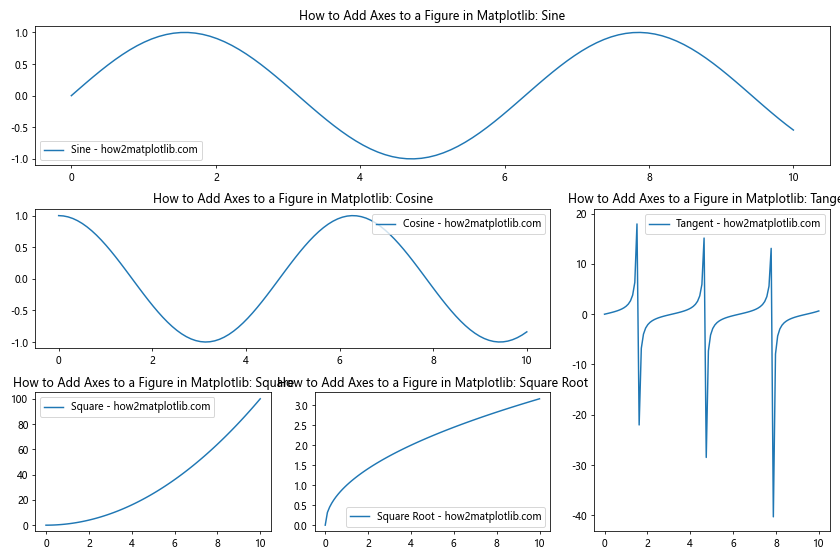
In this example, we use GridSpec to create a complex layout with five subplots of different sizes. The gs[row, col] syntax allows us to specify the position and span of each subplot within the grid. This demonstrates the flexibility of how to add axes to a figure in Matplotlib using GridSpec.
Adding Inset Axes
Another useful technique when learning how to add axes to a figure in Matplotlib is creating inset axes. Inset axes are smaller axes placed within the main axes, often used to show a zoomed-in view of a particular region of interest.
Here’s an example of how to add inset axes to a figure in Matplotlib:
import matplotlib.pyplot as plt
from mpl_toolkits.axes_grid1.inset_locator import inset_axes
import numpy as np

# Create a new figure and add main axes
fig, ax = plt.subplots(figsize=(10, 6))

# Generate some data
x = np.linspace(0, 10, 1000)
y = np.sin(x) * np.exp(-0.1 * x)

# Plot data on the main axes
ax.plot(x, y, label='Main plot - how2matplotlib.com')
ax.set_title('How to Add Axes to a Figure in Matplotlib: Inset Axes')
ax.set_xlabel('X-axis')
ax.set_ylabel('Y-axis')
ax.legend()

# Add inset axes
axins = inset_axes(ax, width="40%", height="30%", loc='lower left',
                   bbox_to_anchor=(0.5, 0.1, 0.5, 0.5),
                   bbox_transform=ax.transAxes)

# Plot data on the inset axes
axins.plot(x, y, color='red')
axins.set_xlim(2, 3)
axins.set_ylim(0.3, 0.7)
axins.set_title('Zoomed view')

# Add a rectangle patch to show the zoomed region on the main plot
ax.indicate_inset_zoom(axins, edgecolor="black")

plt.show()
Output:
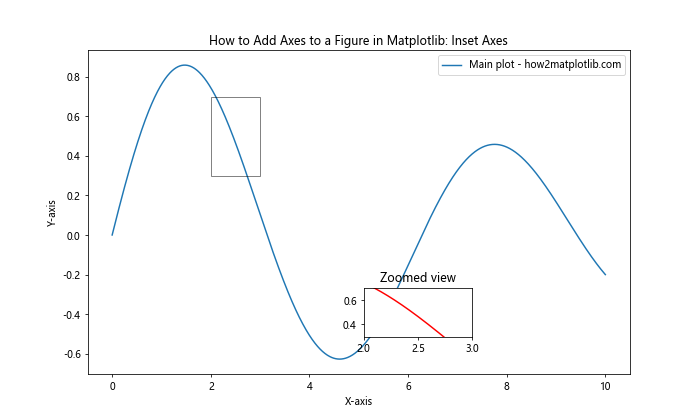
In this example, we use the inset_axes() function from mpl_toolkits.axes_grid1.inset_locator to create an inset axes within the main plot. The inset axes show a zoomed-in view of a specific region of the main plot. This technique is particularly useful when you want to highlight a specific feature of your data while still showing the overall context.
Customizing Axes Positions and Sizes
When learning how to add axes to a figure in Matplotlib, it’s important to understand how to customize the position and size of the axes. This can be achieved using the add_axes() method, which allows you to specify the exact position and dimensions of the axes within the figure.
Here’s an example demonstrating how to add custom-positioned axes to a figure in Matplotlib:
import matplotlib.pyplot as plt
import numpy as np

# Create a new figure
fig = plt.figure(figsize=(10, 8))

# Add custom-positioned axes
ax1 = fig.add_axes([0.1, 0.1, 0.8, 0.8])  # [left, bottom, width, height]
ax2 = fig.add_axes([0.2, 0.6, 0.3, 0.2])

# Generate some data
x = np.linspace(0, 10, 100)
y1 = np.sin(x)
y2 = np.cos(x)

# Plot data on the main axes
ax1.plot(x, y1, label='Sine - how2matplotlib.com')
ax1.set_title('How to Add Axes to a Figure in Matplotlib: Main Plot')
ax1.set_xlabel('X-axis')
ax1.set_ylabel('Y-axis')
ax1.legend()

# Plot data on the smaller axes
ax2.plot(x, y2, color='red', label='Cosine - how2matplotlib.com')
ax2.set_title('Smaller Plot')
ax2.legend()

plt.show()
Output:
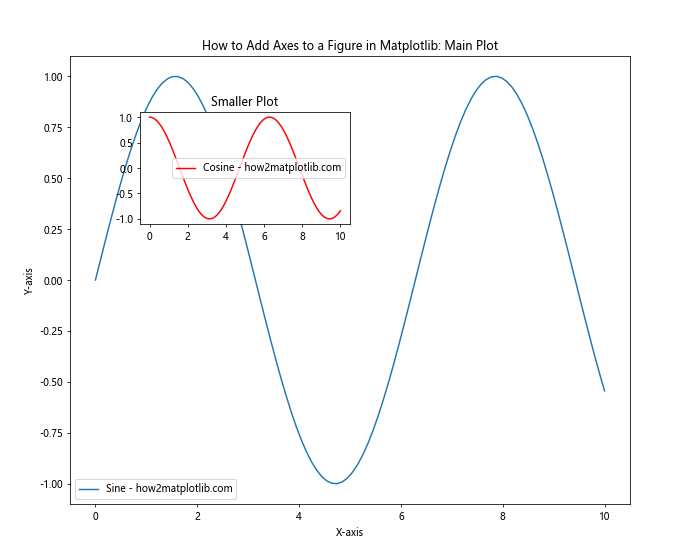
In this example, we use fig.add_axes() to create two sets of axes with custom positions and sizes. The arguments [left, bottom, width, height] specify the position and dimensions of the axes as fractions of the figure size. This method gives you precise control over how to add axes to a figure in Matplotlib and where to place them.
Creating Polar Axes
Matplotlib also allows you to create polar axes, which are useful for plotting data in polar coordinates. Here’s an example of how to add polar axes to a figure in Matplotlib:
import matplotlib.pyplot as plt
import numpy as np

# Create a new figure
fig = plt.figure(figsize=(10, 5))

# Add regular axes and polar axes
ax1 = fig.add_subplot(121)
ax2 = fig.add_subplot(122, projection='polar')

# Generate some data
theta = np.linspace(0, 2*np.pi, 100)
r = np.sin(4*theta)

# Plot data on regular axes
ax1.plot(theta, r, label='how2matplotlib.com')
ax1.set_title('How to Add Axes to a Figure in Matplotlib: Regular Plot')
ax1.set_xlabel('Theta')
ax1.set_ylabel('R')
ax1.legend()

# Plot data on polar axes
ax2.plot(theta, r)
ax2.set_title('How to Add Axes to a Figure in Matplotlib: Polar Plot')

plt.tight_layout()
plt.show()
Output:
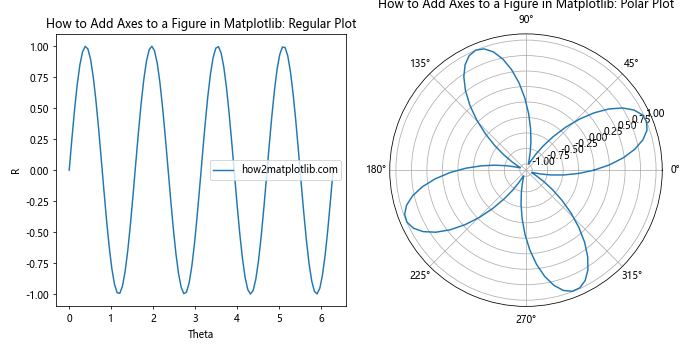
In this example, we create two subplots: one with regular Cartesian axes and another with polar axes. The polar axes are created by passing the projection='polar' argument to add_subplot(). This demonstrates how to add axes to a figure in Matplotlib with different coordinate systems.
Adding Axes with Shared X or Y Axes
When creating multiple subplots, it’s often useful to have shared x or y axes. Matplotlib provides convenient methods for adding axes with shared axes. Here’s an example of how to add axes to a figure in Matplotlib with shared axes:
import matplotlib.pyplot as plt
import numpy as np

# Create a new figure
fig, (ax1, ax2, ax3) = plt.subplots(3, 1, figsize=(10, 8), sharex=True)

# Generate some data
x = np.linspace(0, 10, 100)
y1 = np.sin(x)
y2 = np.cos(x)
y3 = np.tan(x)

# Plot data on each axes
ax1.plot(x, y1, label='Sine - how2matplotlib.com')
ax2.plot(x, y2, label='Cosine - how2matplotlib.com')
ax3.plot(x, y3, label='Tangent - how2matplotlib.com')

# Set titles and labels
fig.suptitle('How to Add Axes to a Figure in Matplotlib: Shared X-axis')
ax1.set_title('Sine Wave')
ax2.set_title('Cosine Wave')
ax3.set_title('Tangent Wave')

ax3.set_xlabel('X-axis')
ax1.set_ylabel('Y-axis')
ax2.set_ylabel('Y-axis')
ax3.set_ylabel('Y-axis')

# Add legends
ax1.legend()
ax2.legend()
ax3.legend()

plt.tight_layout()
plt.show()
Output:
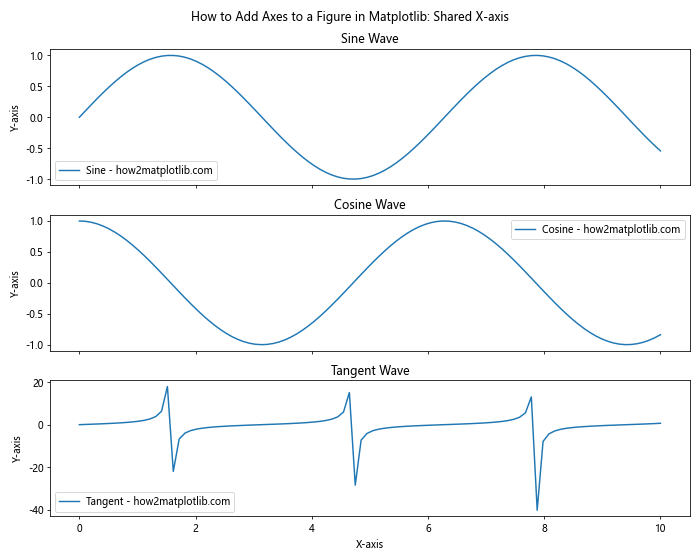
In this example, we create three subplots with a shared x-axis using the sharex=True argument in plt.subplots(). This ensures that all three subplots have the same x-axis limits and ticks, making it easier to compare the data across different plots.
Adding Colorbar Axes
When working with 2D plots or images, it’s often necessary to add a colorbar to show the mapping between colors and values. Here’s an example of how to add axes to a figure in Matplotlib for a colorbar:
import matplotlib.pyplot as plt
import numpy as np

# Create a new figure
fig, ax = plt.subplots(figsize=(10, 8))

# Generate some 2D data
x = np.linspace(-5, 5, 100)
y = np.linspace(-5, 5, 100)
X, Y = np.meshgrid(x, y)
Z = np.sin(np.sqrt(X**2 + Y**2))

# Create a contour plot
im = ax.contourf(X, Y, Z, cmap='viridis')

# Add a colorbar
cbar_ax = fig.add_axes([0.92, 0.15, 0.02, 0.7])  # [left, bottom, width, height]
cbar = fig.colorbar(im, cax=cbar_ax)

# Set titles and labels
ax.set_title('How to Add Axes to a Figure in Matplotlib: Contour Plot with Colorbar')
ax.set_xlabel('X-axis')
ax.set_ylabel('Y-axis')
cbar.set_label('Value')

# Add a text annotation
ax.text(0, 5.5, 'how2matplotlib.com', fontsize=12, ha='center')

plt.show()
Output:
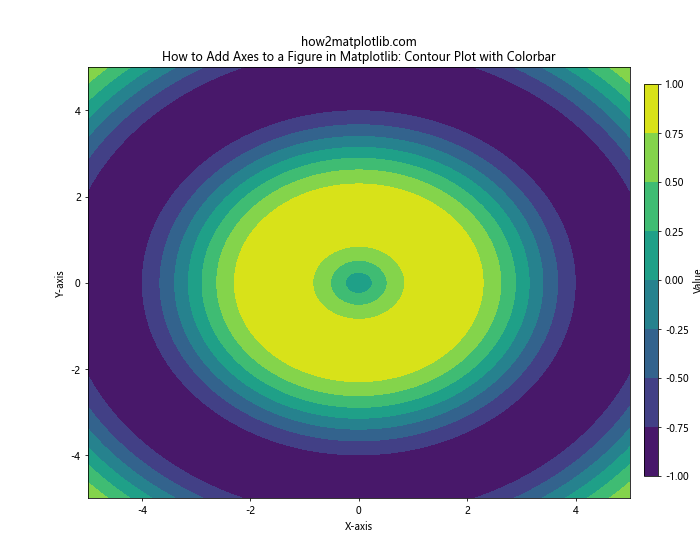
In this example, we create a contour plot and add a colorbar using fig.add_axes() to create a new axes object for the colorbar. The fig.colorbar() function is then used to add the colorbar to these axes. This demonstrates how to add axes to a figure in Matplotlib for additional plot elements like colorbars.
Creating Axes with Different Scales
Matplotlib allows you to create axes with different scales, such as logarithmic or symlog scales. Here’s an example of how to add axes to a figure in Matplotlib with different scales:
import matplotlib.pyplot as plt
import numpy as np

# Create a new figure
fig, (ax1, ax2, ax3) = plt.subplots(1, 3, figsize=(15, 5))

# Generate some data
x = np.linspace(0.1, 100, 1000)
y = x**2

# Plot data on linear scale
ax1.plot(x, y, label='how2matplotlib.com')
ax1.set_title('How to Add Axes to a Figure in Matplotlib: Linear Scale')
ax1.set_xlabel('X-axis')
ax1.set_ylabel('Y-axis')
ax1.legend()

# Plot data on log-log scale
ax2.loglog(x, y, label='how2matplotlib.com')
ax2.set_title('How to Add Axes to a Figure in Matplotlib: Log-Log Scale')
ax2.set_xlabel('X-axis')
ax2.set_ylabel('Y-axis')
ax2.legend()

# Plot data on symlog scale
ax3.plot(x, y, label='how2matplotlib.com')
ax3.set_yscale('symlog')
ax3.set_title('How to Add Axes to a Figure in Matplotlib: Symlog Scale')
ax3.set_xlabel('X-axis')
ax3.set_ylabel('Y-axis')
ax3.legend()

plt.tight_layout()
plt.show()
Output:
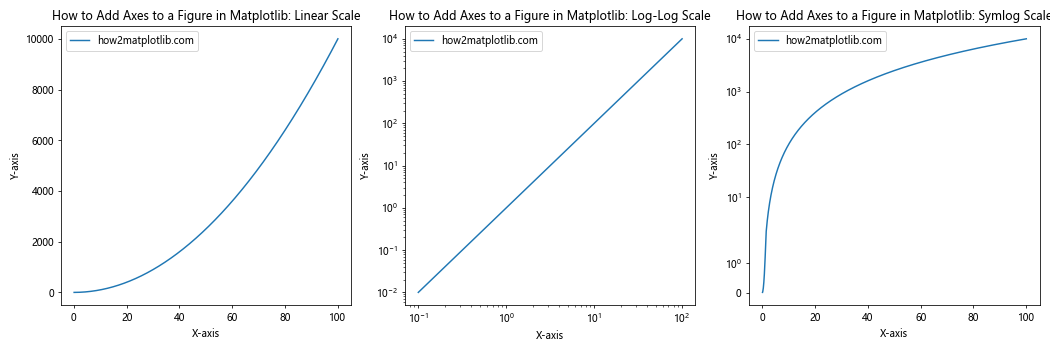
In this example, we create three subplots with different scales: linear, log-log, and symlog. This demonstrates how to add axes to a figure in Matplotlib with various scale options, which can be useful for visualizing data with different ranges or distributions.
Adding Twin Axes
Sometimes, you may want to plot two different datasets with different scales on the same axes. Matplotlib allows you to add twin axes, which share the same x-axis but have a different y-axis. Here’s an example of how to add twin axes to a figure in Matplotlib:
import matplotlib.pyplot as plt
import numpy as np

# Create a new figure and add main axes
fig, ax1 = plt.subplots(figsize=(10, 6))

# Generate some data
x = np.linspace(0, 10, 100)
y1 = np.sin(x)
y2 = np.exp(x)

# Plot data on the main axes
ax1.plot(x, y1, color='blue', label='Sine - how2matplotlib.com')
ax1.set_xlabel('X-axis')
ax1.set_ylabel('Sine', color='blue')
ax1.tick_params(axis='y', labelcolor='blue')

# Create twin axes
ax2 = ax1.twinx()

# Plot data on the twin axes
ax2.plot(x, y2, color='red', label='Exponential - how2matplotlib.com')
ax2.set_ylabel('Exponential', color='red')
ax2.tick_params(axis='y', labelcolor='red')

# Set title and add legend
plt.title('How to Add Axes to a Figure in Matplotlib: Twin Axes')
fig.legend(loc='upper left', bbox_to_anchor=(0.1, 0.9))

plt.tight_layout()
plt.show()
Output:
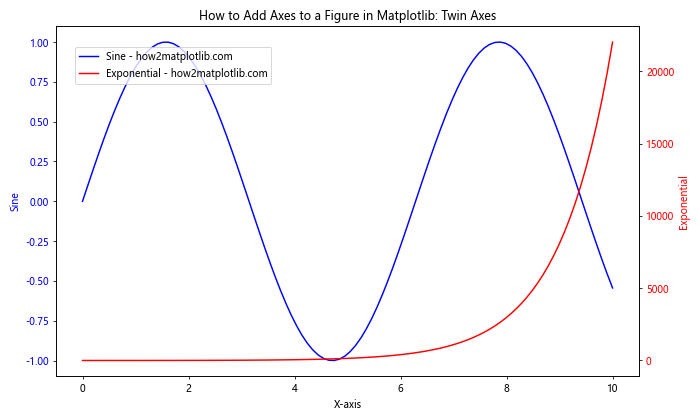
In this example, we create a main set of axes and then add twin axes using the twinx() method. This allows us to plot two different datasets with different scales on the same plot, demonstrating another way to add axes to a figure in Matplotlib.
Creating 3D Axes
Matplotlib also supports 3D plotting through the mplot3d toolkit. Here’s an example of how to add 3D axes to a figure in Matplotlib:
import matplotlib.pyplot as plt
from mpl_toolkits.mplot3d import Axes3D
import numpy as np

# Create a new figure
fig = plt.figure(figsize=(10, 8))

# Add 3D axes to the figure
ax = fig.add_subplot(111, projection='3d')

# Generate some 3D data
x = np.linspace(-5, 5, 100)
y = np.linspace(-5, 5, 100)
X, Y = np.meshgrid(x, y)
Z = np.sin(np.sqrt(X**2 + Y**2))

# Create a surface plot
surf = ax.plot_surface(X, Y, Z, cmap='viridis')

# Set labels and title
ax.set_xlabel('X-axis')
ax.set_ylabel('Y-axis')
ax.set_zlabel('Z-axis')
ax.set_title('How to Add Axes to a Figure in Matplotlib: 3D Plot')

# Add a colorbar
fig.colorbar(surf, shrink=0.5, aspect=5)

# Add a text annotation
ax.text2D(0.05, 0.95, 'how2matplotlib.com', transform=ax.transAxes)

plt.show()
Output:
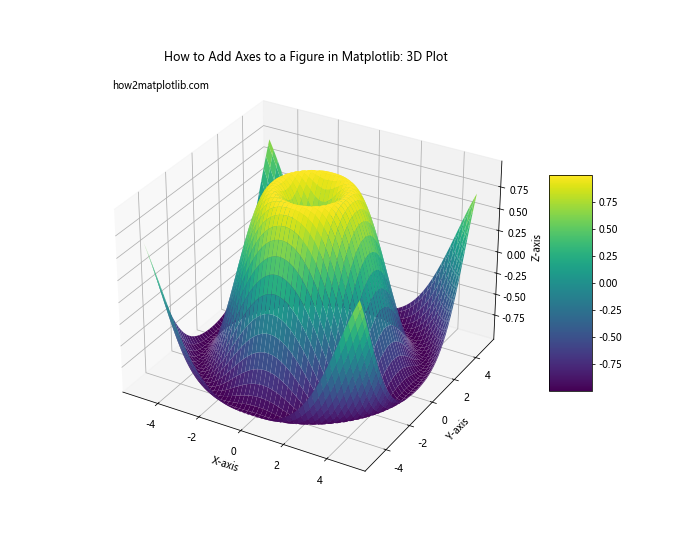
In this example, we create 3D axes using the projection='3d' argument when adding a subplot. This allows us to create 3D visualizations, demonstrating yet another way to add axes to a figure in Matplotlib.
Adding Axes with Custom Aspect Ratios
When adding axes to a figure in Matplotlib, you can also control the aspect ratio of the plot. This is particularly useful when you want to preserve the scale of your data or create plots with specific proportions. Here’s an example:
import matplotlib.pyplot as plt
import numpy as np

# Create a new figure
fig = plt.figure(figsize=(12, 4))

# Add axes with different aspect ratios
ax1 = fig.add_subplot(131, aspect='equal')
ax2 = fig.add_subplot(132, aspect=2)
ax3 = fig.add_subplot(133, aspect='auto')

# Generate some data
x = np.linspace(0, 10, 100)
y = np.sin(x)

# Plot data on each axes
ax1.plot(x, y, label='Equal - how2matplotlib.com')
ax2.plot(x, y, label='Aspect 2 - how2matplotlib.com')
ax3.plot(x, y, label='Auto - how2matplotlib.com')

# Set titles and labels
fig.suptitle('How to Add Axes to a Figure in Matplotlib: Custom Aspect Ratios')
ax1.set_title('Equal Aspect')
ax2.set_title('Aspect Ratio 2')
ax3.set_title('Auto Aspect')

for ax in [ax1, ax2, ax3]:
    ax.set_xlabel('X-axis')
    ax.set_ylabel('Y-axis')
    ax.legend()

plt.tight_layout()
plt.show()
Output:
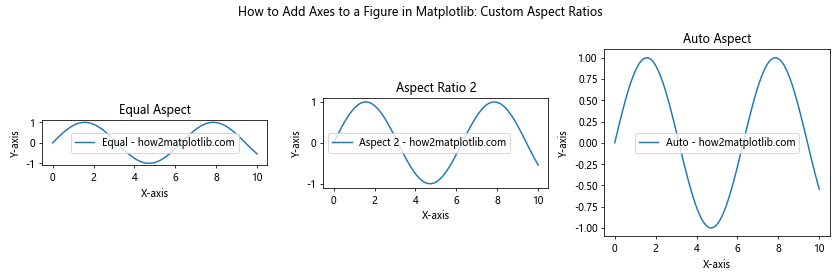
In this example, we create three subplots with different aspect ratios. The aspect parameter in add_subplot() allows us to control the aspect ratio of each plot. This demonstrates how to add axes to a figure in Matplotlib with custom aspect ratios, which can be useful for creating visually appealing and accurate representations of your data.
Creating Axes with Specific Projections
Matplotlib supports various map projections through the cartopy library. While a full exploration of cartopy is beyond the scope of this article, here’s a simple example of how to add axes to a figure in Matplotlib with a specific map projection:
import matplotlib.pyplot as plt
import cartopy.crs as ccrs

# Create a new figure
fig = plt.figure(figsize=(12, 8))

# Add axes with different projections
ax1 = fig.add_subplot(221, projection=ccrs.PlateCarree())
ax2 = fig.add_subplot(222, projection=ccrs.Mercator())
ax3 = fig.add_subplot(223, projection=ccrs.Orthographic())
ax4 = fig.add_subplot(224, projection=ccrs.Robinson())

# Add coastlines to each map
for ax in [ax1, ax2, ax3, ax4]:
    ax.coastlines()

# Set titles
ax1.set_title('PlateCarree Projection')
ax2.set_title('Mercator Projection')
ax3.set_title('Orthographic Projection')
ax4.set_title('Robinson Projection')

# Add a main title
fig.suptitle('How to Add Axes to a Figure in Matplotlib: Map Projections')

# Add a text annotation
fig.text(0.5, 0.02, 'how2matplotlib.com', ha='center')

plt.tight_layout()
plt.show()
Output:
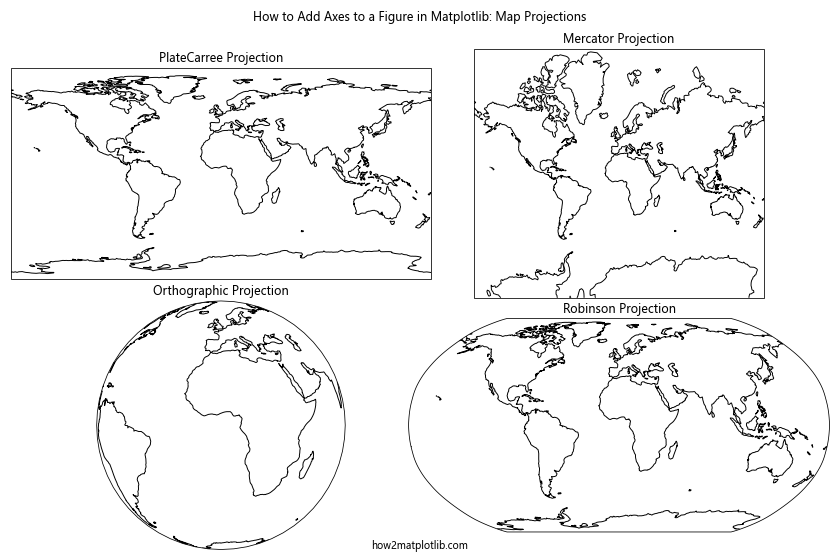
This example demonstrates how to add axes to a figure in Matplotlib with different map projections using the cartopy library. Each subplot uses a different projection, showing the flexibility of Matplotlib in creating various types of visualizations.
Conclusion
Learning how to add axes to a figure in Matplotlib is a crucial skill for creating complex and informative visualizations. This comprehensive guide has covered various aspects of adding axes, from basic subplots to advanced techniques like inset axes, custom layouts, and different projections.
By mastering these techniques, you’ll be able to create more sophisticated and tailored visualizations that effectively communicate your data. Remember that the key to becoming proficient in how to add axes to a figure in Matplotlib is practice and experimentation. Try combining different methods and exploring the vast array of customization options available in Matplotlib to create unique and impactful visualizations.