How to Adjust the Position of a Matplotlib Colorbar
How to Adjust the Position of a Matplotlib Colorbar is an essential skill for data visualization enthusiasts and professionals alike. Matplotlib, a powerful plotting library in Python, offers various ways to customize colorbars, including their position, size, and orientation. In this extensive guide, we’ll explore different techniques and best practices for adjusting the position of a Matplotlib colorbar, providing you with the knowledge and tools to create visually appealing and informative plots.
Understanding the Basics of Matplotlib Colorbars
Before diving into the specifics of how to adjust the position of a Matplotlib colorbar, it’s crucial to understand what colorbars are and why they’re important in data visualization. A colorbar is a visual representation of the mapping between color and data values in a plot. It helps viewers interpret the meaning of colors used in various types of plots, such as heatmaps, contour plots, and scatter plots with color-coded data points.
Matplotlib provides several ways to create and customize colorbars. The most common method is to use the colorbar() function, which can be called on a plot object or as a standalone function. Let’s start with a simple example to create a basic plot with a colorbar:
import matplotlib.pyplot as plt
import numpy as np

# Create sample data
data = np.random.rand(10, 10)

# Create a figure and axis
fig, ax = plt.subplots()

# Create a heatmap
im = ax.imshow(data, cmap='viridis')

# Add a colorbar
cbar = plt.colorbar(im)

# Set title
plt.title("How to Adjust the Position of a Matplotlib Colorbar - Basic Example")

# Show the plot
plt.show()
Output:
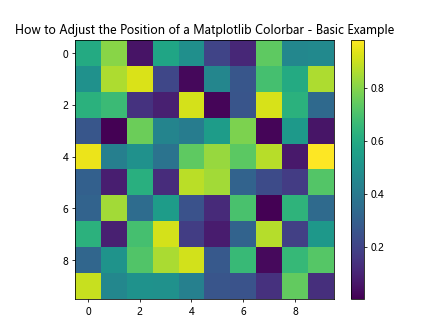
In this example, we create a simple heatmap using random data and add a colorbar to it. By default, Matplotlib places the colorbar to the right of the plot. However, you might want to adjust its position for various reasons, such as:
- Improving the overall layout of your figure
- Accommodating multiple subplots
- Enhancing the readability of your visualization
- Customizing the appearance to match specific design requirements
Now that we understand the basics, let’s explore different techniques for adjusting the position of a Matplotlib colorbar.
Using the location Parameter to Adjust Colorbar Position
One of the simplest ways to adjust the position of a Matplotlib colorbar is by using the location parameter in the colorbar() function. This parameter allows you to specify the general location of the colorbar relative to the plot.
Here’s an example demonstrating how to use the location parameter:
import matplotlib.pyplot as plt
import numpy as np

# Create sample data
data = np.random.rand(10, 10)

# Create a figure and axis
fig, ax = plt.subplots()

# Create a heatmap
im = ax.imshow(data, cmap='coolwarm')

# Add a colorbar with a specific location
cbar = plt.colorbar(im, location='bottom')

# Set title
plt.title("How to Adjust the Position of a Matplotlib Colorbar - Using location")

# Show the plot
plt.show()
Output:
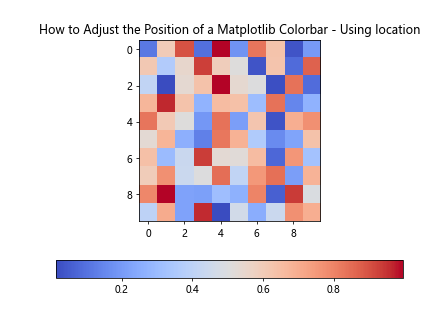
In this example, we set the location parameter to ‘bottom’, which places the colorbar below the plot. The location parameter accepts the following values:
- ‘left’: Places the colorbar to the left of the plot
- ‘right’: Places the colorbar to the right of the plot (default)
- ‘top’: Places the colorbar above the plot
- ‘bottom’: Places the colorbar below the plot
By using the location parameter, you can quickly adjust the general position of the colorbar without having to manually specify its exact coordinates.
Fine-tuning Colorbar Position with bbox_to_anchor and ax.add_axes()
While the location parameter provides a quick way to adjust the colorbar position, you might need more precise control over its placement. In such cases, you can use the bbox_to_anchor parameter in combination with ax.add_axes() to fine-tune the colorbar’s position.
Here’s an example that demonstrates how to use these techniques:
import matplotlib.pyplot as plt
import numpy as np
from mpl_toolkits.axes_grid1 import make_axes_locatable

# Create sample data
data = np.random.rand(10, 10)

# Create a figure and axis
fig, ax = plt.subplots()

# Create a heatmap
im = ax.imshow(data, cmap='plasma')

# Create a new axis for the colorbar
divider = make_axes_locatable(ax)
cax = divider.append_axes("right", size="5%", pad=0.1)

# Add a colorbar to the new axis
cbar = plt.colorbar(im, cax=cax)

# Set title
plt.title("How to Adjust the Position of a Matplotlib Colorbar - Fine-tuning")

# Show the plot
plt.show()
Output:
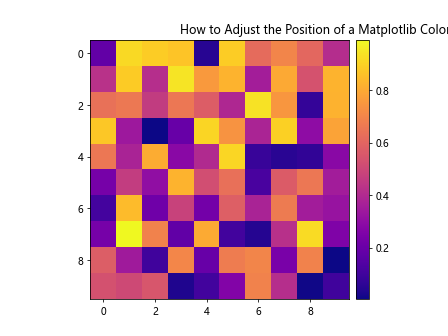
In this example, we use the make_axes_locatable() function from mpl_toolkits.axes_grid1 to create a new axis for the colorbar. This allows us to precisely control the size and position of the colorbar relative to the main plot.
The append_axes() method is used to add a new axis to the right of the main plot. We specify the size of the colorbar as “5%” of the main plot’s width and add a padding of 0.1 inches between the plot and the colorbar.
By adjusting the parameters in append_axes(), you can fine-tune the position and size of the colorbar to achieve the desired layout.
Adjusting Colorbar Position for Multiple Subplots
When working with multiple subplots, adjusting the position of colorbars becomes even more important to ensure a clean and organized layout. Let’s explore how to adjust colorbar positions in a figure with multiple subplots.
import matplotlib.pyplot as plt
import numpy as np

# Create sample data
data1 = np.random.rand(10, 10)
data2 = np.random.rand(10, 10)

# Create a figure with two subplots
fig, (ax1, ax2) = plt.subplots(1, 2, figsize=(12, 5))

# Create heatmaps
im1 = ax1.imshow(data1, cmap='viridis')
im2 = ax2.imshow(data2, cmap='plasma')

# Add colorbars to each subplot
cbar1 = plt.colorbar(im1, ax=ax1, location='bottom', pad=0.1, aspect=20)
cbar2 = plt.colorbar(im2, ax=ax2, location='bottom', pad=0.1, aspect=20)

# Set titles
ax1.set_title("How to Adjust the Position of a Matplotlib Colorbar - Subplot 1")
ax2.set_title("How to Adjust the Position of a Matplotlib Colorbar - Subplot 2")

# Adjust layout
plt.tight_layout()

# Show the plot
plt.show()
Output:
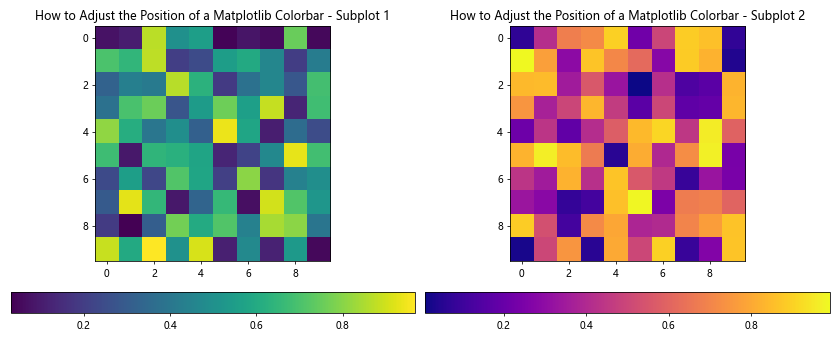
In this example, we create two subplots side by side and add a colorbar to each subplot. We use the location parameter to place the colorbars at the bottom of each subplot. The pad parameter is used to add some space between the subplot and the colorbar, while the aspect parameter controls the colorbar’s aspect ratio.
By adjusting these parameters, you can create a visually appealing layout for multiple subplots with colorbars.
Creating a Shared Colorbar for Multiple Subplots
In some cases, you might want to create a single, shared colorbar for multiple subplots. This can be useful when the subplots use the same color mapping and range. Here’s an example of how to create a shared colorbar:
import matplotlib.pyplot as plt
import numpy as np

# Create sample data
data1 = np.random.rand(10, 10)
data2 = np.random.rand(10, 10)

# Create a figure with two subplots
fig, (ax1, ax2) = plt.subplots(1, 2, figsize=(12, 5))

# Create heatmaps
im1 = ax1.imshow(data1, cmap='viridis', vmin=0, vmax=1)
im2 = ax2.imshow(data2, cmap='viridis', vmin=0, vmax=1)

# Add a shared colorbar
cbar = fig.colorbar(im1, ax=[ax1, ax2], location='bottom', aspect=30, pad=0.08)

# Set titles
ax1.set_title("How to Adjust the Position of a Matplotlib Colorbar - Shared 1")
ax2.set_title("How to Adjust the Position of a Matplotlib Colorbar - Shared 2")

# Adjust layout
plt.tight_layout()

# Show the plot
plt.show()
Output:
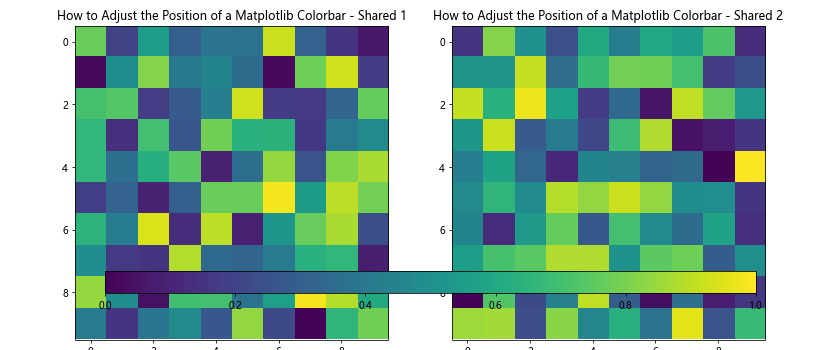
In this example, we create two subplots with heatmaps using the same colormap and data range. We then add a single, shared colorbar at the bottom of the figure using fig.colorbar(). The ax parameter is set to a list containing both subplot axes, which tells Matplotlib to create a colorbar that spans the width of both subplots.
By adjusting the aspect and pad parameters, you can fine-tune the appearance and position of the shared colorbar.
Adjusting Colorbar Size and Aspect Ratio
The size and aspect ratio of a colorbar can significantly impact the overall appearance of your plot. Matplotlib provides several parameters to control these attributes. Let’s explore how to adjust the size and aspect ratio of a colorbar:
import matplotlib.pyplot as plt
import numpy as np

# Create sample data
data = np.random.rand(10, 10)

# Create a figure and axis
fig, ax = plt.subplots(figsize=(8, 6))

# Create a heatmap
im = ax.imshow(data, cmap='viridis')

# Add a colorbar with custom size and aspect ratio
cbar = plt.colorbar(im, fraction=0.046, pad=0.04, aspect=30)

# Set title
plt.title("How to Adjust the Position of a Matplotlib Colorbar - Size and Aspect Ratio")

# Show the plot
plt.show()
Output:
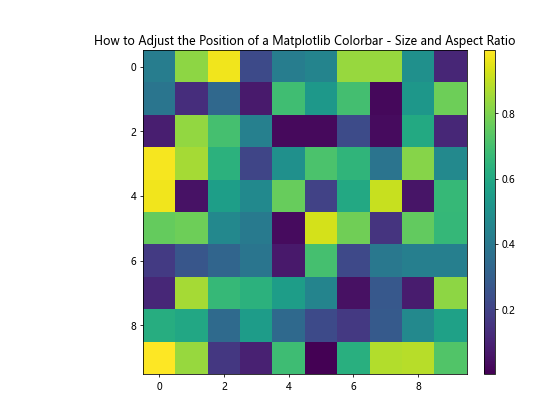
In this example, we use the following parameters to adjust the colorbar’s size and aspect ratio:
fraction: Controls the size of the colorbar relative to the main axes. A smaller value results in a thinner colorbar.pad: Adjusts the space between the main axes and the colorbar.aspect: Controls the aspect ratio of the colorbar. A larger value results in a shorter, wider colorbar.
By experimenting with these parameters, you can fine-tune the appearance of your colorbar to achieve the desired balance with your main plot.
Using GridSpec for Advanced Colorbar Positioning
For more complex layouts or when you need precise control over the position and size of your colorbar, you can use Matplotlib’s GridSpec functionality. GridSpec allows you to create a grid-based layout for your figure and place plot elements, including colorbars, in specific grid cells.
Here’s an example demonstrating how to use GridSpec for advanced colorbar positioning:
import matplotlib.pyplot as plt
import numpy as np
from matplotlib.gridspec import GridSpec

# Create sample data
data = np.random.rand(10, 10)

# Create a figure
fig = plt.figure(figsize=(10, 8))

# Create a GridSpec layout
gs = GridSpec(3, 3, figure=fig)

# Create the main plot in a 2x2 grid
ax = fig.add_subplot(gs[:-1, :-1])
im = ax.imshow(data, cmap='viridis')

# Add a colorbar in the rightmost column
cax = fig.add_subplot(gs[:-1, -1])
cbar = plt.colorbar(im, cax=cax)

# Set title
ax.set_title("How to Adjust the Position of a Matplotlib Colorbar - GridSpec")

# Show the plot
plt.show()
Output:
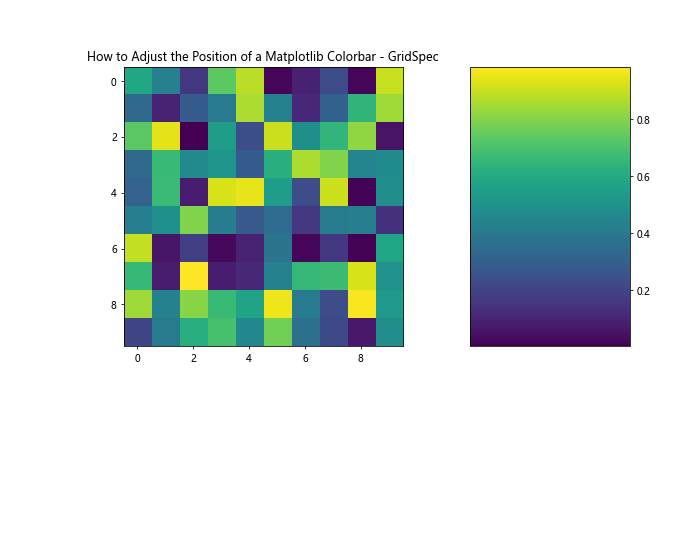
In this example, we create a 3×3 grid using GridSpec. We place the main plot in a 2×2 area (top-left) and the colorbar in the rightmost column. This approach gives you precise control over the layout of your figure, allowing you to create complex arrangements of plots and colorbars.
Adjusting Colorbar Position for 3D Plots
When working with 3D plots in Matplotlib, adjusting the position of the colorbar requires a slightly different approach. Let’s explore how to adjust the colorbar position for a 3D surface plot:
import matplotlib.pyplot as plt
import numpy as np
from mpl_toolkits.mplot3d import Axes3D

# Create sample data
x = np.linspace(-5, 5, 100)
y = np.linspace(-5, 5, 100)
X, Y = np.meshgrid(x, y)
Z = np.sin(np.sqrt(X**2 + Y**2))

# Create a figure and 3D axis
fig = plt.figure(figsize=(10, 8))
ax = fig.add_subplot(111, projection='3d')

# Create a surface plot
surf = ax.plot_surface(X, Y, Z, cmap='viridis')

# Add a colorbar with adjusted position
cbar = fig.colorbar(surf, ax=ax, shrink=0.6, aspect=10, pad=0.1)

# Set title
ax.set_title("How to Adjust the Position of a Matplotlib Colorbar - 3D Plot")

# Show the plot
plt.show()
Output:
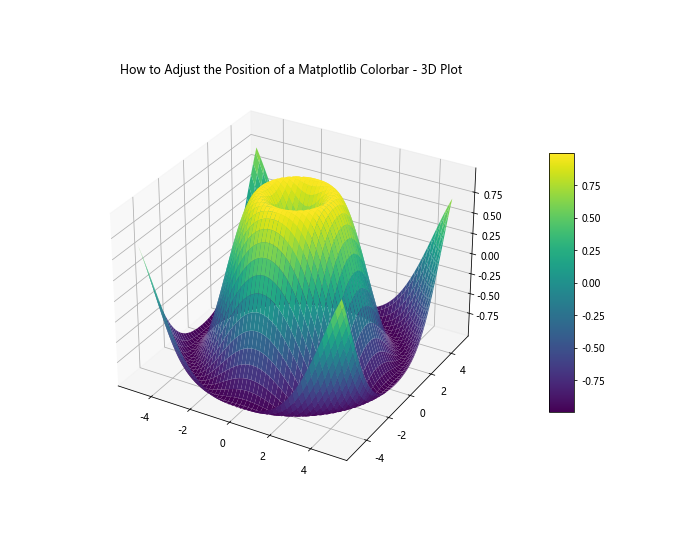
In this example, we create a 3D surface plot and add a colorbar using fig.colorbar(). We adjust the colorbar’s position and size using the following parameters:
shrink: Reduces the size of the colorbar relative to the axis height.aspect: Controls the aspect ratio of the colorbar.pad: Adjusts the space between the axis and the colorbar.
By fine-tuning these parameters, you can achieve the desired colorbar position and size for your 3D plot.
Creating a Detached Colorbar
In some cases, you might want to create a detached colorbar that’s not directly associated with a specific plot. This can be useful when you want to create a legend-like colorbar for multiple plots or when you need more flexibility in positioning the colorbar.
Here’s an example of how to create a detached colorbar:
import matplotlib.pyplot as plt
import numpy as np
from matplotlib.cm import ScalarMappable
from matplotlib.colors import Normalize

# Create a figure and axis
fig, ax = plt.subplots(figsize=(10, 6))

# Create some sample data
x = np.linspace(0, 10, 100)
y1 = np.sin(x)
y2 = np.cos(x)

# Plot the data with color-coded lines
line1 = ax.plot(x, y1, c='r', label='sin(x)')
line2 = ax.plot(x, y2, c='b', label='cos(x)')# Add a legend
ax.legend()

# Create a ScalarMappable object for the colorbar
norm = Normalize(vmin=0, vmax=1)
sm = ScalarMappable(cmap='viridis', norm=norm)
sm.set_array([])

# Add a detached colorbar
cbar = fig.colorbar(sm, ax=ax, orientation='horizontal', pad=0.2, aspect=30)
cbar.set_label('How to Adjust the Position of a Matplotlib Colorbar - Value')

# Set title
ax.set_title("How to Adjust the Position of a Matplotlib Colorbar - Detached Colorbar")

# Show the plot
plt.show()
Output:
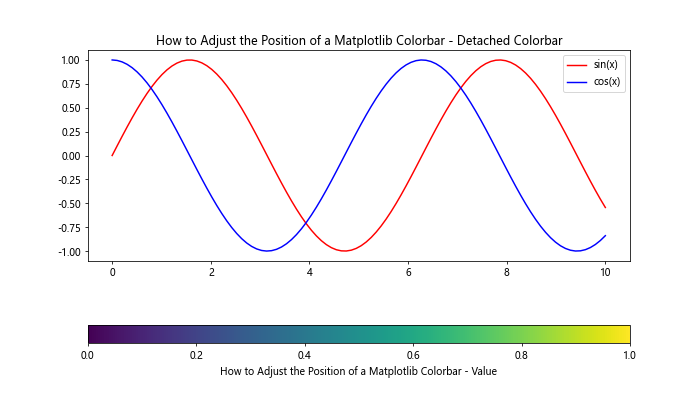
In this example, we create a plot with two lines and add a detached colorbar at the bottom. We use a ScalarMappable object to create the colorbar without directly associating it with a specific plot element. This approach gives you more flexibility in positioning and styling the colorbar.
Adjusting Colorbar Tick Labels and Formatting
When adjusting the position of a Matplotlib colorbar, you might also want to customize its tick labels and formatting. This can help improve the readability and interpretation of your colorbar. Let’s explore some techniques for adjusting colorbar tick labels and formatting:
import matplotlib.pyplot as plt
import numpy as np

# Create sample data
data = np.random.rand(10, 10) * 1000

# Create a figure and axis
fig, ax = plt.subplots(figsize=(10, 8))

# Create a heatmap
im = ax.imshow(data, cmap='plasma')

# Add a colorbar with custom tick labels and formatting
cbar = plt.colorbar(im, orientation='vertical', pad=0.02, aspect=30)
cbar.set_label('How to Adjust the Position of a Matplotlib Colorbar - Value ($)')
cbar.set_ticks([0, 250, 500, 750, 1000])
cbar.set_ticklabels(['$0', '$250', '$500', '$750', '$1000'])
cbar.formatter.set_scientific(False)
cbar.update_ticks()

# Set title
ax.set_title("How to Adjust the Position of a Matplotlib Colorbar - Custom Ticks and Formatting")

# Show the plot
plt.show()
In this example, we demonstrate several techniques for customizing the colorbar’s tick labels and formatting:
- We use
cbar.set_label()to add a label to the colorbar. cbar.set_ticks()is used to specify custom tick locations.cbar.set_ticklabels()allows us to set custom labels for the ticks.- We disable scientific notation using
cbar.formatter.set_scientific(False). - Finally, we call
cbar.update_ticks()to apply the changes.
These techniques allow you to create more informative and visually appealing colorbars that complement your data visualization.
Creating a Discrete Colorbar
In some cases, you might want to create a discrete colorbar with distinct color levels instead of a continuous gradient. This can be particularly useful for categorical data or when you want to emphasize specific value ranges. Here’s an example of how to create a discrete colorbar:
import matplotlib.pyplot as plt
import numpy as np
from matplotlib.colors import BoundaryNorm, ListedColormap

# Create sample data
data = np.random.randint(0, 5, (10, 10))

# Define colors and boundaries for discrete colorbar
colors = ['#FFA07A', '#98FB98', '#87CEFA', '#DDA0DD', '#F0E68C']
bounds = [0, 1, 2, 3, 4, 5]
cmap = ListedColormap(colors)
norm = BoundaryNorm(bounds, cmap.N)

# Create a figure and axis
fig, ax = plt.subplots(figsize=(10, 8))

# Create a heatmap with discrete colors
im = ax.imshow(data, cmap=cmap, norm=norm)

# Add a discrete colorbar
cbar = plt.colorbar(im, orientation='vertical', pad=0.02, aspect=30,
                    boundaries=bounds, ticks=bounds[:-1] + 0.5)
cbar.set_ticklabels(['Category A', 'Category B', 'Category C', 'Category D', 'Category E'])
cbar.set_label('How to Adjust the Position of a Matplotlib Colorbar - Categories')

# Set title
ax.set_title("How to Adjust the Position of a Matplotlib Colorbar - Discrete Colorbar")

# Show the plot
plt.show()
In this example, we create a discrete colorbar with five distinct categories. We use ListedColormap to define custom colors for each category and BoundaryNorm to set the boundaries between categories. The boundaries parameter in plt.colorbar() ensures that the colorbar displays discrete color blocks instead of a continuous gradient.
Adjusting Colorbar Position for Polar Plots
Polar plots present a unique challenge when it comes to adjusting the position of a Matplotlib colorbar. The circular nature of polar plots requires careful consideration of the colorbar placement to maintain a balanced and visually appealing layout. Let’s explore how to adjust the colorbar position for a polar plot:
import matplotlib.pyplot as plt
import numpy as np

# Create sample data
r = np.linspace(0, 2, 100)
theta = np.linspace(0, 2*np.pi, 100)
R, Theta = np.meshgrid(r, theta)
Z = R**2 * (1 - R/2) * np.cos(5*Theta)

# Create a figure and polar axis
fig, ax = plt.subplots(figsize=(10, 8), subplot_kw=dict(projection='polar'))

# Create a polar contour plot
im = ax.contourf(Theta, R, Z, cmap='viridis')

# Add a colorbar with adjusted position
cbar = plt.colorbar(im, orientation='vertical', pad=0.1, fraction=0.046, aspect=30)
cbar.set_label('How to Adjust the Position of a Matplotlib Colorbar - Value')

# Set title
ax.set_title("How to Adjust the Position of a Matplotlib Colorbar - Polar Plot")

# Show the plot
plt.show()
Output:
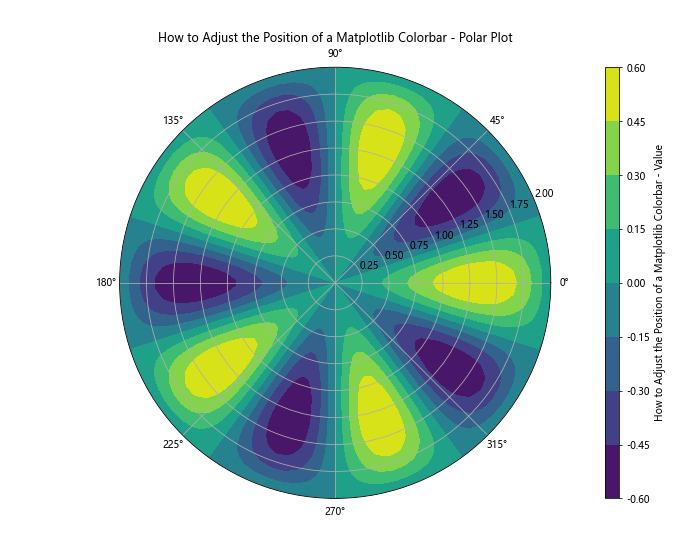
In this example, we create a polar contour plot and add a colorbar to it. The key considerations for adjusting the colorbar position in a polar plot are:
- Use the
padparameter to control the distance between the polar plot and the colorbar. - Adjust the
fractionparameter to control the width of the colorbar relative to the plot. - Fine-tune the
aspectparameter to achieve the desired height of the colorbar.
By carefully adjusting these parameters, you can create a visually balanced layout that complements your polar plot.
Creating a Colorbar with Custom Colors and Gradients
Sometimes, you may want to create a colorbar with custom colors or gradients that are not available in Matplotlib’s built-in colormaps. This can be useful for creating brand-specific visualizations or for emphasizing certain aspects of your data. Let’s explore how to create a colorbar with custom colors and gradients:
import matplotlib.pyplot as plt
import numpy as np
from matplotlib.colors import LinearSegmentedColormap

# Create sample data
data = np.random.rand(10, 10)

# Define custom colors
colors = ['#FF6B6B', '#4ECDC4', '#45B7D1', '#1A535C']
n_bins = 100

# Create custom colormap
cmap = LinearSegmentedColormap.from_list('custom_cmap', colors, N=n_bins)

# Create a figure and axis
fig, ax = plt.subplots(figsize=(10, 8))

# Create a heatmap with custom colormap
im = ax.imshow(data, cmap=cmap)

# Add a colorbar with custom colors
cbar = plt.colorbar(im, orientation='vertical', pad=0.02, aspect=30)
cbar.set_label('How to Adjust the Position of a Matplotlib Colorbar - Custom Colors')

# Set title
ax.set_title("How to Adjust the Position of a Matplotlib Colorbar - Custom Gradient")

# Show the plot
plt.show()
Output:
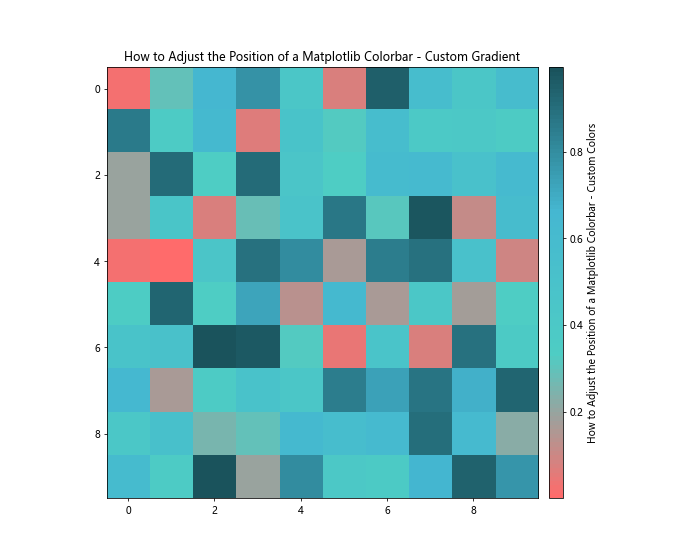
In this example, we create a custom colormap using LinearSegmentedColormap.from_list(). This allows us to define a list of colors that will be interpolated to create a smooth gradient. By adjusting the colors and the number of bins, you can create unique and visually striking colorbars that perfectly match your visualization needs.
Conclusion
In this comprehensive guide, we’ve explored various techniques for adjusting the position of a Matplotlib colorbar. We’ve covered everything from basic positioning using the location parameter to advanced techniques like using GridSpec for precise control over colorbar placement. We’ve also discussed how to customize colorbar orientation, size, and formatting to create visually appealing and informative visualizations.
Key takeaways from this guide include:
- The
locationparameter provides a quick way to adjust the general position of a colorbar. - For fine-tuning, use
bbox_to_anchorandax.add_axes()to precisely control colorbar placement. - When working with multiple subplots, consider using shared colorbars or adjusting individual colorbar positions for each subplot.
GridSpecoffers advanced layout control for complex figure arrangements.- 3D plots and polar plots require special consideration when adjusting colorbar positions.
- Customizing colorbar tick labels, formatting, and colors can greatly enhance the readability and visual appeal of your plots.
By mastering these techniques, you’ll be able to create professional-looking visualizations with perfectly positioned colorbars that enhance the interpretation of your data. Remember to experiment with different approaches and parameters to find the best solution for your specific visualization needs.