How to Adjust Title Position in Matplotlib
How to Adjust Title Position in Matplotlib is an essential skill for data visualization enthusiasts and professionals alike. Matplotlib, a powerful plotting library for Python, offers various ways to customize the appearance of your plots, including the positioning of titles. In this comprehensive guide, we’ll explore different methods and techniques to adjust title position in Matplotlib, providing you with the knowledge and tools to create visually appealing and informative plots.
Understanding the Importance of Title Position in Matplotlib
Before we dive into the specifics of how to adjust title position in Matplotlib, it’s crucial to understand why title positioning is important. The title of a plot serves as a concise summary of the information presented, and its position can significantly impact the overall readability and aesthetics of the visualization. Proper title positioning can:
- Enhance the visual hierarchy of the plot
- Improve the overall layout and balance of the visualization
- Ensure that the title doesn’t overlap with other plot elements
- Accommodate different plot sizes and aspect ratios
Now that we understand the importance of title positioning, let’s explore various methods to adjust title position in Matplotlib.
Basic Title Positioning in Matplotlib
The most straightforward way to add a title to your Matplotlib plot is by using the title() function. By default, Matplotlib places the title at the top center of the plot. Here’s a simple example:
import matplotlib.pyplot as plt

plt.figure(figsize=(8, 6))
plt.plot([1, 2, 3, 4], [1, 4, 2, 3])
plt.title("How to Adjust Title Position in Matplotlib - Basic Example")
plt.xlabel("X-axis")
plt.ylabel("Y-axis")
plt.savefig("how2matplotlib.com_basic_title.png")
plt.show()
Output:
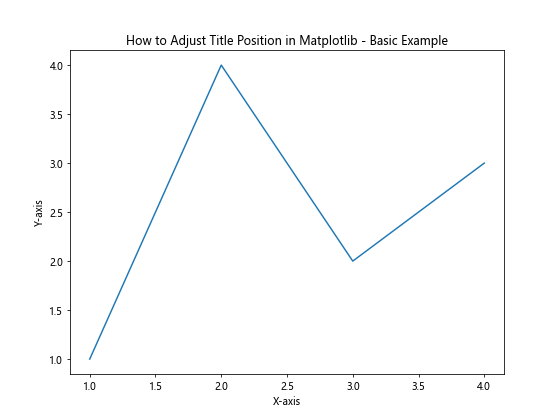
In this example, we create a simple line plot and add a title using the title() function. The title is automatically positioned at the top center of the plot.
Adjusting Title Position Using the loc Parameter
One way to adjust the title position in Matplotlib is by using the loc parameter in the title() function. The loc parameter allows you to specify the location of the title relative to the plot area. Here’s an example:
import matplotlib.pyplot as plt

plt.figure(figsize=(8, 6))
plt.plot([1, 2, 3, 4], [1, 4, 2, 3])
plt.title("How to Adjust Title Position in Matplotlib - Left Aligned", loc="left")
plt.xlabel("X-axis")
plt.ylabel("Y-axis")
plt.savefig("how2matplotlib.com_left_aligned_title.png")
plt.show()
Output:
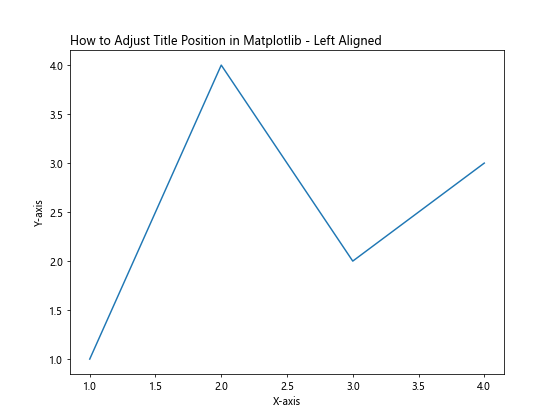
In this example, we use loc="left" to align the title to the left side of the plot. The loc parameter accepts the following values:
"center"(default)"left""right"
Fine-tuning Title Position with x and y Parameters
For more precise control over the title position in Matplotlib, you can use the x and y parameters in the title() function. These parameters allow you to specify the exact coordinates of the title relative to the plot area. Here’s an example:
import matplotlib.pyplot as plt

plt.figure(figsize=(8, 6))
plt.plot([1, 2, 3, 4], [1, 4, 2, 3])
plt.title("How to Adjust Title Position in Matplotlib - Custom Position", x=0.5, y=1.05)
plt.xlabel("X-axis")
plt.ylabel("Y-axis")
plt.savefig("how2matplotlib.com_custom_position_title.png")
plt.show()
Output:
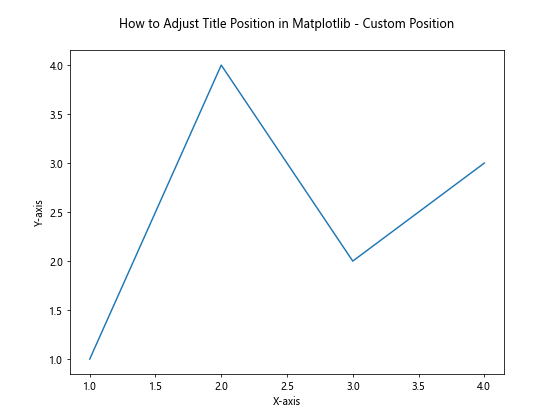
In this example, we set x=0.5 and y=1.05 to position the title slightly above the plot area. The x and y parameters accept values between 0 and 1, where:
x=0corresponds to the left edge of the plotx=1corresponds to the right edge of the ploty=0corresponds to the bottom of the ploty=1corresponds to the top of the plot
You can experiment with different values to find the perfect position for your title.
Adjusting Title Position with plt.suptitle()
When working with subplots or multiple plots in a single figure, you might want to add an overall title to the entire figure. In such cases, you can use the plt.suptitle() function to adjust the title position for the entire figure. Here’s an example:
import matplotlib.pyplot as plt

fig, (ax1, ax2) = plt.subplots(1, 2, figsize=(12, 5))

ax1.plot([1, 2, 3, 4], [1, 4, 2, 3])
ax1.set_title("Subplot 1")

ax2.plot([1, 2, 3, 4], [3, 2, 4, 1])
ax2.set_title("Subplot 2")

plt.suptitle("How to Adjust Title Position in Matplotlib - Suptitle Example", y=1.05)
plt.savefig("how2matplotlib.com_suptitle_example.png")
plt.show()
Output:
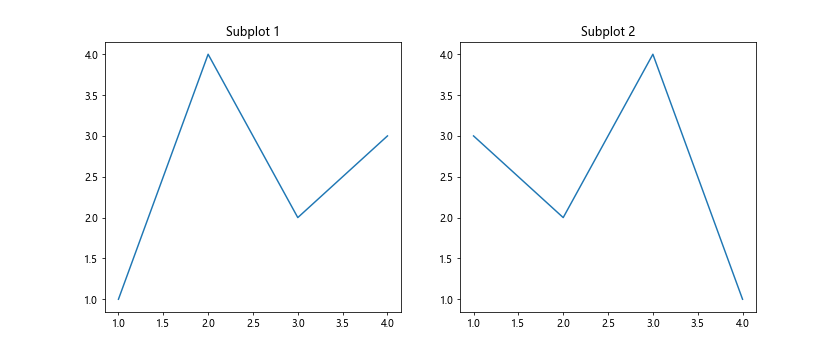
In this example, we create two subplots and use plt.suptitle() to add an overall title to the figure. The y parameter is set to 1.05 to position the title slightly above the subplots.
Using bbox_to_anchor for Advanced Title Positioning
For even more control over title positioning in Matplotlib, you can use the bbox_to_anchor parameter in combination with the bbox_extra_artists parameter when saving the figure. This method allows you to position the title relative to a specific point on the figure. Here’s an example:
import matplotlib.pyplot as plt

fig, ax = plt.subplots(figsize=(8, 6))
ax.plot([1, 2, 3, 4], [1, 4, 2, 3])

title = ax.set_title("How to Adjust Title Position in Matplotlib - bbox_to_anchor Example")
title.set_position((0.5, 1.05))
title.set_bbox(dict(facecolor='white', edgecolor='none', alpha=0.7))

plt.tight_layout()
plt.savefig("how2matplotlib.com_bbox_to_anchor_example.png", bbox_extra_artists=[title], bbox_inches='tight')
plt.show()
Output:
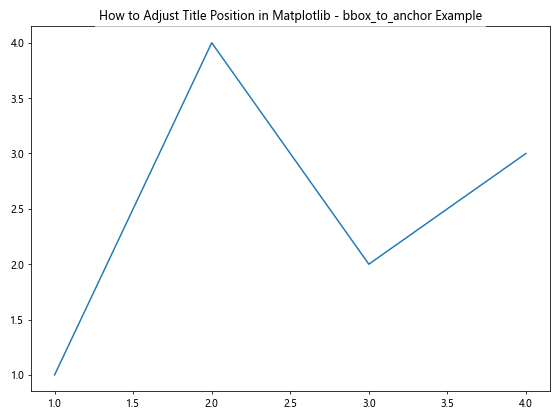
In this example, we use set_position() to set the position of the title and set_bbox() to add a background box to the title. The bbox_extra_artists parameter ensures that the title is included when saving the figure with tight bounds.
Adjusting Title Position for Different Plot Types
Different plot types may require different approaches to title positioning. Let’s explore how to adjust title position in Matplotlib for various plot types.
Bar Plots
When working with bar plots, you might want to position the title to avoid overlapping with the bars. Here’s an example:
import matplotlib.pyplot as plt
import numpy as np

categories = ['A', 'B', 'C', 'D']
values = [3, 7, 2, 5]

plt.figure(figsize=(8, 6))
plt.bar(categories, values)
plt.title("How to Adjust Title Position in Matplotlib - Bar Plot", y=1.05)
plt.xlabel("Categories")
plt.ylabel("Values")
plt.savefig("how2matplotlib.com_bar_plot_title.png")
plt.show()
Output:
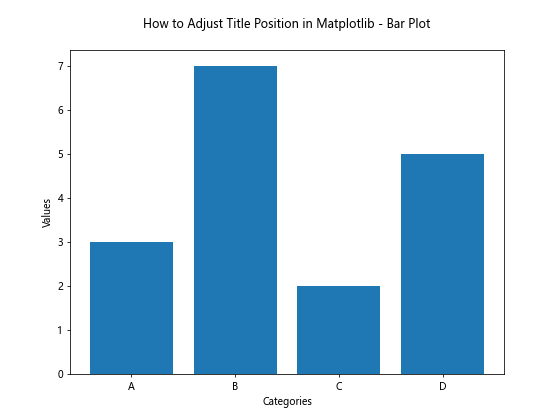
In this example, we set y=1.05 to position the title slightly above the bar plot, ensuring it doesn’t overlap with the tallest bar.
Pie Charts
For pie charts, you might want to position the title above the chart to maintain its circular shape. Here’s an example:
import matplotlib.pyplot as plt

sizes = [30, 20, 25, 15, 10]
labels = ['A', 'B', 'C', 'D', 'E']

plt.figure(figsize=(8, 8))
plt.pie(sizes, labels=labels, autopct='%1.1f%%', startangle=90)
plt.title("How to Adjust Title Position in Matplotlib - Pie Chart", y=1.08)
plt.axis('equal')
plt.savefig("how2matplotlib.com_pie_chart_title.png")
plt.show()
Output:
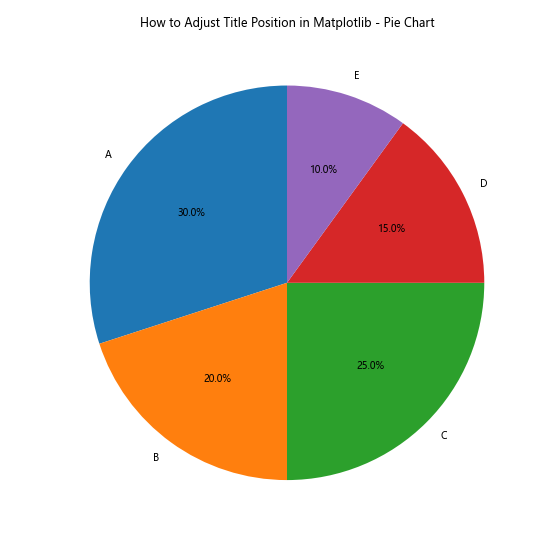
In this example, we set y=1.08 to position the title above the pie chart, maintaining its circular appearance.
Scatter Plots
For scatter plots with a colorbar, you might need to adjust the title position to accommodate the colorbar. Here’s an example:
import matplotlib.pyplot as plt
import numpy as np

x = np.random.rand(50)
y = np.random.rand(50)
colors = np.random.rand(50)

plt.figure(figsize=(8, 6))
scatter = plt.scatter(x, y, c=colors, cmap='viridis')
plt.colorbar(scatter)
plt.title("How to Adjust Title Position in Matplotlib - Scatter Plot", y=1.05)
plt.xlabel("X-axis")
plt.ylabel("Y-axis")
plt.savefig("how2matplotlib.com_scatter_plot_title.png")
plt.show()
Output:
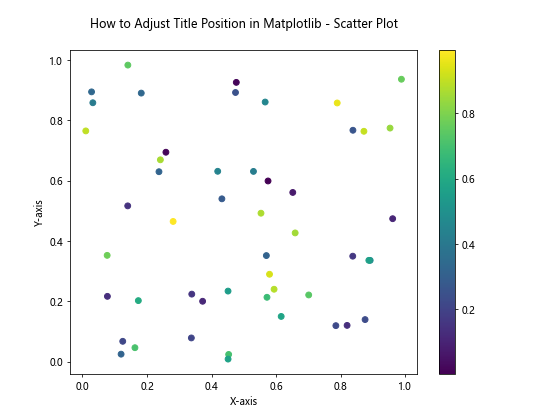
In this example, we set y=1.05 to position the title above the scatter plot and colorbar.
Adjusting Title Position for Multiple Subplots
When working with multiple subplots, you might want to adjust the title position for each subplot individually. Here’s an example:
import matplotlib.pyplot as plt

fig, axs = plt.subplots(2, 2, figsize=(12, 10))

for i, ax in enumerate(axs.flat):
    ax.plot([1, 2, 3, 4], [1, 4, 2, 3])
    ax.set_title(f"Subplot {i+1}", y=1.05)

plt.suptitle("How to Adjust Title Position in Matplotlib - Multiple Subplots", y=1.02)
plt.tight_layout()
plt.savefig("how2matplotlib.com_multiple_subplots_title.png")
plt.show()
Output:
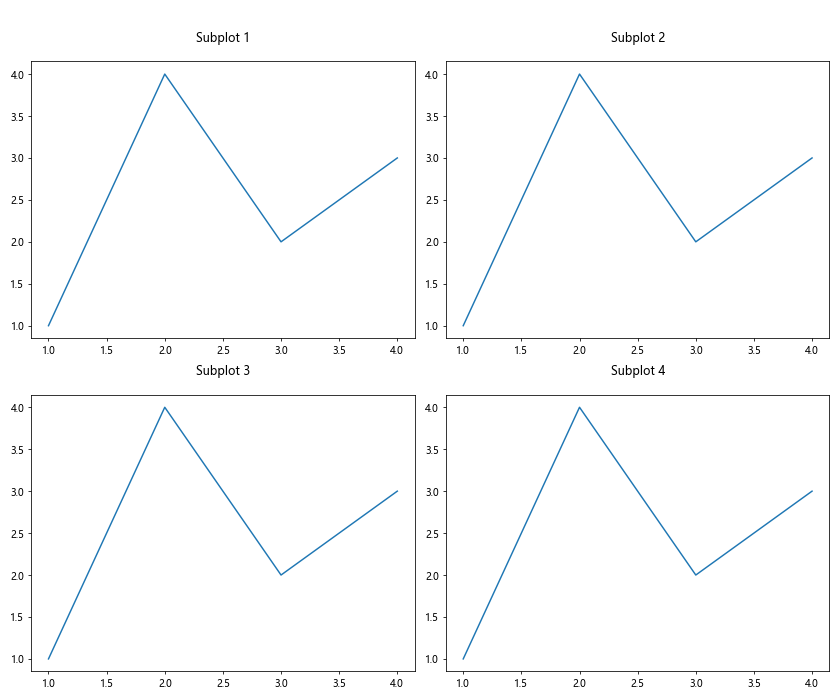
In this example, we use a loop to set the title for each subplot with y=1.05, and then add an overall title using plt.suptitle() with y=1.02.
Adjusting Title Position for Different Plot Orientations
Sometimes, you might need to adjust the title position for plots with different orientations. Let’s look at an example with a horizontal bar plot:
import matplotlib.pyplot as plt

categories = ['A', 'B', 'C', 'D']
values = [3, 7, 2, 5]

plt.figure(figsize=(8, 6))
plt.barh(categories, values)
plt.title("How to Adjust Title Position in Matplotlib - Horizontal Bar Plot", pad=20)
plt.xlabel("Values")
plt.ylabel("Categories")
plt.savefig("how2matplotlib.com_horizontal_bar_plot_title.png")
plt.show()
Output:
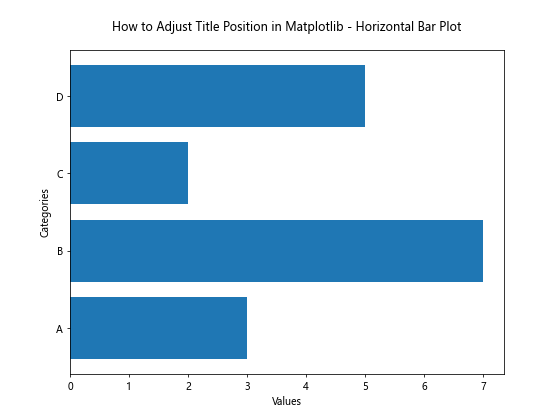
In this example, we use the pad parameter to add extra padding between the title and the plot area, ensuring that the title doesn’t overlap with the horizontal bars.
Using ax.text() for Custom Title Positioning
For even more flexibility in title positioning, you can use the ax.text() function to create a custom title. This method allows you to position the title anywhere on the plot. Here’s an example:
import matplotlib.pyplot as plt

fig, ax = plt.subplots(figsize=(8, 6))
ax.plot([1, 2, 3, 4], [1, 4, 2, 3])

ax.text(0.5, 1.05, "How to Adjust Title Position in Matplotlib - Custom Text Title",
        horizontalalignment='center', verticalalignment='center',
        transform=ax.transAxes, fontsize=14, fontweight='bold')

ax.set_xlabel("X-axis")
ax.set_ylabel("Y-axis")
plt.savefig("how2matplotlib.com_custom_text_title.png")
plt.show()
Output:
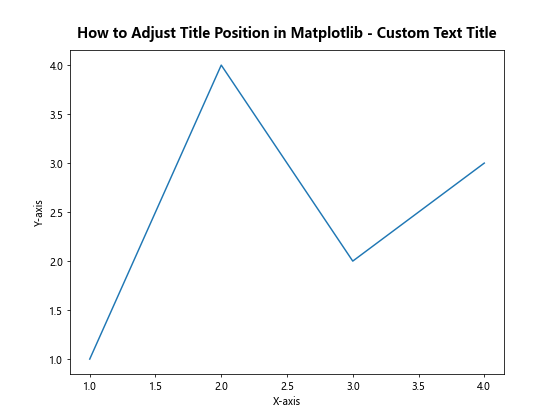
In this example, we use ax.text() to create a custom title positioned above the plot area. The transform=ax.transAxes parameter ensures that the position is relative to the axes coordinates.
Adjusting Title Position for Polar Plots
Polar plots require a different approach to title positioning due to their circular nature. Here’s an example of how to adjust the title position for a polar plot:
import matplotlib.pyplot as plt
import numpy as np

r = np.arange(0, 2, 0.01)
theta = 2 * np.pi * r

fig, ax = plt.subplots(subplot_kw=dict(projection='polar'), figsize=(8, 8))
ax.plot(theta, r)
ax.set_title("How to Adjust Title Position in Matplotlib - Polar Plot", y=1.1)

plt.savefig("how2matplotlib.com_polar_plot_title.png")
plt.show()
Output:
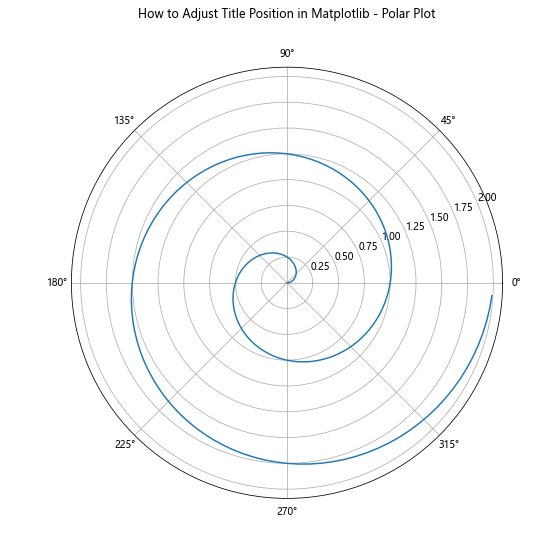
In this example, we set y=1.1 to position the title above the polar plot, ensuring it doesn’t overlap with the circular grid.
Adjusting Title Position for 3D Plots
When working with 3D plots, title positioning requires special consideration. Here’s an example of how to adjust the title position for a 3D surface plot:
import matplotlib.pyplot as plt
import numpy as np
from mpl_toolkits.mplot3d import Axes3D

fig = plt.figure(figsize=(10, 8))
ax = fig.add_subplot(111, projection='3d')

X = np.arange(-5, 5, 0.25)
Y = np.arange(-5, 5, 0.25)
X, Y = np.meshgrid(X, Y)
R = np.sqrt(X**2 + Y**2)
Z = np.sin(R)

surf = ax.plot_surface(X, Y, Z, cmap='viridis')
fig.colorbar(surf)

ax.set_title("How to Adjust Title Position in Matplotlib - 3D Plot", y=1.05)

plt.savefig("how2matplotlib.com_3d_plot_title.png")
plt.show()
Output:
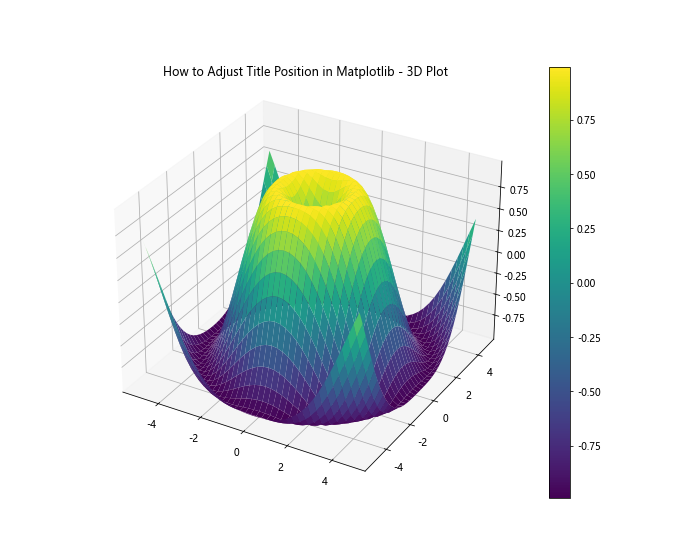
In this example, we set y=1.05 to position the title above the 3D surface plot.
Adjusting Title Position for Annotations and Legends
When your plot includes annotations or legends, you might need to adjust the title position to avoid overlapping. Here’s an example:
import matplotlib.pyplot as plt

fig, ax = plt.subplots(figsize=(10, 6))

ax.plot([1, 2, 3, 4], [1, 4, 2, 3], label="Line 1")
ax.plot([1, 2, 3, 4], [3, 2, 4, 1], label="Line 2")

ax.annotate("Important Point", xy=(2, 4), xytext=(3, 4),
            arrowprops=dict(facecolor='black', shrink=0.05))

ax.legend(loc="upper right")

ax.set_title("How to Adjust Title Position in Matplotlib - Annotations and Legend", pad=20)
ax.set_xlabel("X-axis")
ax.set_ylabel("Y-axis")

plt.savefig("how2matplotlib.com_annotations_legend_title.png")
plt.show()
Output:
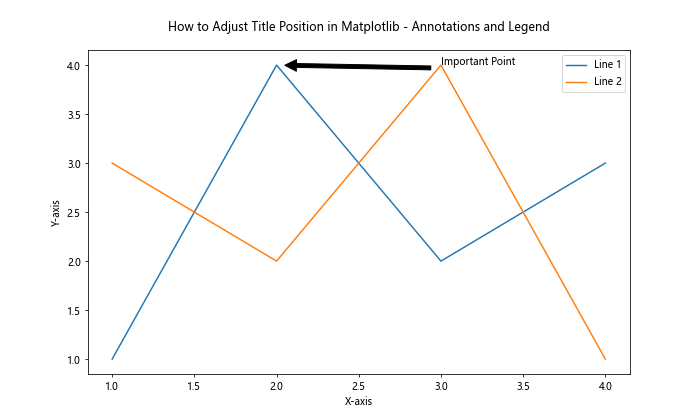
In this example, we use the pad parameter to add extra padding between the title and the plot area, ensuring that the title doesn’t overlap with the annotation or legend.
Using Style Sheets to Adjust Title Position
Matplotlib style sheets can be used to set default title positions for all your plots. Here’s an example of how to create a custom style sheet and use it to adjust title position:
import matplotlib.pyplot as plt

# Create a custom style sheet
plt.style.use({
    'axes.titlepad': 20,
    'axes.titlelocation':'center',
    'figure.titlesize': 16,
    'figure.titleweight': 'bold',
})

plt.figure(figsize=(8, 6))
plt.plot([1, 2, 3, 4], [1, 4, 2, 3])
plt.title("How to Adjust Title Position in Matplotlib - Custom Style Sheet")
plt.xlabel("X-axis")
plt.ylabel("Y-axis")
plt.savefig("how2matplotlib.com_custom_style_sheet_title.png")
plt.show()
Output:
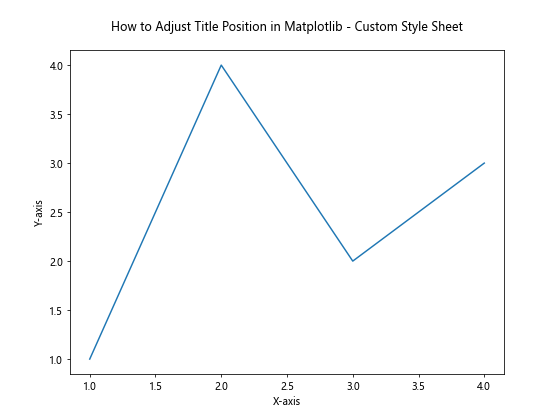
In this example, we create a custom style sheet that sets the default title padding, location, size, and weight. This approach allows you to maintain consistent title positioning across multiple plots.
Adjusting Title Position for Stacked Plots
When creating stacked plots, such as stacked bar charts or area plots, you might need to adjust the title position to account for the increased height of the plot. Here’s an example:
import matplotlib.pyplot as plt
import numpy as np

categories = ['A', 'B', 'C', 'D']
values1 = [3, 7, 2, 5]
values2 = [2, 4, 3, 6]
values3 = [1, 3, 4, 2]

plt.figure(figsize=(10, 6))
plt.bar(categories, values1, label='Group 1')
plt.bar(categories, values2, bottom=values1, label='Group 2')
plt.bar(categories, values3, bottom=np.array(values1) + np.array(values2), label='Group 3')

plt.title("How to Adjust Title Position in Matplotlib - Stacked Bar Chart", y=1.05)
plt.xlabel("Categories")
plt.ylabel("Values")
plt.legend()
plt.savefig("how2matplotlib.com_stacked_bar_chart_title.png")
plt.show()
Output:
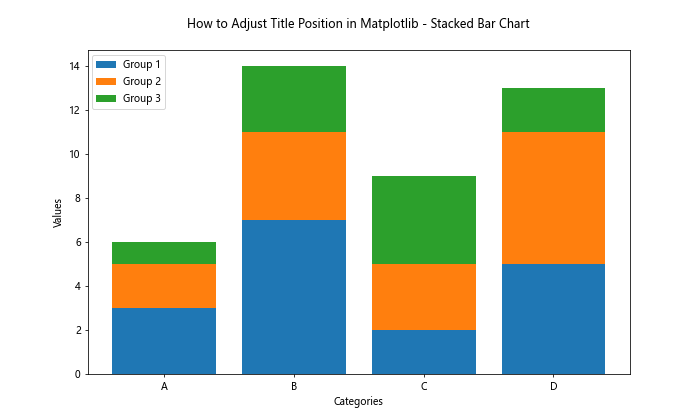
In this example, we set y=1.05 to position the title above the stacked bar chart, ensuring it doesn’t overlap with the topmost bars.
Adjusting Title Position for Subplots with Different Sizes
When working with subplots of different sizes, you might need to adjust the title position for each subplot individually. Here’s an example:
import matplotlib.pyplot as plt
import matplotlib.gridspec as gridspec

fig = plt.figure(figsize=(12, 8))
gs = gridspec.GridSpec(2, 2, height_ratios=[2, 1], width_ratios=[1, 2])

ax1 = plt.subplot(gs[0, 0])
ax1.plot([1, 2, 3, 4], [1, 4, 2, 3])
ax1.set_title("Subplot 1", y=1.05)

ax2 = plt.subplot(gs[0, 1])
ax2.scatter([1, 2, 3, 4], [1, 4, 2, 3])
ax2.set_title("Subplot 2", y=1.05)

ax3 = plt.subplot(gs[1, :])
ax3.bar(['A', 'B', 'C', 'D'], [3, 7, 2, 5])
ax3.set_title("Subplot 3", y=1.05)

plt.suptitle("How to Adjust Title Position in Matplotlib - Different Sized Subplots", y=0.95)
plt.tight_layout()
plt.savefig("how2matplotlib.com_different_sized_subplots_title.png")
plt.show()
Output:
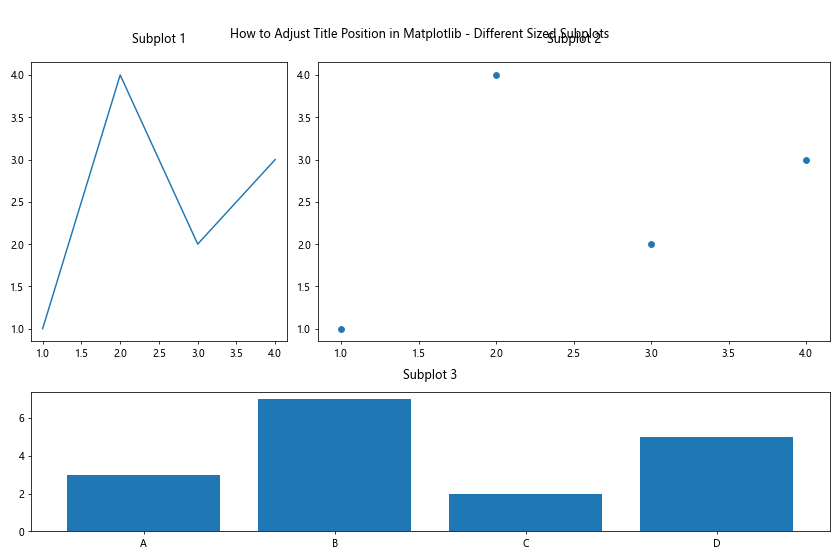
In this example, we use GridSpec to create subplots of different sizes and adjust the title position for each subplot individually using y=1.05. We also add an overall title using plt.suptitle() with y=0.95.
Conclusion: Mastering Title Position Adjustment in Matplotlib
Throughout this comprehensive guide, we’ve explored various techniques and methods for adjusting title position in Matplotlib. From basic positioning using the loc parameter to advanced techniques like custom text titles and style sheets, you now have a wide range of tools at your disposal to create visually appealing and informative plots.
Remember that the key to effective title positioning is to consider the following factors:
- The type of plot you’re creating
- The presence of other plot elements (e.g., legends, annotations, colorbars)
- The overall layout and balance of your visualization
- The specific requirements of your data and audience
By mastering these techniques for adjusting title position in Matplotlib, you’ll be able to create professional-looking visualizations that effectively communicate your data insights. Experiment with different approaches and combinations to find the perfect title position for your specific use case.