How To Annotate Bars in Barplot with Matplotlib
How to annotate bars in barplot with Matplotlib is an essential skill for data visualization enthusiasts and professionals alike. Matplotlib, a powerful plotting library for Python, offers various ways to add annotations to bar plots, enhancing the readability and interpretability of your data. In this comprehensive guide, we’ll explore different techniques and best practices for annotating bars in barplots using Matplotlib. We’ll cover everything from basic annotations to advanced customization options, providing you with the knowledge and tools to create informative and visually appealing bar plots.
Understanding the Basics of Bar Plot Annotations in Matplotlib
Before diving into the specifics of how to annotate bars in barplot with Matplotlib, it’s crucial to understand the fundamental concepts. Bar plots are an excellent way to visualize categorical data, and adding annotations can significantly improve the clarity of your visualizations. Annotations in Matplotlib can include text, arrows, shapes, and other elements that provide additional context or highlight specific data points.
Let’s start with a simple example of how to create a basic bar plot and add annotations:
import matplotlib.pyplot as plt
import numpy as np

categories = ['A', 'B', 'C', 'D']
values = [15, 30, 45, 10]

fig, ax = plt.subplots(figsize=(10, 6))
bars = ax.bar(categories, values)

for bar in bars:
    height = bar.get_height()
    ax.text(bar.get_x() + bar.get_width()/2, height,
            f'{height}', ha='center', va='bottom')

plt.title('How to Annotate Bars in Barplot with Matplotlib - Basic Example')
plt.xlabel('Categories')
plt.ylabel('Values')
plt.suptitle('Visit how2matplotlib.com for more examples', fontsize=10)
plt.show()
Output:
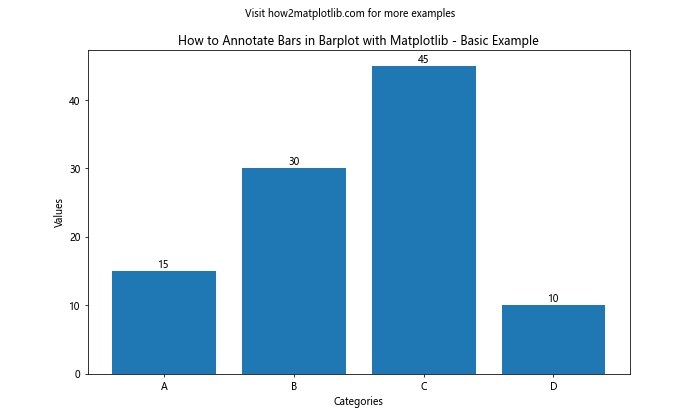
In this example, we create a simple bar plot and add text annotations above each bar. The ax.text() function is used to place the text at the appropriate position. The ha and va parameters control the horizontal and vertical alignment of the text.
Customizing Text Annotations in Matplotlib Bar Plots
When learning how to annotate bars in barplot with Matplotlib, it’s important to understand the various ways you can customize text annotations. Matplotlib provides numerous options to modify the appearance of your annotations, including font size, color, style, and rotation.
Here’s an example demonstrating how to customize text annotations:
import matplotlib.pyplot as plt
import numpy as np

categories = ['Product A', 'Product B', 'Product C', 'Product D']
values = [1500, 3000, 4500, 1000]

fig, ax = plt.subplots(figsize=(12, 7))
bars = ax.bar(categories, values)

for bar in bars:
    height = bar.get_height()
    ax.text(bar.get_x() + bar.get_width()/2, height,
            f'${height:,}', ha='center', va='bottom',
            fontsize=12, fontweight='bold', color='red',
            rotation=45)

plt.title('How to Annotate Bars in Barplot with Matplotlib - Customized Text', fontsize=16)
plt.xlabel('Products', fontsize=14)
plt.ylabel('Sales ($)', fontsize=14)
plt.suptitle('Visit how2matplotlib.com for more examples', fontsize=10)
plt.show()
Output:
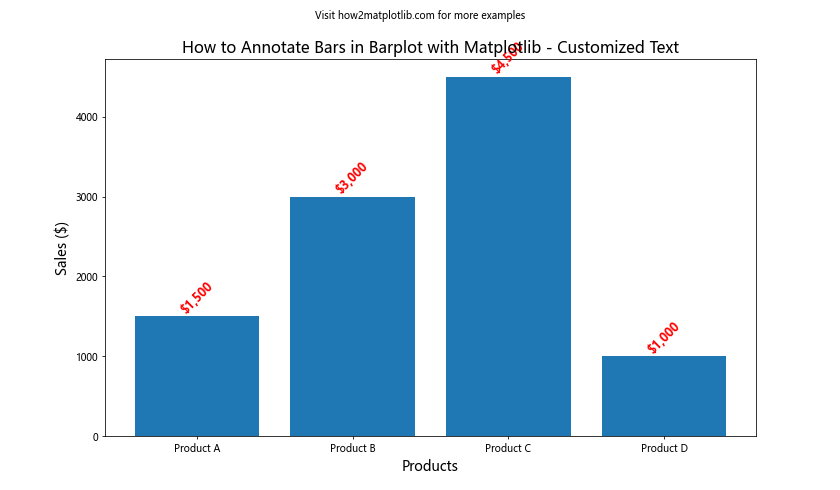
In this example, we’ve customized the text annotations by changing the font size, weight, color, and rotation. We’ve also formatted the values as currency and added commas for better readability.
Adding Percentage Annotations to Matplotlib Bar Plots
When visualizing data that represents proportions or percentages, it’s often useful to annotate bars with percentage values. Here’s how to annotate bars in barplot with Matplotlib using percentage annotations:
import matplotlib.pyplot as plt
import numpy as np

categories = ['Category A', 'Category B', 'Category C', 'Category D']
values = [30, 45, 15, 10]

fig, ax = plt.subplots(figsize=(10, 6))
bars = ax.bar(categories, values)

total = sum(values)
for bar in bars:
    height = bar.get_height()
    percentage = (height / total) * 100
    ax.text(bar.get_x() + bar.get_width()/2, height,
            f'{percentage:.1f}%', ha='center', va='bottom')

plt.title('How to Annotate Bars in Barplot with Matplotlib - Percentage Annotations')
plt.xlabel('Categories')
plt.ylabel('Values')
plt.suptitle('Visit how2matplotlib.com for more examples', fontsize=10)
plt.show()
Output:
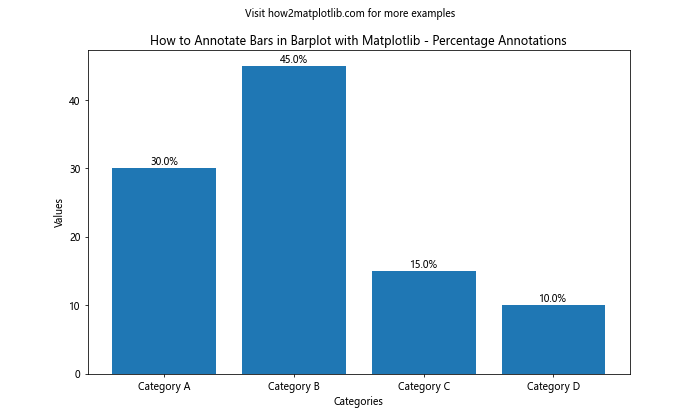
In this example, we calculate the percentage for each bar and display it as an annotation. The .1f format specifier ensures that the percentage is displayed with one decimal place.
Using Arrow Annotations in Matplotlib Bar Plots
Arrow annotations can be particularly useful when you want to draw attention to specific bars or highlight trends in your data. Here’s an example of how to annotate bars in barplot with Matplotlib using arrows:
import matplotlib.pyplot as plt
import numpy as np

categories = ['Jan', 'Feb', 'Mar', 'Apr', 'May']
values = [100, 120, 80, 150, 200]

fig, ax = plt.subplots(figsize=(12, 7))
bars = ax.bar(categories, values)

ax.annotate('Lowest month', xy=(2, 80), xytext=(3, 40),
            arrowprops=dict(facecolor='red', shrink=0.05),
            fontsize=12, ha='center')

ax.annotate('Highest month', xy=(4, 200), xytext=(3, 220),
            arrowprops=dict(facecolor='green', shrink=0.05),
            fontsize=12, ha='center')

plt.title('How to Annotate Bars in Barplot with Matplotlib - Arrow Annotations', fontsize=16)
plt.xlabel('Months', fontsize=14)
plt.ylabel('Sales', fontsize=14)
plt.suptitle('Visit how2matplotlib.com for more examples', fontsize=10)
plt.show()
Output:
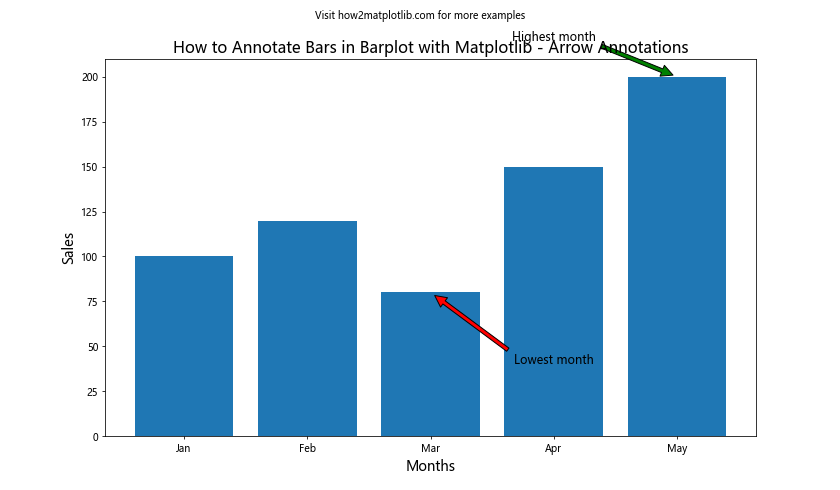
In this example, we use ax.annotate() to add arrow annotations pointing to the lowest and highest bars. The xy parameter specifies the point to which the arrow points, while xytext determines the starting position of the annotation text.
Adding Horizontal Line Annotations to Matplotlib Bar Plots
Sometimes, it’s useful to add horizontal lines to your bar plot to indicate targets, averages, or thresholds. Here’s how to annotate bars in barplot with Matplotlib using horizontal lines:
import matplotlib.pyplot as plt
import numpy as np

categories = ['Product A', 'Product B', 'Product C', 'Product D', 'Product E']
values = [80, 120, 160, 200, 140]

fig, ax = plt.subplots(figsize=(12, 7))
bars = ax.bar(categories, values)

average = np.mean(values)
ax.axhline(average, color='red', linestyle='--', linewidth=2)
ax.text(len(categories)-1, average, f'Average: {average:.0f}',
        ha='right', va='bottom', color='red', fontweight='bold')

target = 175
ax.axhline(target, color='green', linestyle='-.', linewidth=2)
ax.text(0, target, f'Target: {target}',
        ha='left', va='bottom', color='green', fontweight='bold')

plt.title('How to Annotate Bars in Barplot with Matplotlib - Horizontal Line Annotations', fontsize=16)
plt.xlabel('Products', fontsize=14)
plt.ylabel('Sales', fontsize=14)
plt.suptitle('Visit how2matplotlib.com for more examples', fontsize=10)
plt.show()
Output:
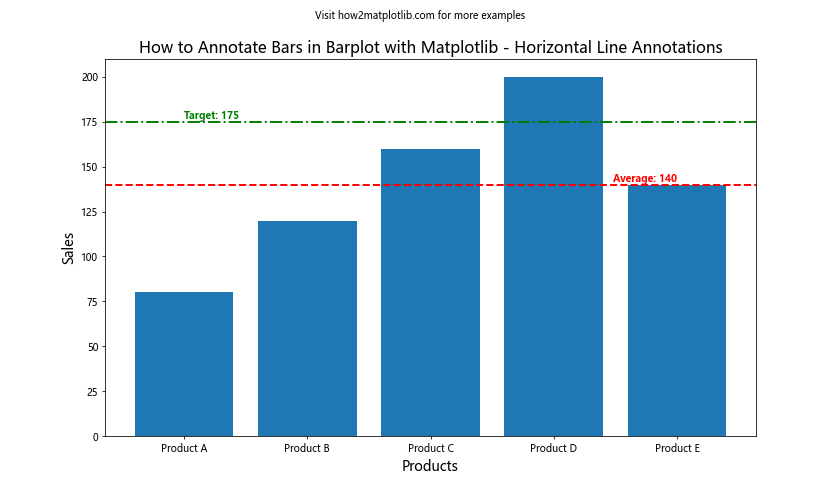
In this example, we add two horizontal lines: one for the average value and another for a target value. The ax.axhline() function is used to create the lines, and we add text annotations to label each line.
Using Color-coded Annotations in Matplotlib Bar Plots
Color-coding your annotations can help convey additional information or highlight specific data points. Here’s an example of how to annotate bars in barplot with Matplotlib using color-coded annotations:
import matplotlib.pyplot as plt
import numpy as np

categories = ['A', 'B', 'C', 'D', 'E']
values = [15, 30, 45, 10, 25]

fig, ax = plt.subplots(figsize=(10, 6))
bars = ax.bar(categories, values)

threshold = 20
colors = ['red' if v < threshold else 'green' for v in values]

for bar, color in zip(bars, colors):
    height = bar.get_height()
    ax.text(bar.get_x() + bar.get_width()/2, height,
            f'{height}', ha='center', va='bottom',
            color=color, fontweight='bold')

plt.title('How to Annotate Bars in Barplot with Matplotlib - Color-coded Annotations')
plt.xlabel('Categories')
plt.ylabel('Values')
plt.suptitle('Visit how2matplotlib.com for more examples', fontsize=10)
plt.show()
Output:
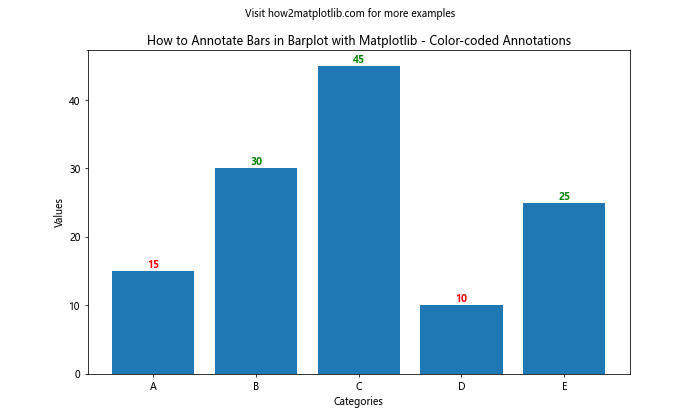
In this example, we color-code the annotations based on whether the value is above or below a certain threshold. This technique can be particularly useful for quickly identifying high or low performers in a dataset.
Annotating Grouped Bar Plots in Matplotlib
Grouped bar plots are useful for comparing multiple categories across different groups. Here's how to annotate bars in barplot with Matplotlib for grouped bar plots:
import matplotlib.pyplot as plt
import numpy as np

categories = ['Group A', 'Group B', 'Group C']
men_means = [20, 35, 30]
women_means = [25, 32, 34]
width = 0.35

fig, ax = plt.subplots(figsize=(12, 7))
x = np.arange(len(categories))
rects1 = ax.bar(x - width/2, men_means, width, label='Men')
rects2 = ax.bar(x + width/2, women_means, width, label='Women')

def autolabel(rects):
    for rect in rects:
        height = rect.get_height()
        ax.annotate(f'{height}',
                    xy=(rect.get_x() + rect.get_width() / 2, height),
                    xytext=(0, 3),  # 3 points vertical offset
                    textcoords="offset points",
                    ha='center', va='bottom')

autolabel(rects1)
autolabel(rects2)

ax.set_ylabel('Scores')
ax.set_title('How to Annotate Bars in Barplot with Matplotlib - Grouped Bar Annotations')
ax.set_xticks(x)
ax.set_xticklabels(categories)
ax.legend()

plt.suptitle('Visit how2matplotlib.com for more examples', fontsize=10)
plt.show()
Output:
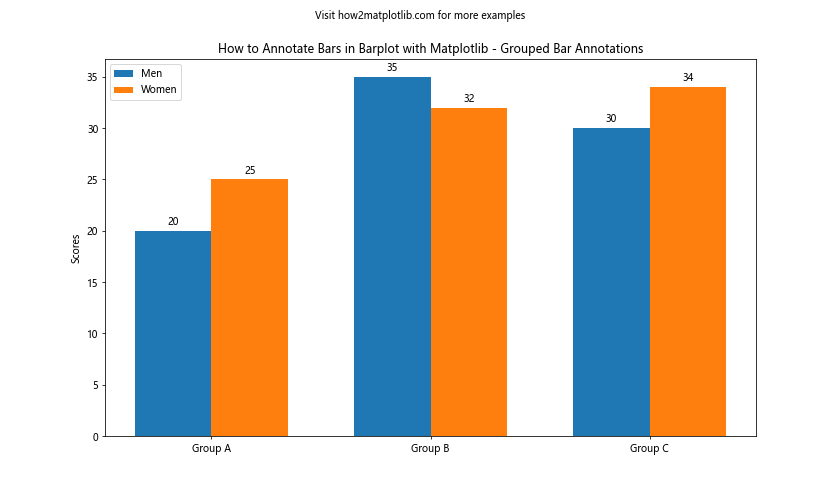
In this example, we create a grouped bar plot comparing men's and women's scores across different groups. The autolabel() function is defined to add annotations to each bar, and we call it separately for each group of bars.
Adding Custom Shapes as Annotations in Matplotlib Bar Plots
Sometimes, you might want to use custom shapes or symbols as annotations in your bar plots. Here's an example of how to annotate bars in barplot with Matplotlib using custom shapes:
import matplotlib.pyplot as plt
import numpy as np

categories = ['A', 'B', 'C', 'D']
values = [15, 30, 45, 10]

fig, ax = plt.subplots(figsize=(10, 6))
bars = ax.bar(categories, values)

for i, bar in enumerate(bars):
    height = bar.get_height()
    if height == max(values):
        ax.add_patch(plt.Circle((bar.get_x() + bar.get_width()/2, height), 0.5, color='gold'))
        ax.text(bar.get_x() + bar.get_width()/2, height+1, 'Top', ha='center', va='bottom')
    elif height == min(values):
        ax.add_patch(plt.Rectangle((bar.get_x(), height), bar.get_width(), 0.5, color='red', alpha=0.5))
        ax.text(bar.get_x() + bar.get_width()/2, height-1, 'Low', ha='center', va='top')

plt.title('How to Annotate Bars in Barplot with Matplotlib - Custom Shape Annotations')
plt.xlabel('Categories')
plt.ylabel('Values')
plt.suptitle('Visit how2matplotlib.com for more examples', fontsize=10)
plt.show()
Output:
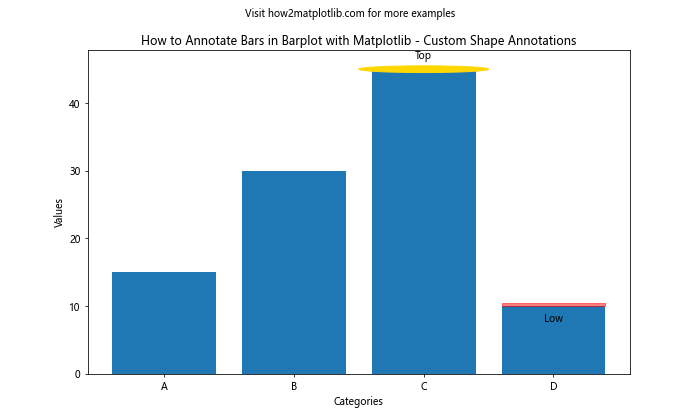
In this example, we add a gold circle to the highest bar and a red rectangle to the lowest bar. These custom shapes serve as visual annotations to highlight specific data points.
Annotating Horizontal Bar Plots in Matplotlib
While we've focused on vertical bar plots so far, it's also important to know how to annotate bars in barplot with Matplotlib for horizontal bar plots. Here's an example:
import matplotlib.pyplot as plt
import numpy as np

categories = ['Category A', 'Category B', 'Category C', 'Category D', 'Category E']
values = [15, 30, 45, 10, 25]

fig, ax = plt.subplots(figsize=(10, 8))
bars = ax.barh(categories, values)

for i, v in enumerate(values):
    ax.text(v + 1, i, str(v), va='center')

plt.title('How to Annotate Bars in Barplot with Matplotlib - Horizontal Bar Annotations')
plt.xlabel('Values')
plt.suptitle('Visit how2matplotlib.com for more examples', fontsize=10)
plt.show()
Output:
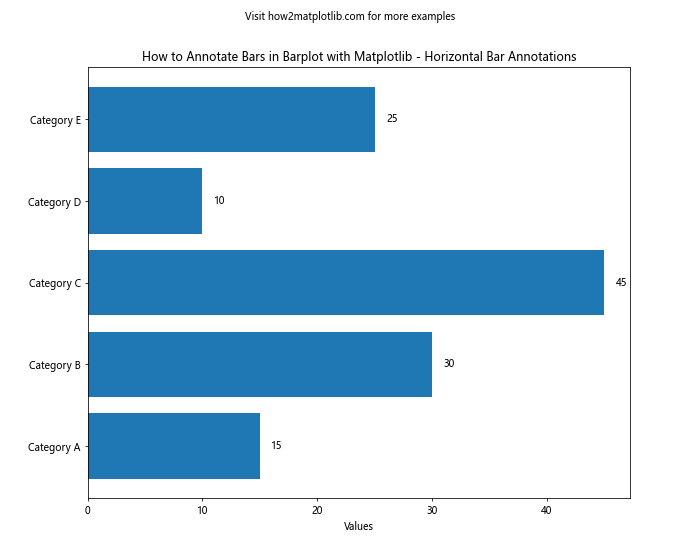
In this example, we create a horizontal bar plot and add text annotations to the right of each bar. The ax.barh() function is used to create horizontal bars, and we adjust the text positioning accordingly.
Adding Multiple Annotations to a Single Bar in Matplotlib
Sometimes, you may want to add multiple annotations to a single bar to provide different types of information. Here's how to annotate bars in barplot with Matplotlib using multiple annotations per bar:
import matplotlib.pyplot as plt
import numpy as np

categories = ['A', 'B', 'C', 'D']
values = [1500, 3000, 4500, 1000]
percentages = [15, 30, 45, 10]

fig, ax = plt.subplots(figsize=(12, 7))
bars = ax.bar(categories, values)

for i, bar in enumerate(bars):
    height = bar.get_height()
    ax.text(bar.get_x() + bar.get_width()/2, height,
            f'${height:,}', ha='center', va='bottom',
            fontweight='bold')
    ax.text(bar.get_x() + bar.get_width()/2, height/2,
            f'{percentages[i]}%', ha='center', va='center',
            color='white', fontweight='bold')

plt.title('How to Annotate Bars in Barplot with Matplotlib - Multiple Annotations per Bar', fontsize=16)
plt.xlabel('Categories', fontsize=14)
plt.ylabel('Values', fontsize=14)
plt.suptitle('Visit how2matplotlib.com for more examples', fontsize=10)
plt.show()
Output:
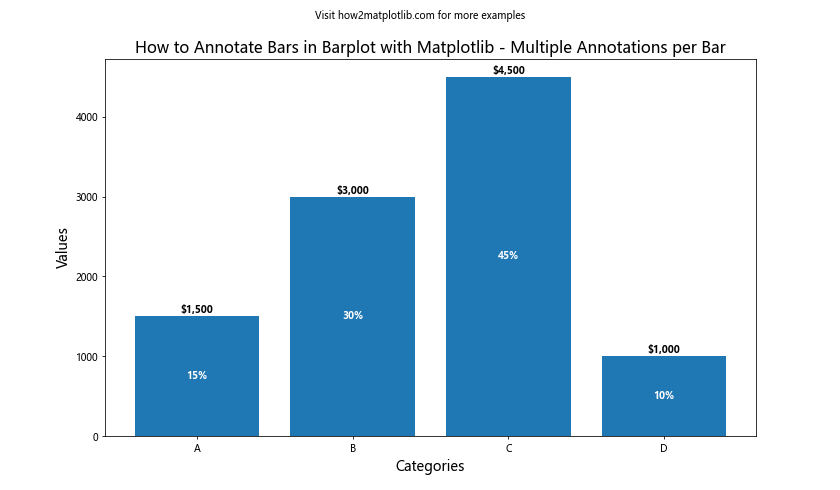
In this example, we add two annotations to each bar: one showing the absolute value at the top of the bar, and another showing the percentage in the middle of the bar.
Using Matplotlib's Annotation Features for Complex Annotations
Matplotlib provides advanced annotation features that allow for more complex and customizable annotations. Here's an example of how to annotate bars in barplot with Matplotlib using some of these advanced features:
import matplotlib.pyplot as plt
import numpy as np

categories = ['Product A', 'Product B', 'Product C', 'Product D']
values = [1500, 3000, 4500, 1000]

fig, ax = plt.subplots(figsize=(12, 7))
bars = ax.bar(categories, values)

for i, bar in enumerate(bars):
    height = bar.get_height()
    ax.annotate(f'${height:,}',
                xy=(bar.get_x() + bar.get_width() / 2, height),
                xytext=(0, 3),  # 3 points vertical offset
                textcoords="offset points",
                ha='center', va='bottom',
                bbox=dict(boxstyle="round,pad=0.3", fc="yellow", ec="b", lw=2),
                arrowprops=dict(arrowstyle="->", connectionstyle="arc3,rad=0.2"))

plt.title('How to Annotate Bars in Barplot with Matplotlib - Complex Annotations', fontsize=16)
plt.xlabel('Products', fontsize=14)
plt.ylabel('Sales ($)', fontsize=14)
plt.suptitle('Visit how2matplotlib.com for more examples', fontsize=10)
plt.show()
Output:
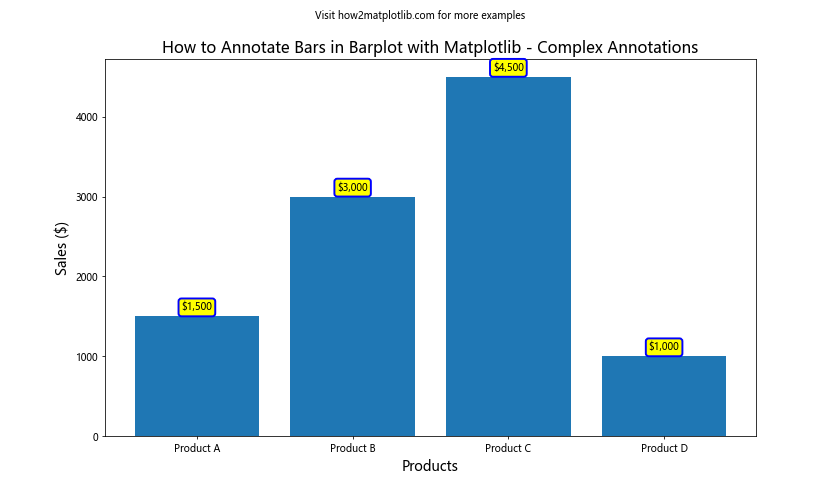
In this example, we use ax.annotate() with additional parameters to create more complex annotations. We add a background box to the text and use custom arrow styles to connect the annotation to the bar.
Annotating Subplots in Matplotlib Bar Plots
When working with multiple subplots, you may need to annotate bars across different plots. Here's how to annotate bars in barplot with Matplotlib when using subplots:
import matplotlib.pyplot as plt
import numpy as np

categories = ['A', 'B', 'C', 'D']
values1 = [15, 30, 45, 10]
values2 = [20, 25, 35, 15]

fig, (ax1, ax2) = plt.subplots(1, 2, figsize=(15, 6))

bars1 = ax1.bar(categories, values1)
bars2 = ax2.bar(categories, values2)

def annotate_bars(ax, bars):
    for bar in bars:
        height = bar.get_height()
        ax.text(bar.get_x() + bar.get_width()/2, height,
                f'{height}', ha='center', va='bottom')

annotate_bars(ax1, bars1)
annotate_bars(ax2, bars2)

ax1.set_title('Subplot 1')
ax2.set_title('Subplot 2')

fig.suptitle('How to Annotate Bars in Barplot with Matplotlib - Subplots', fontsize=16)
plt.suptitle('Visit how2matplotlib.com for more examples', fontsize=10, y=0.05)
plt.show()
Output:
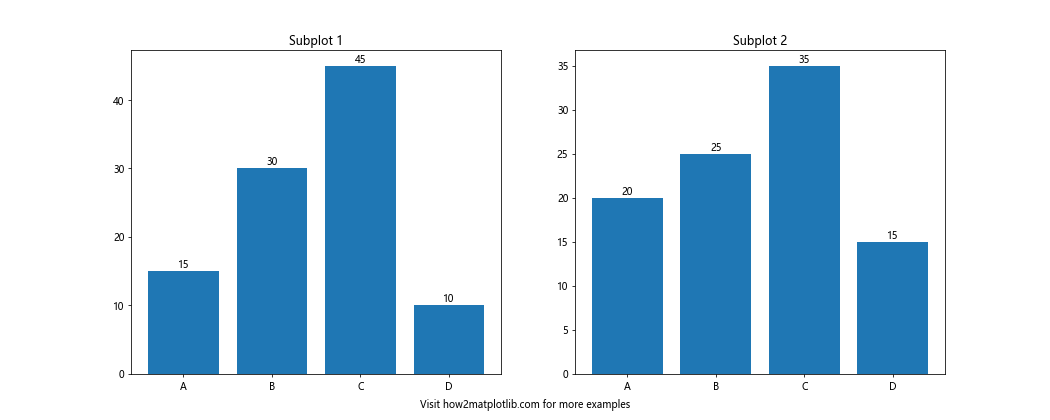
In this example, we create two subplots and define a function annotate_bars() to handle the annotation of bars in each subplot. This approach allows for consistent annotation across multiple plots.
Animating Bar Plot Annotations in Matplotlib
Adding animations to your bar plot annotations can create engaging and dynamic visualizations. Here's an example of how to annotate bars in barplot with Matplotlib using animation:
import matplotlib.pyplot as plt
import matplotlib.animation as animation
import numpy as np

categories = ['A', 'B', 'C', 'D']
values = [15, 30, 45, 10]

fig, ax = plt.subplots(figsize=(10, 6))
bars = ax.bar(categories, values)

def animate(frame):
    for bar in bars:
        bar.set_height(bar.get_height() + np.random.randint(-5, 6))

    ax.clear()
    new_bars = ax.bar(categories, [bar.get_height() for bar in bars])

    for bar in new_bars:
        height = bar.get_height()
        ax.text(bar.get_x() + bar.get_width()/2, height,
                f'{height:.0f}', ha='center', va='bottom')

    ax.set_ylim(0, 60)
    ax.set_title('How to Annotate Bars in Barplot with Matplotlib - Animated')
    ax.set_xlabel('Categories')
    ax.set_ylabel('Values')

ani = animation.FuncAnimation(fig, animate, frames=50, interval=200, repeat=False)

plt.suptitle('Visit how2matplotlib.com for more examples', fontsize=10)
plt.show()
Output:
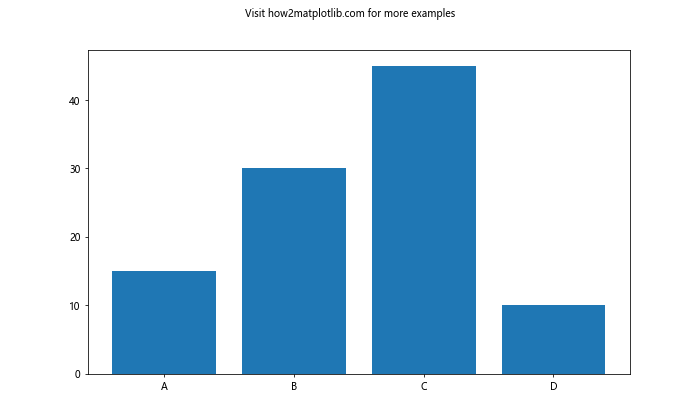
In this example, we create an animation that randomly adjusts the height of each bar and updates the annotations accordingly. The animation.FuncAnimation() function is used to create the animation.
Best Practices for Annotating Bar Plots in Matplotlib
When learning how to annotate bars in barplot with Matplotlib, it's important to keep in mind some best practices to ensure your visualizations are clear and effective:
- Keep annotations concise: Use short, informative text that doesn't clutter the plot.
- Choose appropriate font sizes: Ensure that annotations are readable but not overpowering.
- Use color strategically: Color-code annotations to convey additional information or highlight important data points.
- Avoid overlapping: Adjust the position of annotations to prevent overlapping with bars or other elements.
- Maintain consistency: Use a consistent style for annotations throughout your visualization.
- Consider the data range: Adjust annotation positions based on the range of your data to ensure visibility.
- Use appropriate decimal places: Round numbers in annotations to a reasonable number of decimal places for readability.
- Leverage white space: Use the available space in your plot effectively to place annotations.
- Combine with other chart elements: Use annotations in conjunction with legends, titles, and axis labels for a comprehensive visualization.
- Test for readability: Always check your annotated plot for readability, especially when dealing with large datasets.
Troubleshooting Common Issues When Annotating Bar Plots in Matplotlib
When working on how to annotate bars in barplot with Matplotlib, you may encounter some common issues. Here are some problems and their solutions:
- Overlapping annotations:
- Adjust the position of annotations using offsets.
- Use smaller font sizes or abbreviate text.
- Rotate text annotations to save space.
- Annotations outside plot area:
- Set appropriate axis limits using
ax.set_ylim()orax.set_xlim(). - Use
plt.tight_layout()to adjust subplot parameters.
- Set appropriate axis limits using
- Inconsistent annotation positions:
- Create a custom function to calculate annotation positions consistently.
- Use relative positioning instead of absolute coordinates.
- Poor contrast between annotations and background:
- Add a background box to text annotations using the
bboxparameter. - Adjust text color to ensure readability against the bar color.
- Add a background box to text annotations using the
- Difficulty in annotating stacked or grouped bars:
- Create separate loops for each group or stack level.
- Calculate cumulative heights for proper positioning in stacked bars.
- Annotations not updating with data changes:
- Implement a function to update annotations when data changes.
- Use Matplotlib's event handling to trigger annotation updates.
- Performance issues with large datasets:
- Limit annotations to key data points rather than annotating every bar.
- Use more efficient Matplotlib methods like
ax.annotate()for large datasets.
- Difficulty in aligning annotations:
- Use the
ha(horizontal alignment) andva(vertical alignment) parameters in text functions. - Experiment with different alignment options to find the best fit.
- Use the
- Annotations cut off in saved figures:
- Adjust figure size using
fig.set_size_inches(). - Increase DPI when saving figures:
plt.savefig('filename.png', dpi=300).
- Adjust figure size using
- Inconsistent font styles:
- Set a global font style using
plt.rcParams['font.family'] = 'sans-serif'. - Specify font properties consistently across all annotations.
- Set a global font style using
Advanced Techniques for Bar Plot Annotations in Matplotlib
For those looking to take their skills in how to annotate bars in barplot with Matplotlib to the next level, here are some advanced techniques:
- Dynamic annotation positioning:
import matplotlib.pyplot as plt
import numpy as np

categories = ['A', 'B', 'C', 'D', 'E']
values = [15, 30, 45, 10, 25]

fig, ax = plt.subplots(figsize=(10, 6))
bars = ax.bar(categories, values)

def smart_annotate(ax, bars):
    y_max = ax.get_ylim()[1]
    for bar in bars:
        height = bar.get_height()
        if height / y_max < 0.15:
            va = 'bottom'
            y = height + 0.01 * y_max
        else:
            va = 'top'
            y = height - 0.01 * y_max
        ax.text(bar.get_x() + bar.get_width()/2, y,
                f'{height}', ha='center', va=va)

smart_annotate(ax, bars)

plt.title('How to Annotate Bars in Barplot with Matplotlib - Dynamic Positioning')
plt.xlabel('Categories')
plt.ylabel('Values')
plt.suptitle('Visit how2matplotlib.com for more examples', fontsize=10)
plt.show()
Output:
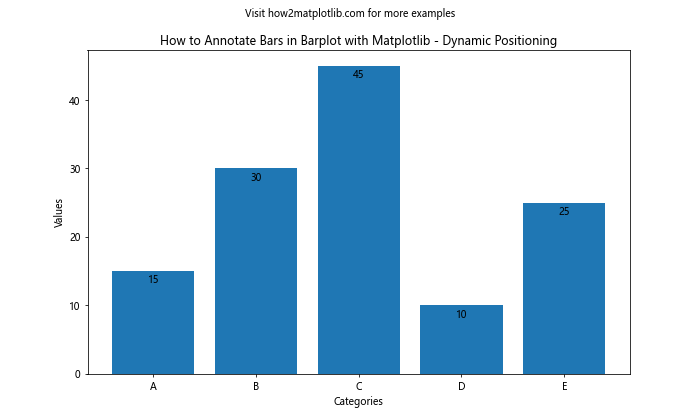
This example demonstrates a smart annotation function that adjusts the position of annotations based on the bar height relative to the plot's y-axis limits.
- Annotating with data from external sources:
import matplotlib.pyplot as plt
import numpy as np
import pandas as pd

# Simulating data from an external source
df = pd.DataFrame({
    'Category': ['A', 'B', 'C', 'D'],
    'Value': [15, 30, 45, 10],
    'Trend': ['↑', '↓', '↑', '→'],
    'Change': ['+5%', '-2%', '+10%', '0%']
})

fig, ax = plt.subplots(figsize=(12, 7))
bars = ax.bar(df['Category'], df['Value'])

for i, bar in enumerate(bars):
    height = bar.get_height()
    ax.text(bar.get_x() + bar.get_width()/2, height,
            f"{height}\n{df['Trend'][i]} {df['Change'][i]}",
            ha='center', va='bottom', fontweight='bold')

plt.title('How to Annotate Bars in Barplot with Matplotlib - External Data Annotations', fontsize=16)
plt.xlabel('Categories', fontsize=14)
plt.ylabel('Values', fontsize=14)
plt.suptitle('Visit how2matplotlib.com for more examples', fontsize=10)
plt.show()
Output:
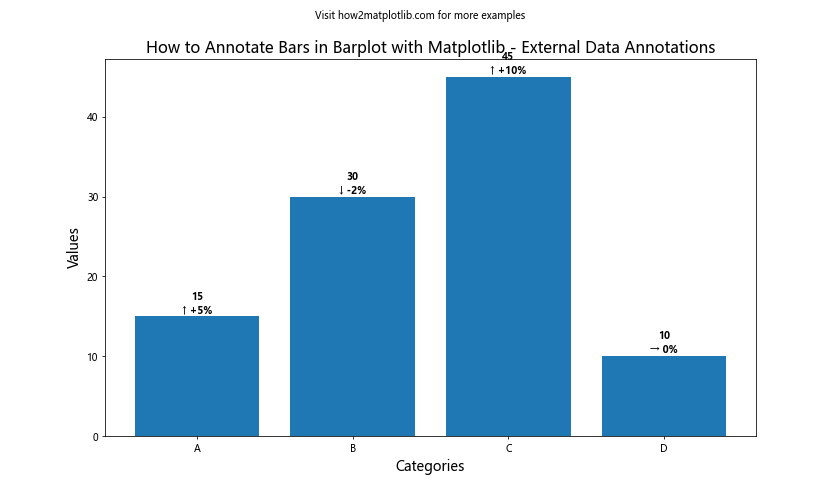
This example shows how to incorporate data from an external source (in this case, a pandas DataFrame) into your bar plot annotations.
- Interactive annotations with mouse-over events:
import matplotlib.pyplot as plt
import numpy as np
from matplotlib.backends.backend_tkagg import FigureCanvasTkAgg
import tkinter as tk

categories = ['A', 'B', 'C', 'D']
values = [15, 30, 45, 10]

fig, ax = plt.subplots(figsize=(10, 6))
bars = ax.bar(categories, values)

annotation = ax.annotate("", xy=(0,0), xytext=(20,20),textcoords="offset points",
                         bbox=dict(boxstyle="round", fc="w"),
                         arrowprops=dict(arrowstyle="->"))
annotation.set_visible(False)

def update_annotation(event):
    for bar in bars:
        if bar.contains(event)[0]:
            height = bar.get_height()
            pos = bar.get_xy()
            annotation.xy = (pos[0] + bar.get_width()/2, height)
            annotation.set_text(f"Value: {height}")
            annotation.set_visible(True)
            fig.canvas.draw_idle()
            return
    annotation.set_visible(False)
    fig.canvas.draw_idle()

fig.canvas.mpl_connect("motion_notify_event", update_annotation)

plt.title('How to Annotate Bars in Barplot with Matplotlib - Interactive Annotations')
plt.xlabel('Categories')
plt.ylabel('Values')
plt.suptitle('Visit how2matplotlib.com for more examples', fontsize=10)

root = tk.Tk()
canvas = FigureCanvasTkAgg(fig, master=root)
canvas.draw()
canvas.get_tk_widget().pack()

root.mainloop()
This advanced example demonstrates how to create interactive annotations that appear when the mouse hovers over a bar. It uses Tkinter for the GUI, but you can adapt this to other GUI frameworks or Jupyter notebooks.
Conclusion: Mastering Bar Plot Annotations in Matplotlib
Throughout this comprehensive guide on how to annotate bars in barplot with Matplotlib, we've explored a wide range of techniques and best practices. From basic text annotations to complex, interactive visualizations, Matplotlib offers a versatile toolkit for enhancing your bar plots with informative and visually appealing annotations.
Key takeaways from this guide include:
- Understanding the basics of bar plot annotations in Matplotlib
- Customizing text annotations for clarity and style
- Using percentage annotations to represent proportions
- Implementing arrow annotations to highlight specific data points
- Annotating stacked and grouped bar plots effectively
- Adding horizontal line annotations for reference points
- Utilizing color-coded annotations to convey additional information
- Incorporating custom shapes and annotation boxes for emphasis
- Adapting annotation techniques for horizontal bar plots
- Adding multiple annotations to individual bars
- Leveraging Matplotlib's advanced annotation features
- Annotating subplots consistently
- Creating animated bar plot annotations for dynamic visualizations
- Following best practices for clear and effective annotations
- Troubleshooting common issues in bar plot annotations
- Exploring advanced techniques like dynamic positioning and interactive annotations
By mastering these techniques, you'll be well-equipped to create informative, visually appealing, and professional-looking bar plots that effectively communicate your data insights. Remember to always consider your audience and the specific requirements of your visualization when choosing annotation styles and techniques.