Matplotlib 2D Histogram
Matplotlib is a powerful data visualization library in Python, and one of its many capabilities is creating 2D histograms. A 2D histogram, also known as a bivariate histogram, is a graphical representation of the joint distribution of two variables. It’s an extension of the regular histogram to two dimensions, allowing us to visualize the frequency or density of data points in a two-dimensional space.
In this comprehensive guide, we’ll explore the various aspects of creating and customizing 2D histograms using Matplotlib. We’ll cover everything from basic usage to advanced techniques, providing detailed explanations and numerous code examples along the way.
1. Basic 2D Histogram
Let’s start with the basics of creating a 2D histogram using Matplotlib. The primary function we’ll use is plt.hist2d(), which takes two arrays of data as input and creates a 2D histogram.
Here’s a simple example:
import numpy as np
import matplotlib.pyplot as plt

# Generate random data
np.random.seed(42)
x = np.random.normal(0, 1, 1000)
y = np.random.normal(0, 1, 1000)

# Create the 2D histogram
plt.figure(figsize=(10, 8))
plt.hist2d(x, y, bins=30, cmap='viridis')
plt.colorbar(label='Count')
plt.xlabel('X-axis - how2matplotlib.com')
plt.ylabel('Y-axis - how2matplotlib.com')
plt.title('Basic 2D Histogram - how2matplotlib.com')
plt.show()

# Print some information
print("2D Histogram created with {} data points".format(len(x)))
print("Using {} bins".format(30))
Output:
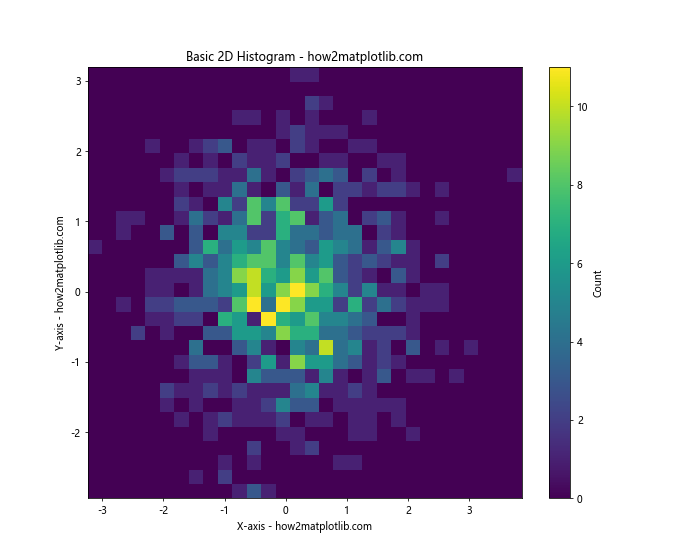
In this example, we first generate random data using NumPy’s normal distribution. We then use plt.hist2d() to create the 2D histogram. The bins parameter determines the number of bins in each dimension. We also add a colorbar to show the count scale, and label the axes and title.
The cmap parameter sets the color scheme for the histogram. In this case, we’re using ‘viridis’, which is a perceptually uniform colormap that works well for many types of data.
2. Customizing Bin Sizes and Ranges
One of the key aspects of creating an effective 2D histogram is choosing appropriate bin sizes and ranges. Matplotlib allows us to customize these parameters easily.
Here’s an example that demonstrates how to set custom bin edges:
import numpy as np
import matplotlib.pyplot as plt

# Generate random data
np.random.seed(42)
x = np.random.exponential(1, 1000)
y = np.random.normal(0, 1, 1000)

# Define custom bin edges
x_bins = np.linspace(0, 5, 20)
y_bins = np.linspace(-3, 3, 30)

# Create the 2D histogram with custom bins
plt.figure(figsize=(10, 8))
hist, x_edges, y_edges, im = plt.hist2d(x, y, bins=[x_bins, y_bins], cmap='plasma')
plt.colorbar(label='Count')
plt.xlabel('X-axis (Exponential) - how2matplotlib.com')
plt.ylabel('Y-axis (Normal) - how2matplotlib.com')
plt.title('2D Histogram with Custom Bins - how2matplotlib.com')
plt.show()

# Print information about the bins
print("X-axis bins: {}".format(len(x_bins)-1))
print("Y-axis bins: {}".format(len(y_bins)-1))
print("Total number of bins: {}".format((len(x_bins)-1) * (len(y_bins)-1)))
Output:
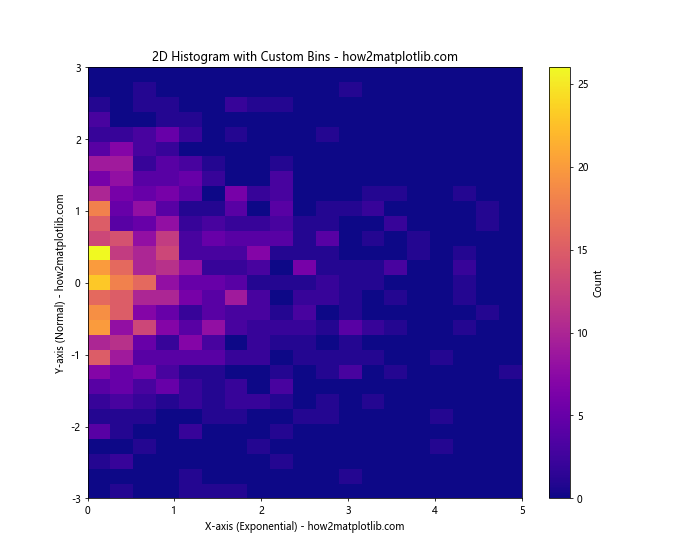
In this example, we’re using different distributions for x and y (exponential and normal, respectively) to create more interesting data. We define custom bin edges using np.linspace() for both x and y axes. This allows us to have different numbers of bins and different ranges for each axis.
The hist2d() function returns several values, including the 2D array of the histogram itself (hist) and the bin edges for both axes (x_edges and y_edges). We can use these for further analysis if needed.
3. Normalizing the Histogram
By default, hist2d() shows the count of data points in each bin. However, sometimes it’s more useful to show the probability density. We can achieve this by normalizing the histogram.
Here’s an example of a normalized 2D histogram:
import numpy as np
import matplotlib.pyplot as plt

# Generate random data
np.random.seed(42)
x = np.random.normal(0, 1, 10000)
y = x + np.random.normal(0, 0.5, 10000)

# Create the normalized 2D histogram
plt.figure(figsize=(10, 8))
hist, x_edges, y_edges, im = plt.hist2d(x, y, bins=50, density=True, cmap='YlOrRd')
plt.colorbar(label='Probability Density')
plt.xlabel('X-axis - how2matplotlib.com')
plt.ylabel('Y-axis - how2matplotlib.com')
plt.title('Normalized 2D Histogram - how2matplotlib.com')
plt.show()

# Print the total of all bin values
print("Sum of all bin values: {:.6f}".format(np.sum(hist)))
print("This should be close to 1 for a normalized histogram")
Output:
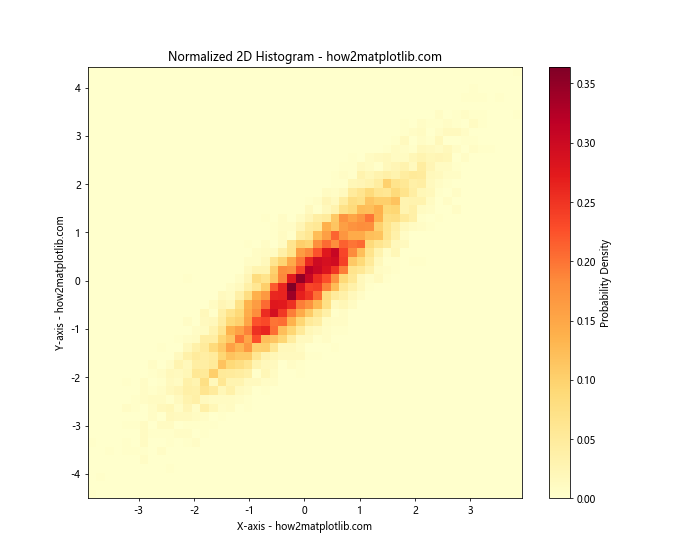
In this example, we set density=True in the hist2d() function to normalize the histogram. This ensures that the integral of the histogram will sum to 1, effectively converting the counts to probability densities.
Note that we’ve also increased the number of data points to 10,000 and created a correlation between x and y by setting y = x + np.random.normal(0, 0.5, 10000). This creates a more interesting distribution to visualize.
4. Using Different Color Scales
The choice of color scale can greatly affect how your 2D histogram is perceived. Matplotlib offers a wide range of colormaps that can be used for different types of data and purposes.
Here’s an example showcasing different color scales:
import numpy as np
import matplotlib.pyplot as plt

# Generate random data
np.random.seed(42)
x = np.random.gamma(2, 2, 1000)
y = np.random.gamma(3, 2, 1000)

# Create a figure with multiple subplots
fig, axs = plt.subplots(2, 2, figsize=(16, 16))
cmaps = ['viridis', 'plasma', 'inferno', 'magma']

for ax, cmap in zip(axs.flat, cmaps):
    hist, x_edges, y_edges, im = ax.hist2d(x, y, bins=30, cmap=cmap)
    fig.colorbar(im, ax=ax, label='Count')
    ax.set_title(f'2D Histogram with {cmap} colormap - how2matplotlib.com')
    ax.set_xlabel('X-axis - how2matplotlib.com')
    ax.set_ylabel('Y-axis - how2matplotlib.com')

plt.tight_layout()
plt.show()

# Print information about the colormaps
for cmap in cmaps:
    print(f"Used colormap: {cmap}")
Output:
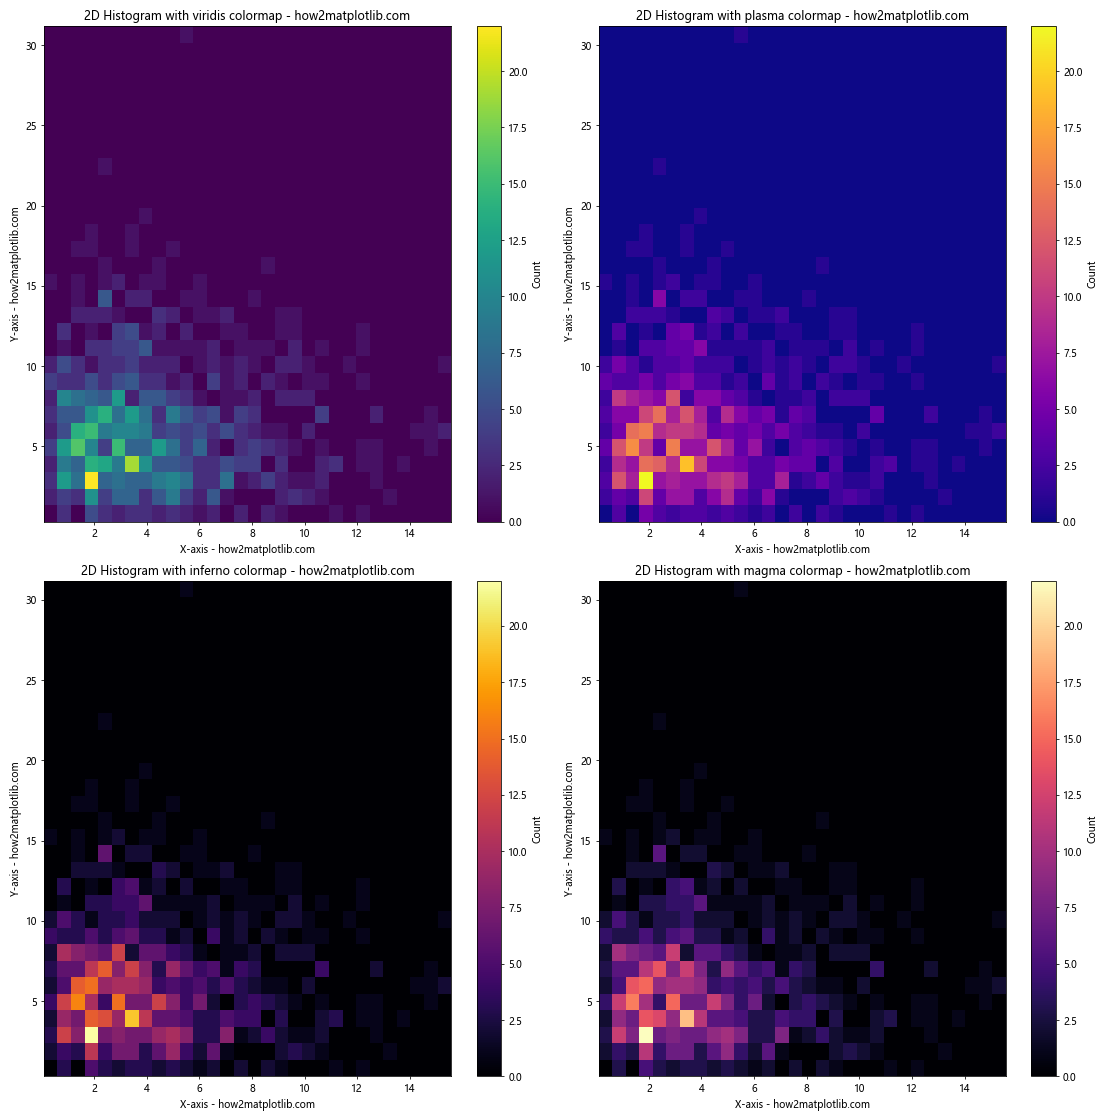
In this example, we create four subplots, each using a different colormap from the ‘perceptually uniform’ family of colormaps. These colormaps are designed to be perceived as having equal steps in brightness across their range, which makes them suitable for many types of data.
We use plt.subplots() to create a 2×2 grid of subplots, and then iterate over them to create a 2D histogram in each, using a different colormap for each subplot.
5. Adding a Logarithmic Color Scale
When dealing with data that spans several orders of magnitude, a logarithmic color scale can be more effective than a linear one. Matplotlib allows us to easily apply a logarithmic scale to our 2D histograms.
Here’s an example:
import numpy as np
import matplotlib.pyplot as plt
from matplotlib.colors import LogNorm

# Generate random data with a wide range of values
np.random.seed(42)
x = np.random.lognormal(0, 1, 10000)
y = np.random.lognormal(0, 1, 10000)

# Create the 2D histogram with a logarithmic color scale
plt.figure(figsize=(12, 10))
hist, x_edges, y_edges, im = plt.hist2d(x, y, bins=50, norm=LogNorm(), cmap='viridis')
plt.colorbar(label='Count (log scale)')
plt.xlabel('X-axis (log scale) - how2matplotlib.com')
plt.ylabel('Y-axis (log scale) - how2matplotlib.com')
plt.xscale('log')
plt.yscale('log')
plt.title('2D Histogram with Logarithmic Scales - how2matplotlib.com')
plt.show()

# Print range of data and counts
print("X range: {:.2e} to {:.2e}".format(x.min(), x.max()))
print("Y range: {:.2e} to {:.2e}".format(y.min(), y.max()))
print("Count range: {} to {}".format(hist.min(), hist.max()))
Output:
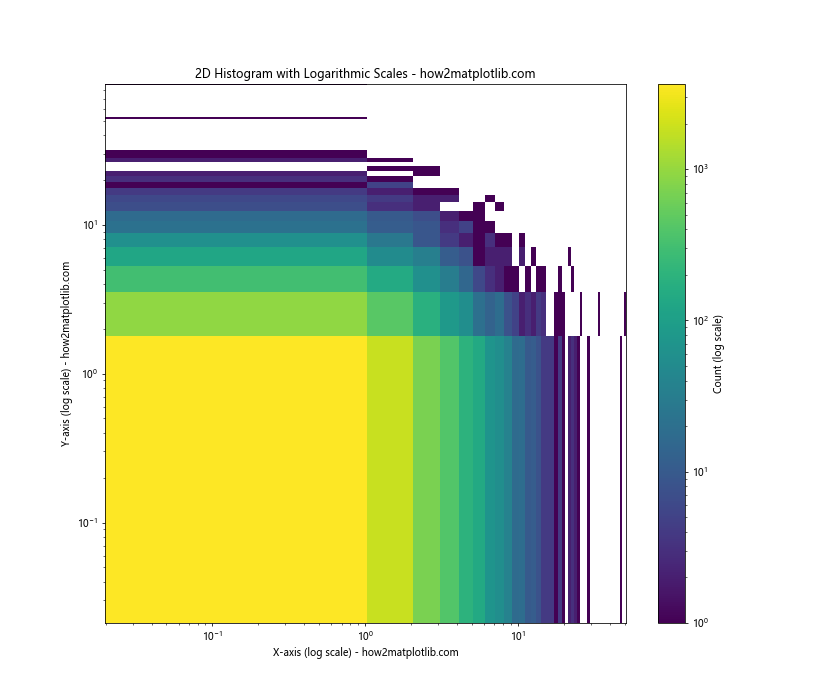
In this example, we use np.random.lognormal() to generate data that spans several orders of magnitude. We then use LogNorm() in the hist2d() function to apply a logarithmic color scale.
We also set the x and y axes to logarithmic scales using plt.xscale('log') and plt.yscale('log'). This ensures that the bin sizes are logarithmically spaced, which is appropriate for this type of data.
6. Hexbin Plots
An alternative to the rectangular bins of hist2d() is the hexagonal binning provided by plt.hexbin(). Hexagonal bins can provide a more aesthetically pleasing visualization and can be particularly useful for certain types of data.
Here’s an example of a hexbin plot:
import numpy as np
import matplotlib.pyplot as plt

# Generate random data
np.random.seed(42)
x = np.random.standard_cauchy(10000)
y = np.random.standard_cauchy(10000)

# Create the hexbin plot
plt.figure(figsize=(12, 10))
hb = plt.hexbin(x, y, gridsize=30, cmap='YlOrRd', extent=[-5, 5, -5, 5])
plt.colorbar(hb, label='Count')
plt.xlabel('X-axis - how2matplotlib.com')
plt.ylabel('Y-axis - how2matplotlib.com')
plt.title('Hexbin Plot - how2matplotlib.com')
plt.show()

# Print information about the hexbin plot
print("Number of hexagonal bins: {}".format(len(hb.get_array())))
print("Maximum count in a single bin: {}".format(hb.get_array().max()))
Output:
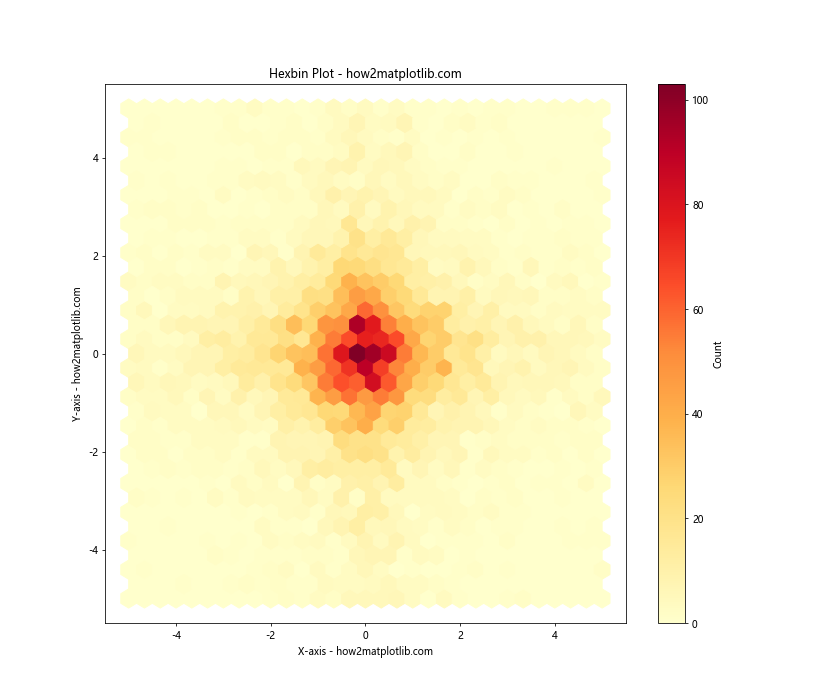
In this example, we use plt.hexbin() to create a hexagonal bin plot. The gridsize parameter determines the number of hexagons along each axis. We use the extent parameter to set the limits of the plot, as the Cauchy distribution can produce extreme outliers.
Hexbin plots are particularly useful for large datasets, as they can provide a clearer visualization of the data density compared to scatter plots or regular 2D histograms.
7. Contour Plots
Another way to visualize 2D histogram data is through contour plots. Contour plots show lines of constant density, which can be useful for identifying clusters or patterns in the data.
Here’s an example of combining a 2D histogram with a contour plot:
import numpy as np
import matplotlib.pyplot as plt

# Generate random data
np.random.seed(42)
x = np.random.multivariate_normal([0, 0], [[1, 0.5], [0.5, 1]], 10000)

# Create the 2D histogram and contour plot
plt.figure(figsize=(12, 10))
hist, x_edges, y_edges = np.histogram2d(x[:, 0], x[:, 1], bins=50)
extent = [x_edges[0], x_edges[-1], y_edges[0], y_edges[-1]]

plt.imshow(hist.T, extent=extent, origin='lower', cmap='viridis')
plt.colorbar(label='Count')
cs = plt.contour(hist.T, extent=extent, colors='white', alpha=0.5)
plt.clabel(cs, inline=True, fontsize=10)

plt.xlabel('X-axis - how2matplotlib.com')
plt.ylabel('Y-axis - how2matplotlib.com')
plt.title('2D Histogram with Contour Lines - how2matplotlib.com')
plt.show()

# Print information about the contour levels
print("Contour levels: {}".format(cs.levels))
Output:
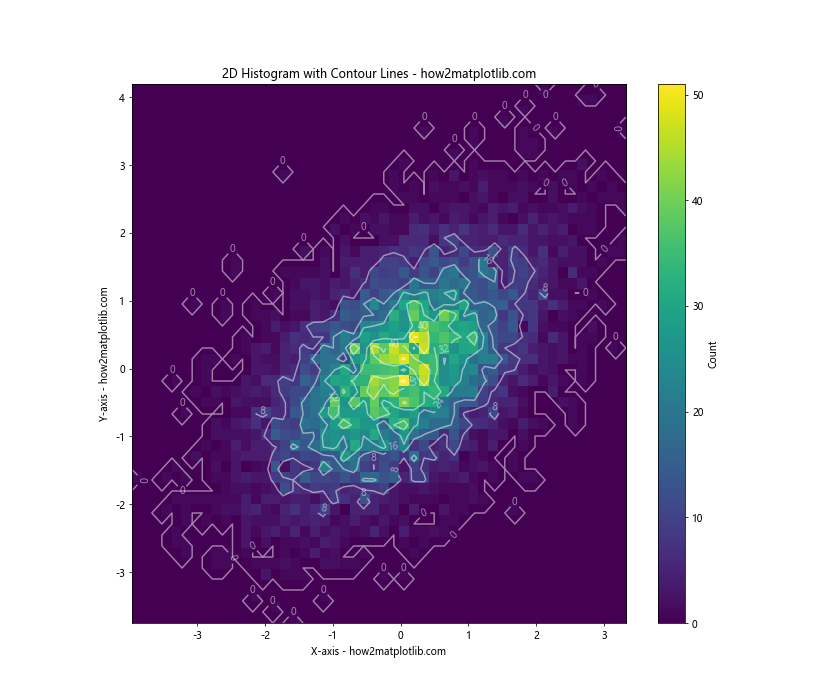
In this example, we first create a 2D histogram using np.histogram2d(). We then use plt.imshow() to display the histogram as an image, and plt.contour() to add contour lines on top.
The plt.clabel() function adds labels to the contour lines, showing the count value for each contour. This can be particularly useful for quantitative analysis of the data distribution.
8. 3D Surface Plot of 2D Histogram
While we’re focusing on 2D histograms, it’s worth noting that we can also visualize this data in 3D. A 3D surface plot can provide an intuitive view of the data distribution.
Here’s an example:
import numpy as np
import matplotlib.pyplot as plt
from mpl_toolkits.mplot3d import Axes3D

# Generate random data
np.random.seed(42)
x = np.random.normal(0, 1, 10000)
y = x + np.random.normal(0, 1, 10000)

# Create the 2D histogram
hist, x_edges, y_edges = np.histogram2d(x, y, bins=50)
x_centers = (x_edges[:-1] + x_edges[1:]) / 2
y_centers = (y_edges[:-1] + y_edges[1:]) / 2
X, Y = np.meshgrid(x_centers, y_centers)

# Create the 3D surface plot
fig = plt.figure(figsize=(12, 10))
ax = fig.add_subplot(111, projection='3d')
surf = ax.plot_surface(X, Y, hist.T, cmap='viridis')
fig.colorbar(surf, label='Count')

ax.set_xlabel('X-axis - how2matplotlib.com')
ax.set_ylabel('Y-axis - how2matplotlib.com')
ax.set_zlabel('Count - how2matplotlib.com')
ax.set_title('3D Surface Plot of 2D Histogram - how2matplotlib.com')
plt.show()

# Print maximum count
print("Maximum count in a single bin: {}".format(hist.max()))
Output:
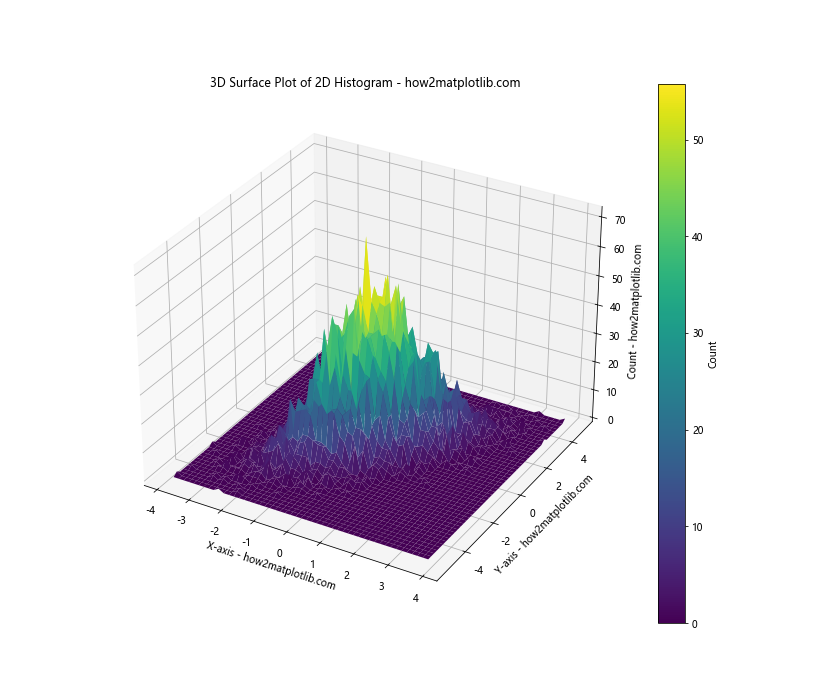
In this example, we first create a 2D histogram using np.histogram2d(). We then use np.meshgrid() to create 2D grids of x and y coordinates.
The plot_surface() function from Matplotlib’s 3D toolkit is used to create the surface plot. This gives us a 3D visualization of the 2D histogram, where the height of the surface represents the count in each bin.
9. Marginal Histograms
Sometimes it’s useful to show the marginal distributions along with the 2D histogram. This can be achieved by adding 1D histograms along the edges of the 2D histogram.
Here’s an example of how to create a 2D histogram with marginal histograms:
import numpy as np
import matplotlib.pyplot as plt

# Generate random data
np.random.seed(42)
x = np.random.gamma(2, 2, 10000)
y = np.random.normal(4, 2, 10000)

# Create the main figure and axes
fig = plt.figure(figsize=(12, 12))
gs = fig.add_gridspec(3, 3)
ax_main = fig.add_subplot(gs[1:, :-1])
ax_right = fig.add_subplot(gs[1:, -1], sharey=ax_main)
ax_top = fig.add_subplot(gs[0, :-1], sharex=ax_main)

# Create the 2D histogram
hist, x_edges, y_edges, im = ax_main.hist2d(x, y, bins=50, cmap='viridis')
fig.colorbar(im, ax=ax_main, label='Count')

# Create the marginal histograms
ax_top.hist(x, bins=50, color='skyblue')
ax_right.hist(y, bins=50, orientation='horizontal', color='skyblue')

# Remove ticks from marginal histograms
ax_top.tick_params(axis="x", labelbottom=False)
ax_right.tick_params(axis="y", labelleft=False)

# Set labels and title
ax_main.set_xlabel('X-axis - how2matplotlib.com')
ax_main.set_ylabel('Y-axis - how2matplotlib.com')
ax_main.set_title('2D Histogram with Marginal Histograms - how2matplotlib.com')

plt.tight_layout()
plt.show()

# Print correlation coefficient
print("Correlation coefficient: {:.4f}".format(np.corrcoef(x, y)[0, 1]))
Output:
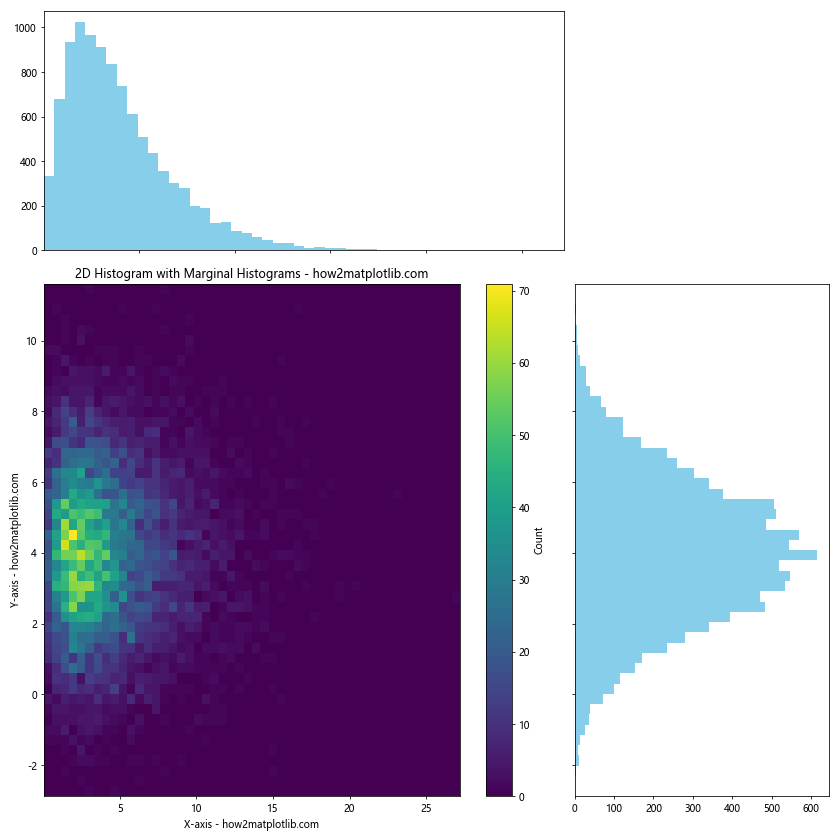
In this example, we use Matplotlib’s gridspec to create a layout with a main 2D histogram and two marginal 1D histograms. The main 2D histogram is created as before using hist2d().
For the marginal histograms, we use the regular hist() function. The top marginal histogram is created normally, while the right marginal histogram is created with orientation='horizontal' to align it with the y-axis of the main plot.
We use sharey and sharex when creating the axes to ensure that the scales align between the main plot and the marginal histograms.
10. Customizing Histogram Appearance
Matplotlib provides many options for customizing the appearance of 2D histograms. Let’s explore some of these options:
import numpy as np
import matplotlib.pyplot as plt

# Generate random data
np.random.seed(42)
x = np.random.normal(0, 1, 10000)
y = x + np.random.normal(0, 1, 10000)

# Create the 2D histogram with customizations
plt.figure(figsize=(12, 10))
hist, x_edges, y_edges, im = plt.hist2d(x, y, bins=50, cmap='coolwarm',
                                        vmin=0, vmax=100, edgecolors='black', linewidths=0.5)

# Add a colorbar and customize it
cbar = plt.colorbar(label='Count')
cbar.ax.tick_params(labelsize=10)

# Customize axes
plt.xlabel('X-axis - how2matplotlib.com', fontsize=12)
plt.ylabel('Y-axis - how2matplotlib.com', fontsize=12)
plt.title('Customized 2D Histogram - how2matplotlib.com', fontsize=14, fontweight='bold')

# Add grid lines
plt.grid(color='gray', linestyle='--', linewidth=0.5, alpha=0.7)

# Adjust plot limits
plt.xlim(-4, 4)
plt.ylim(-4, 4)

plt.show()

# Print some statistics
print("Total count: {}".format(np.sum(hist)))
print("Mean x: {:.2f}".format(np.mean(x)))
print("Mean y: {:.2f}".format(np.mean(y)))
Output:
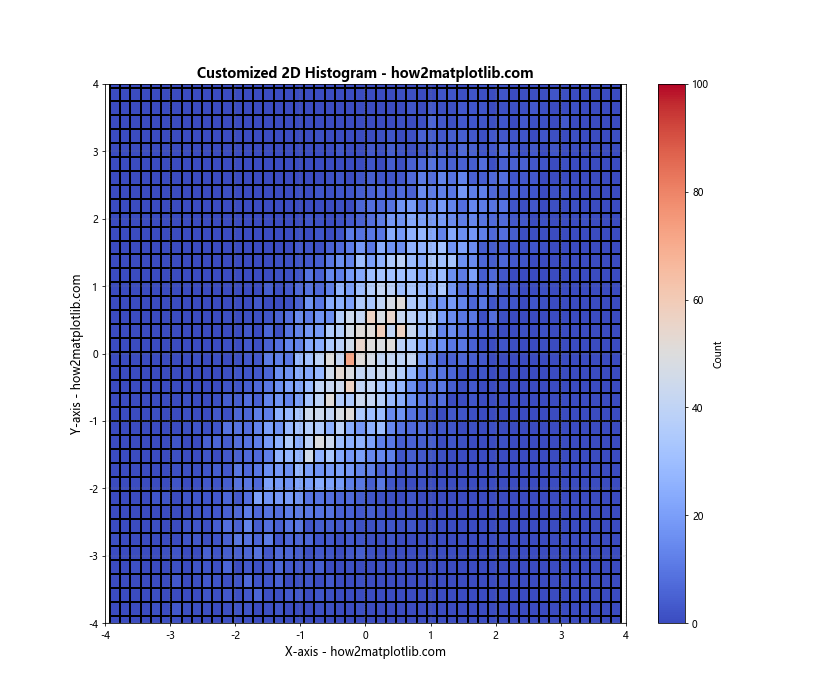
In this example, we’ve added several customizations:
- We use the ‘coolwarm’ colormap and set
vminandvmaxto control the color scale. - We add edge colors to the histogram bins with
edgecolorsandlinewidths. - We customize the colorbar label and tick label sizes.
- We adjust the font sizes for the axes labels and title, and make the title bold.
- We add grid lines to the plot.
- We set specific limits for the x and y axes.
These customizations can help make your 2D histogram more visually appealing and easier to interpret.
11. Handling Outliers
When dealing with real-world data, outliers can sometimes dominate the visualization and make it difficult to see the main distribution. Here’s an example of how to handle outliers in a 2D histogram:
import numpy as np
import matplotlib.pyplot as plt

# Generate random data with outliers
np.random.seed(42)
x = np.random.normal(0, 1, 10000)
y = np.random.normal(0, 1, 10000)
# Add some outliers
x = np.concatenate([x, np.random.uniform(10, 15, 50)])
y = np.concatenate([y, np.random.uniform(10, 15, 50)])

# Function to calculate percentile-based limits
def get_limits(data, lower_percentile, upper_percentile):
    return np.percentile(data, [lower_percentile, upper_percentile])

# Calculate limits
x_limits = get_limits(x, 1, 99)
y_limits = get_limits(y, 1, 99)

# Create the 2D histogram
plt.figure(figsize=(12, 10))
hist, x_edges, y_edges, im = plt.hist2d(x, y, bins=50, cmap='viridis',
                                        range=[x_limits, y_limits])

plt.colorbar(label='Count')
plt.xlabel('X-axis - how2matplotlib.com')
plt.ylabel('Y-axis - how2matplotlib.com')
plt.title('2D Histogram with Outlier Handling - how2matplotlib.com')

# Add text to show the percentage of data included
plt.text(0.05, 0.95, 'Showing central 98% of data',
         transform=plt.gca().transAxes, fontsize=10,
         verticalalignment='top')

plt.show()

# Print information about outliers
print("Total data points: {}".format(len(x)))
print("Data points within limits: {}".format(np.sum((x >= x_limits[0]) & (x <= x_limits[1]) &
                                                    (y >= y_limits[0]) & (y <= y_limits[1]))))
Output:
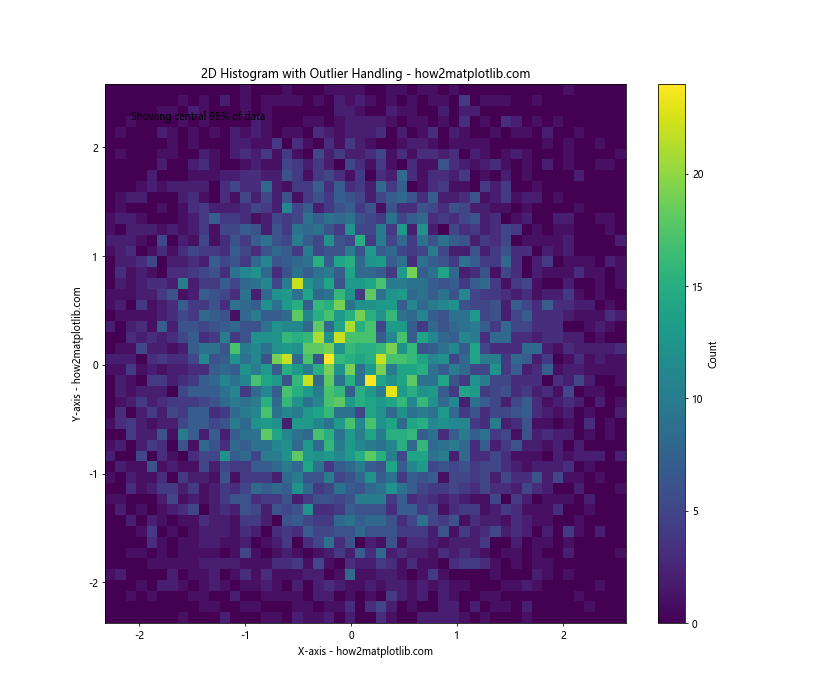
In this example, we first generate normal data and then add some outliers. We then define a function get_limits() that calculates percentile-based limits for the data.
We use these limits in the range parameter of hist2d() to focus on the central 98% of the data (from the 1st to 99th percentile). This effectively excludes the outliers from the visualization, allowing us to see the main distribution more clearly.
We also add a text annotation to the plot to indicate that we're showing the central 98% of the data.
12. Comparing Distributions
2D histograms can be useful for comparing distributions. Here's an example that compares two different 2D distributions side by side:
import numpy as np
import matplotlib.pyplot as plt

# Generate two sets of random data
np.random.seed(42)
x1 = np.random.normal(0, 1, 10000)
y1 = x1 + np.random.normal(0, 1, 10000)

x2 = np.random.exponential(1, 10000)
y2 = x2 + np.random.normal(0, 1, 10000)

# Create a figure with two subplots
fig, (ax1, ax2) = plt.subplots(1, 2, figsize=(20, 8))

# Create the first 2D histogram
hist1, x_edges, y_edges, im1 = ax1.hist2d(x1, y1, bins=50, cmap='viridis')
fig.colorbar(im1, ax=ax1, label='Count')
ax1.set_xlabel('X-axis - how2matplotlib.com')
ax1.set_ylabel('Y-axis - how2matplotlib.com')
ax1.set_title('Normal Distribution - how2matplotlib.com')

# Create the second 2D histogram
hist2, x_edges, y_edges, im2 = ax2.hist2d(x2, y2, bins=50, cmap='plasma')
fig.colorbar(im2, ax=ax2, label='Count')
ax2.set_xlabel('X-axis - how2matplotlib.com')
ax2.set_ylabel('Y-axis - how2matplotlib.com')
ax2.set_title('Exponential Distribution - how2matplotlib.com')

plt.tight_layout()
plt.show()

# Print some statistics for comparison
print("Normal Distribution:")
print("Mean x: {:.2f}, Mean y: {:.2f}".format(np.mean(x1), np.mean(y1)))
print("Std x: {:.2f}, Std y: {:.2f}".format(np.std(x1), np.std(y1)))
print("\nExponential Distribution:")
print("Mean x: {:.2f}, Mean y: {:.2f}".format(np.mean(x2), np.mean(y2)))
print("Std x: {:.2f}, Std y: {:.2f}".format(np.std(x2), np.std(y2)))
Output:
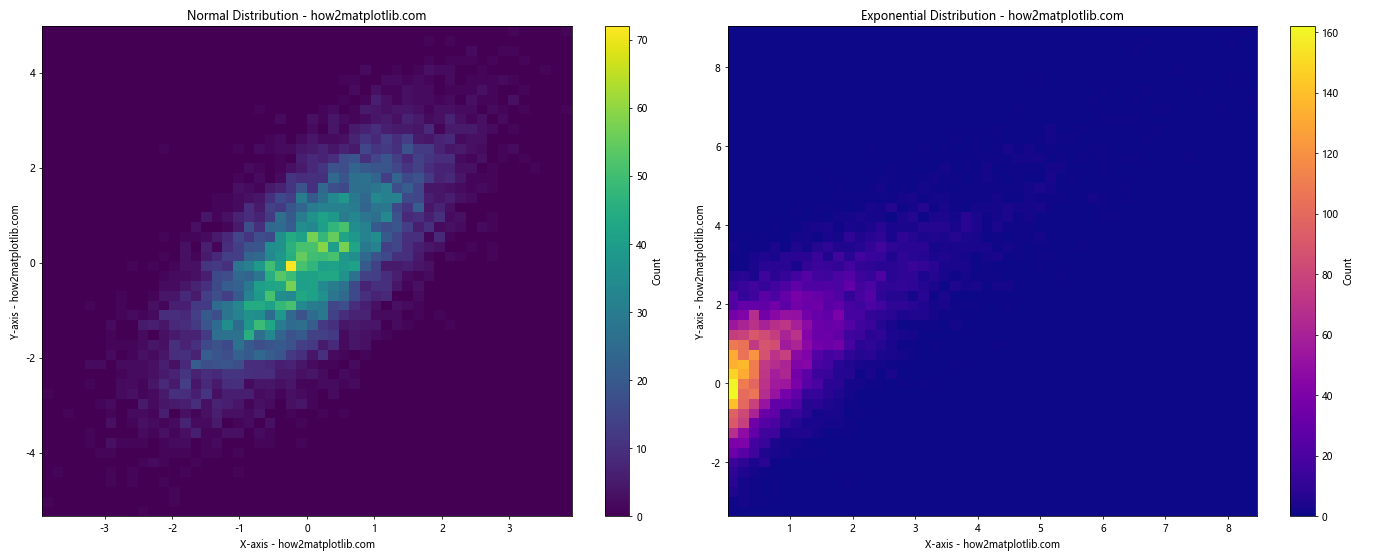
In this example, we create two different distributions: one based on normal distributions, and another based on an exponential distribution. We then create two subplots, each showing a 2D histogram of one of these distributions.
This side-by-side comparison allows us to easily see the differences between the two distributions. The normal distribution creates a roughly circular pattern, while the exponential distribution creates a more asymmetric pattern.
13. Kernel Density Estimation
While not strictly a histogram, Kernel Density Estimation (KDE) is a related technique that can provide a smoother representation of the data distribution. Here's an example of how to create a 2D KDE plot:
import numpy as np
import matplotlib.pyplot as plt
from scipy.stats import gaussian_kde

# Generate random data
np.random.seed(42)
x = np.random.normal(0, 1, 1000)
y = x + np.random.normal(0, 1, 1000)

# Perform KDE
xy = np.vstack([x,y])
z = gaussian_kde(xy)(xy)

# Sort the points by density
idx = z.argsort()
x, y, z = x[idx], y[idx], z[idx]

# Create the KDE plot
fig, ax = plt.subplots(figsize=(10, 8))
scatter = ax.scatter(x, y, c=z, s=50, cmap='viridis')
plt.colorbar(scatter, label='Density')

ax.set_xlabel('X-axis - how2matplotlib.com')
ax.set_ylabel('Y-axis - how2matplotlib.com')
ax.set_title('2D Kernel Density Estimation - how2matplotlib.com')

plt.show()

# Print some statistics
print("Number of data points: {}".format(len(x)))
print("Density range: {:.4f} to {:.4f}".format(z.min(), z.max()))
Output:
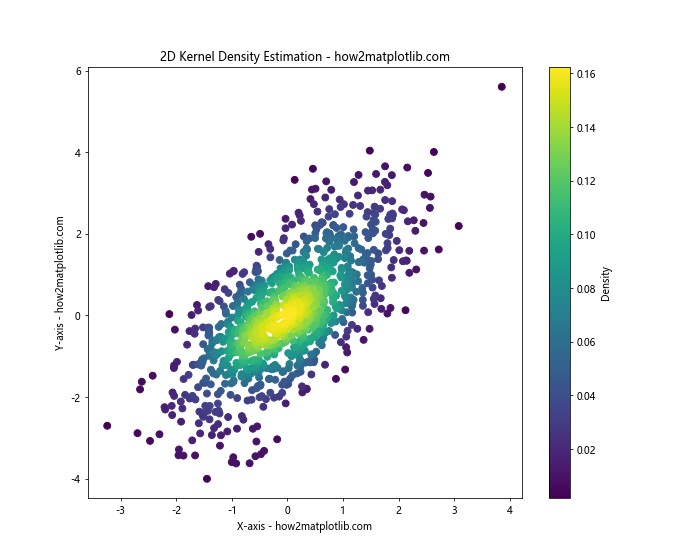
In this example, we use SciPy's gaussian_kde function to estimate the density of our 2D data. We then create a scatter plot where each point is colored according to its estimated density.
This approach can provide a smoother representation of the data distribution compared to a traditional histogram, especially for smaller datasets.
14. Combining 2D Histogram with Scatter Plot
Sometimes it's useful to combine a 2D histogram with a scatter plot of the original data points. This can give you both an overview of the distribution and a view of individual data points:
import numpy as np
import matplotlib.pyplot as plt

# Generate random data
np.random.seed(42)
x = np.random.normal(0, 1, 5000)
y = x + np.random.normal(0, 1, 5000)

# Create the figure and axis
fig, ax = plt.subplots(figsize=(12, 10))

# Create the 2D histogram
hist, x_edges, y_edges, im = ax.hist2d(x, y, bins=50, cmap='YlOrRd', alpha=0.7)
plt.colorbar(im, label='Count')

# Overlay scatter plot
ax.scatter(x, y, color='blue', alpha=0.1, s=1)

ax.set_xlabel('X-axis - how2matplotlib.com')
ax.set_ylabel('Y-axis - how2matplotlib.com')
ax.set_title('2D Histogram with Scatter Plot Overlay - how2matplotlib.com')

plt.show()

# Print some statistics
print("Total number of points: {}".format(len(x)))
print("Maximum count in a single bin: {}".format(hist.max()))
Output:
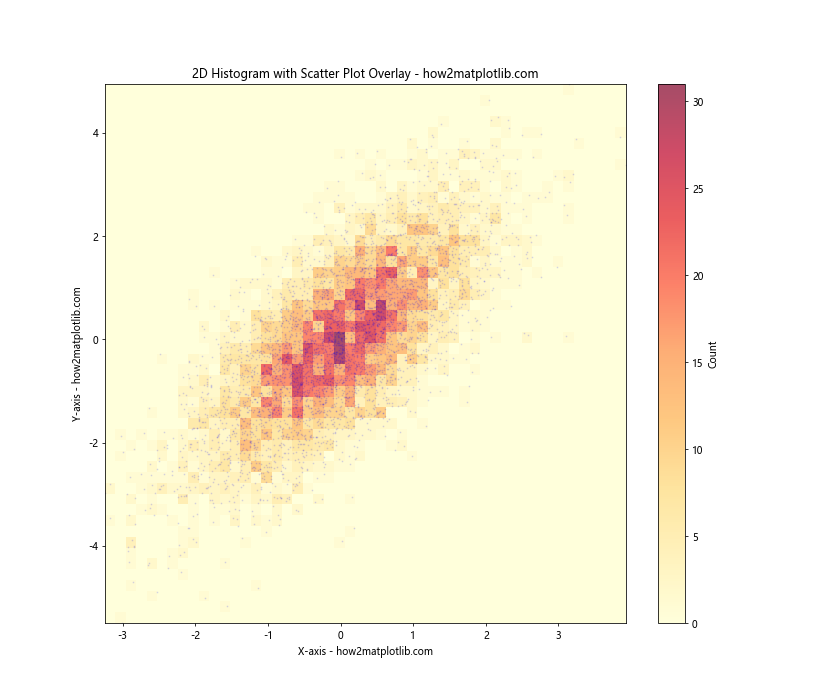
In this example, we first create a 2D histogram using hist2d() with some transparency (alpha=0.7). We then overlay a scatter plot of the same data using scatter(). We set the scatter plot points to be small and somewhat transparent to avoid obscuring the histogram.
This combination can be particularly useful when you have a smaller dataset and want to see both the overall distribution and the individual data points.
Matplotlib 2D Histogram Conclusion
2D histograms are a powerful tool for visualizing the joint distribution of two variables. Matplotlib provides a rich set of functions and options for creating and customizing these plots. From basic usage to advanced techniques like animation and kernel density estimation, we've covered a wide range of approaches to 2D histogram visualization.
Remember that the key to effective data visualization is choosing the right technique for your specific data and the story you want to tell. Experiment with different approaches and customizations to find what works best for your particular use case