How to Set Color in Matplotlib
Matplotlib is a powerful data visualization library in Python that offers extensive color customization options. Understanding how to effectively use colors in your plots can significantly enhance the visual appeal and clarity of your data representations. This comprehensive guide will explore various methods and techniques for setting colors in Matplotlib, covering everything from basic color assignment to advanced color mapping and customization.
1. Basic Color Assignment
The most straightforward way to set colors in Matplotlib is by using color names or RGB values. Matplotlib recognizes a wide range of color names and supports various color formats.
1.1 Using Color Names
Matplotlib provides a set of predefined color names that you can use directly in your plots. These include basic colors like ‘red’, ‘green’, ‘blue’, as well as more specific shades like ‘coral’, ‘turquoise’, or ‘goldenrod’.
Let’s start with a simple example of plotting a line with a specific color:
import matplotlib.pyplot as plt
import numpy as np

x = np.linspace(0, 10, 100)
y = np.sin(x)

plt.figure(figsize=(10, 6))
plt.plot(x, y, color='red', linewidth=2)
plt.title('Sine Wave - how2matplotlib.com')
plt.xlabel('X-axis')
plt.ylabel('Y-axis')
plt.grid(True)
plt.show()

print("The plot shows a red sine wave.")
Output:
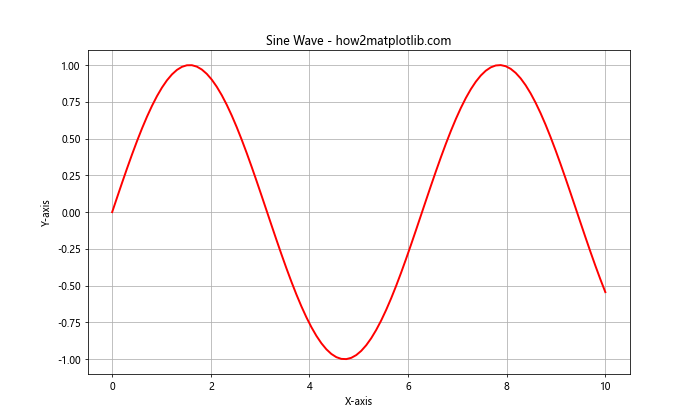
In this example, we’ve set the color of the sine wave to ‘red’ using the color parameter in the plot function. Matplotlib recognizes this color name and applies it to the line.
1.2 Using RGB and RGBA Values
For more precise color control, you can use RGB (Red, Green, Blue) or RGBA (Red, Green, Blue, Alpha) values. These are specified as tuples of floats between 0 and 1.
Here’s an example using RGB values:
import matplotlib.pyplot as plt
import numpy as np

x = np.linspace(0, 10, 100)
y1 = np.sin(x)
y2 = np.cos(x)

plt.figure(figsize=(10, 6))
plt.plot(x, y1, color=(0.8, 0.2, 0.1), linewidth=2, label='Sine')
plt.plot(x, y2, color=(0.1, 0.2, 0.8), linewidth=2, label='Cosine')
plt.title('Sine and Cosine Waves - how2matplotlib.com')
plt.xlabel('X-axis')
plt.ylabel('Y-axis')
plt.legend()
plt.grid(True)
plt.show()

print("The plot shows a red sine wave and a blue cosine wave.")
Output:
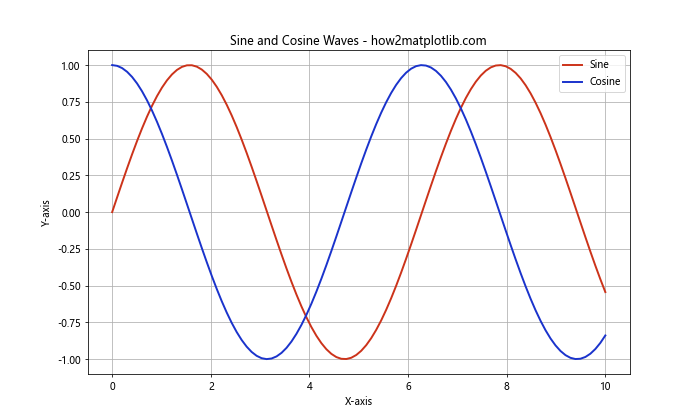
In this example, we’ve used RGB tuples to set custom colors for the sine and cosine waves. The sine wave is set to a reddish color (0.8, 0.2, 0.1), while the cosine wave is set to a bluish color (0.1, 0.2, 0.8).
1.3 Using Hexadecimal Color Codes
Another popular method for specifying colors is using hexadecimal color codes. These are strings starting with a ‘#’ followed by six hexadecimal digits representing RGB values.
Let’s create a bar plot using hexadecimal color codes:
import matplotlib.pyplot as plt
import numpy as np

categories = ['A', 'B', 'C', 'D', 'E']
values = [23, 45, 56, 78, 32]

plt.figure(figsize=(10, 6))
plt.bar(categories, values, color='#FF5733')
plt.title('Bar Plot with Hexadecimal Color - how2matplotlib.com')
plt.xlabel('Categories')
plt.ylabel('Values')
plt.show()

print("The bar plot uses a custom orange color specified by the hexadecimal code #FF5733.")
Output:
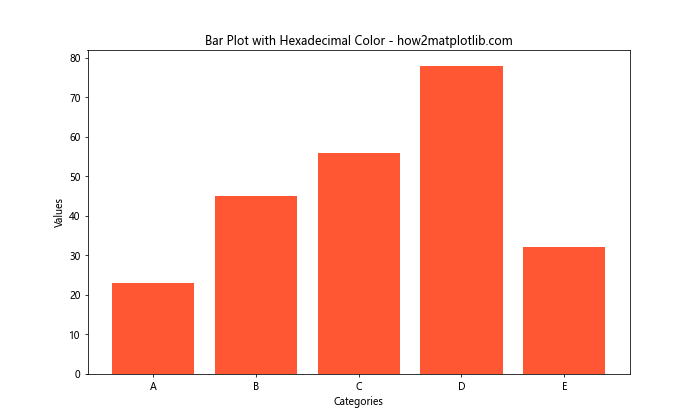
In this example, we’ve used the hexadecimal color code ‘#FF5733’ to set a custom orange color for the bars in our plot.
2. Color Cycles and Color Maps
Matplotlib provides more advanced color setting options through color cycles and color maps, which are particularly useful when dealing with multiple data series or complex visualizations.
2.1 Using Color Cycles
Color cycles are predefined sequences of colors that Matplotlib uses when plotting multiple data series. You can set a custom color cycle to control the colors of your plots automatically.
Here’s an example of setting a custom color cycle:
import matplotlib.pyplot as plt
import numpy as np

plt.rcParams['axes.prop_cycle'] = plt.cycler(color=['#1f77b4', '#ff7f0e', '#2ca02c', '#d62728', '#9467bd'])

x = np.linspace(0, 10, 100)

plt.figure(figsize=(12, 6))
for i in range(5):
    plt.plot(x, np.sin(x + i), linewidth=2, label=f'Line {i+1}')

plt.title('Multiple Lines with Custom Color Cycle - how2matplotlib.com')
plt.xlabel('X-axis')
plt.ylabel('Y-axis')
plt.legend()
plt.grid(True)
plt.show()

print("The plot shows five sine waves with colors from the custom color cycle.")
Output:
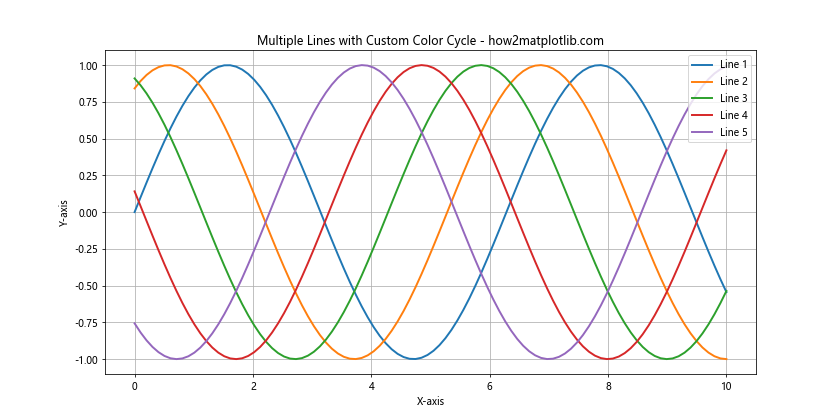
In this example, we’ve set a custom color cycle using plt.rcParams['axes.prop_cycle']. The plot will automatically use these colors for each new line without explicitly specifying colors for each plot.
2.2 Using Color Maps
Color maps are a powerful tool for representing data with continuous color variations. They are particularly useful for heatmaps, 3D surfaces, and scatter plots with a third variable represented by color.
Let’s create a scatter plot using a color map:
import matplotlib.pyplot as plt
import numpy as np

np.random.seed(42)
x = np.random.rand(100)
y = np.random.rand(100)
colors = np.random.rand(100)

plt.figure(figsize=(10, 8))
scatter = plt.scatter(x, y, c=colors, s=500*colors, cmap='viridis', alpha=0.6)
plt.colorbar(scatter)
plt.title('Scatter Plot with Color Map - how2matplotlib.com')
plt.xlabel('X-axis')
plt.ylabel('Y-axis')
plt.show()

print("The scatter plot uses the 'viridis' color map to represent a third variable.")
Output:
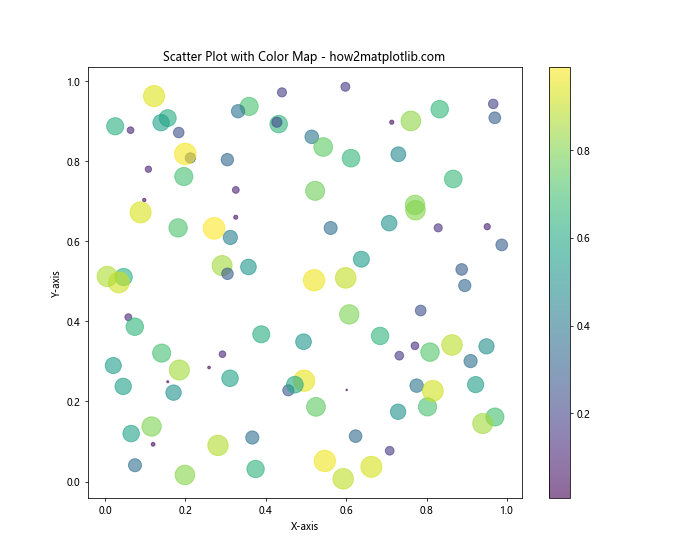
In this example, we’ve used the ‘viridis’ color map to represent a third variable in our scatter plot. The cmap parameter in plt.scatter() specifies the color map to use, and plt.colorbar() adds a color scale to the plot.
3. Customizing Colorbars
Colorbars are an essential tool for interpreting color-mapped data. Matplotlib offers various options to customize colorbars to suit your visualization needs.
3.1 Adjusting Colorbar Position and Size
You can control the position and size of the colorbar using the shrink, aspect, and pad parameters:
import matplotlib.pyplot as plt
import numpy as np

np.random.seed(42)
data = np.random.rand(10, 10)

plt.figure(figsize=(12, 8))
im = plt.imshow(data, cmap='coolwarm')
cbar = plt.colorbar(im, shrink=0.8, aspect=20, pad=0.12)
cbar.set_label('Values', rotation=270, labelpad=15)
plt.title('Heatmap with Customized Colorbar - how2matplotlib.com')
plt.xlabel('X-axis')
plt.ylabel('Y-axis')
plt.show()

print("The heatmap includes a customized colorbar with adjusted position and size.")
Output:
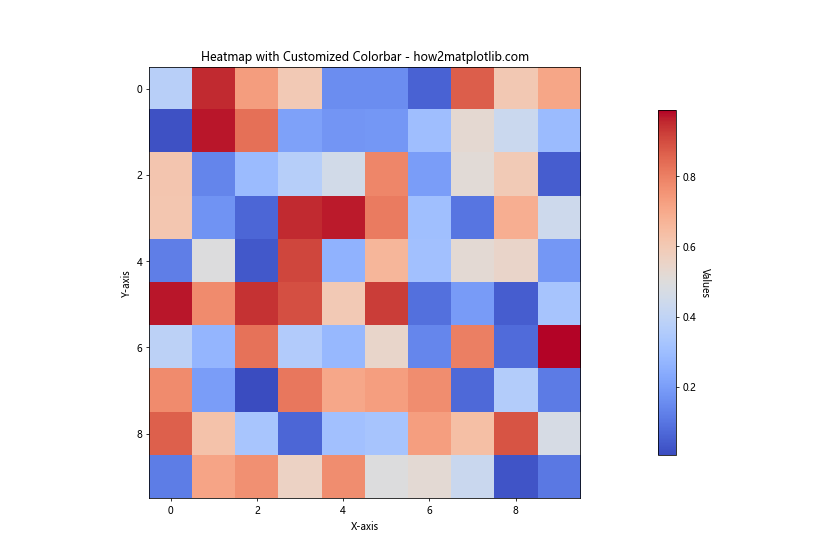
In this example, we’ve created a heatmap and customized its colorbar. The shrink parameter controls the length of the colorbar, aspect adjusts its width, and pad sets the space between the plot and the colorbar.
3.2 Setting Colorbar Ticks and Labels
You can also customize the ticks and labels of your colorbar for better readability:
import matplotlib.pyplot as plt
import numpy as np

np.random.seed(42)
data = np.random.rand(10, 10)

plt.figure(figsize=(12, 8))
im = plt.imshow(data, cmap='viridis')
cbar = plt.colorbar(im)
cbar.set_ticks([0, 0.25, 0.5, 0.75, 1])
cbar.set_ticklabels(['Low', 'Medium-Low', 'Medium', 'Medium-High', 'High'])
cbar.set_label('Custom Scale - how2matplotlib.com', rotation=270, labelpad=15)
plt.title('Heatmap with Custom Colorbar Labels')
plt.xlabel('X-axis')
plt.ylabel('Y-axis')
plt.show()

print("The heatmap's colorbar now has custom ticks and labels.")
Output:
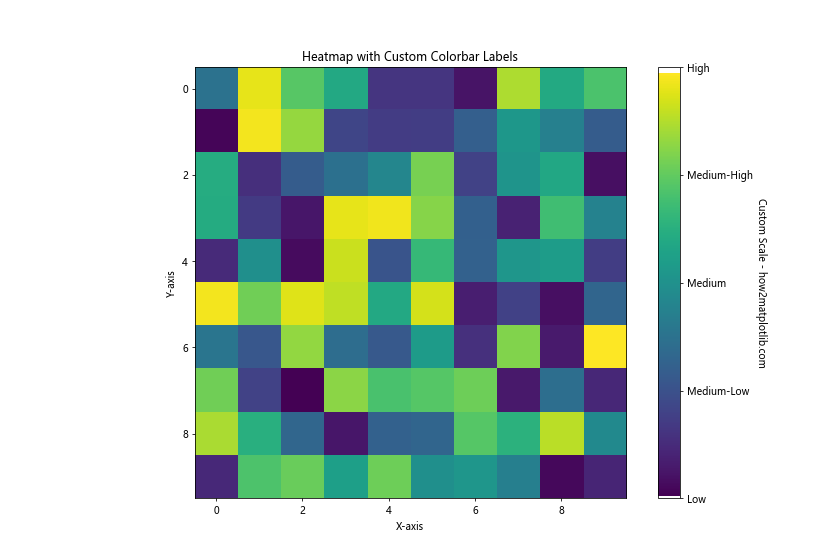
This example demonstrates how to set custom ticks and labels for the colorbar, allowing you to provide more meaningful descriptions for your color scale.
4. Advanced Color Techniques
As you become more comfortable with basic color settings, you can explore more advanced techniques to create sophisticated and informative visualizations.
4.1 Creating Custom Colormaps
While Matplotlib provides many built-in colormaps, you might sometimes need to create a custom colormap for specific visualization requirements:
import matplotlib.pyplot as plt
import matplotlib.colors as mcolors
import numpy as np

# Create custom colormap
colors = ['darkred', 'red', 'lightcoral', 'white', 'paleturquoise', 'blue', 'navy']
n_bins = len(colors)
cmap = mcolors.LinearSegmentedColormap.from_list('custom_cmap', colors, N=n_bins)

# Generate some data
np.random.seed(42)
data = np.random.randn(30, 30)

plt.figure(figsize=(12, 10))
im = plt.imshow(data, cmap=cmap)
plt.colorbar(im)
plt.title('Heatmap with Custom Colormap - how2matplotlib.com')
plt.xlabel('X-axis')
plt.ylabel('Y-axis')
plt.show()

print("The heatmap uses a custom colormap transitioning from dark red to navy blue.")
Output:
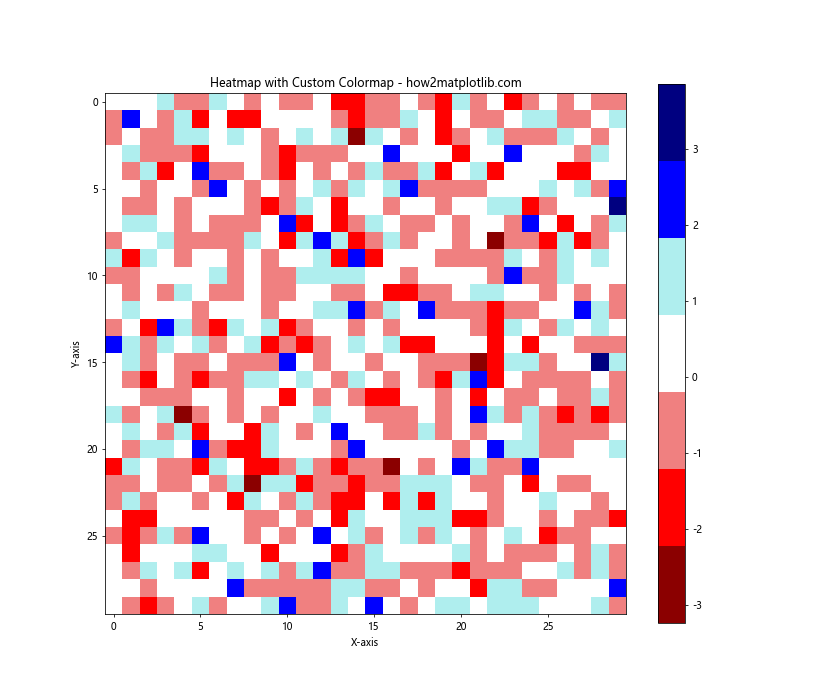
In this example, we’ve created a custom colormap that transitions from dark red through white to navy blue. This kind of custom colormap can be particularly useful for highlighting specific ranges in your data.
4.2 Using Diverging Colormaps
Diverging colormaps are useful when your data has a meaningful center point, such as in correlation matrices or temperature anomalies:
import matplotlib.pyplot as plt
import numpy as np

np.random.seed(42)
data = np.random.randn(20, 20)

plt.figure(figsize=(12, 10))
im = plt.imshow(data, cmap='RdBu_r', vmin=-2, vmax=2)
plt.colorbar(im)
plt.title('Correlation Matrix with Diverging Colormap - how2matplotlib.com')
plt.xlabel('Features')
plt.ylabel('Features')
plt.show()

print("The correlation matrix uses a diverging colormap to highlight positive and negative correlations.")
Output:
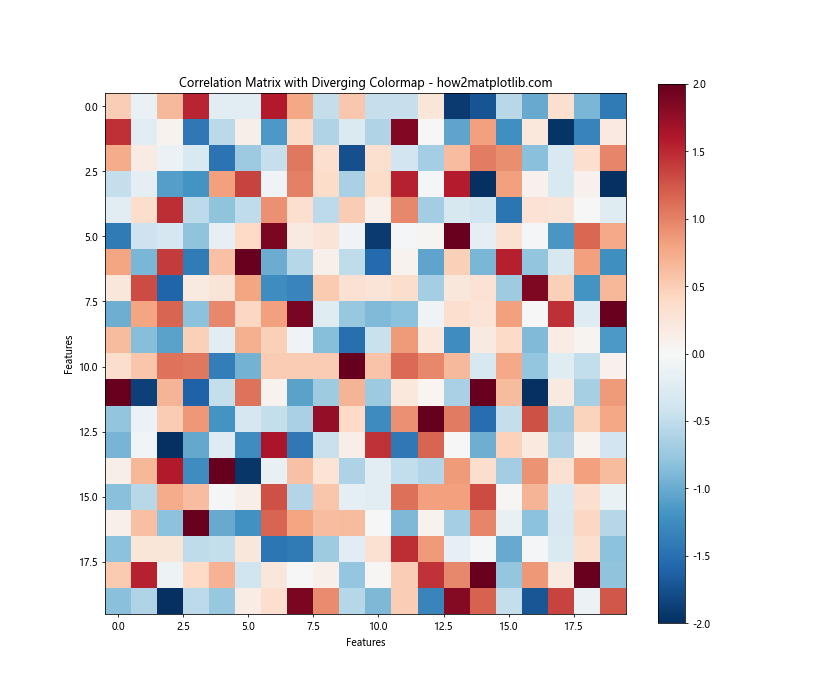
This example uses the ‘RdBu_r’ colormap, which is particularly effective for showing diverging data. The vmin and vmax parameters ensure that the color scale is centered at zero.
4.3 Applying Alpha for Transparency
Alpha values can be used to add transparency to your plots, which is useful for overlaying multiple datasets or creating watermark effects:
import matplotlib.pyplot as plt
import numpy as np

x = np.linspace(0, 10, 100)
y1 = np.sin(x)
y2 = np.cos(x)

plt.figure(figsize=(12, 8))
plt.plot(x, y1, color='red', alpha=0.7, linewidth=3, label='Sine')
plt.plot(x, y2, color='blue', alpha=0.7, linewidth=3, label='Cosine')
plt.fill_between(x, y1, y2, color='purple', alpha=0.2)
plt.title('Sine and Cosine with Transparency - how2matplotlib.com')
plt.xlabel('X-axis')
plt.ylabel('Y-axis')
plt.legend()
plt.grid(True, alpha=0.3)
plt.show()

print("The plot uses alpha values to create semi-transparent lines and fill.")
Output:
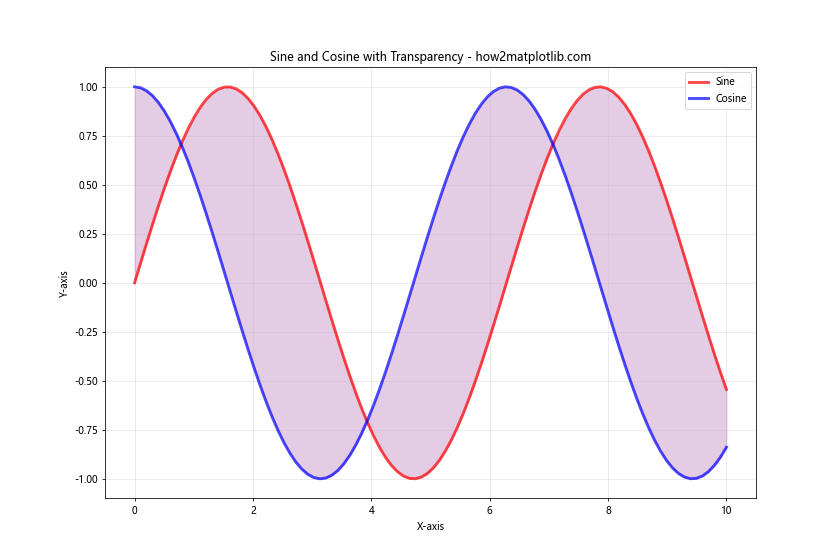
In this example, we’ve used alpha values to create semi-transparent lines and fill between the sine and cosine curves. This technique can help in visualizing overlapping data without completely obscuring underlying elements.
5. Color in Different Plot Types
Different types of plots may require different approaches to color setting. Let’s explore how to effectively use color in various common plot types.
5.1 Pie Charts
In pie charts, colors play a crucial role in distinguishing between different categories:
import matplotlib.pyplot as plt

categories = ['A', 'B', 'C', 'D', 'E']
sizes = [15, 30, 25, 10, 20]
colors = ['#ff9999', '#66b3ff', '#99ff99', '#ffcc99', '#ff99cc']
explode = (0, 0.1, 0, 0, 0)  # To emphasize the second slice

plt.figure(figsize=(10, 8))
plt.pie(sizes, explode=explode, labels=categories, colors=colors, autopct='%1.1f%%', startangle=90)
plt.axis('equal')  # Equal aspect ratio ensures that pie is drawn as a circle
plt.title('Pie Chart with Custom Colors - how2matplotlib.com')
plt.show()

print("The pie chart uses custom pastel colors for each category.")
Output:
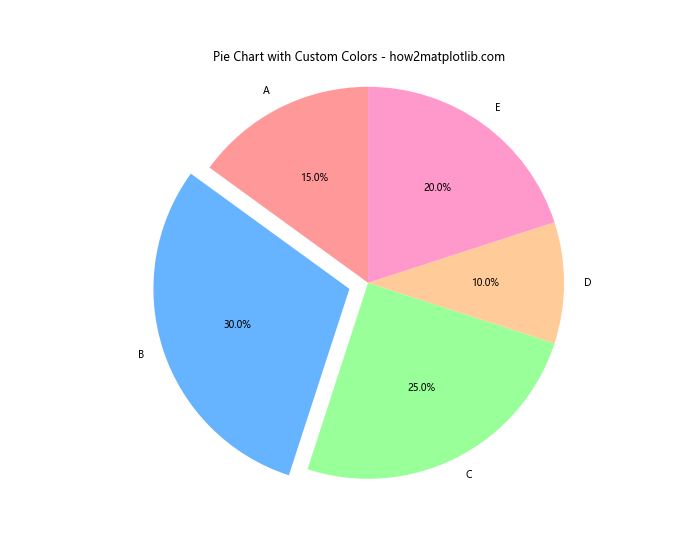
In this pie chart example, we’ve used a custom color palette to distinguish between different categories. The explode parameter is used to emphasize a particular slice by pulling it out slightly.
5.2 Stacked Bar Charts
Stacked bar charts require careful color selection to ensure each stack is distinguishable:
import matplotlib.pyplot as plt
import numpy as np

categories = ['A', 'B', 'C', 'D']
men_means = [20, 35, 30, 35]
women_means = [25, 32, 34, 20]
men_std = [2, 3, 4, 1]
women_std = [3, 5, 2, 3]

width = 0.35
fig, ax = plt.subplots(figsize=(12, 8))

ax.bar(categories, men_means, width, yerr=men_std, label='Men', color='#3498db')
ax.bar(categories, women_means, width, yerr=women_std, bottom=men_means,
       label='Women', color='#e74c3c')

ax.set_ylabel('Scores')
ax.set_title('Stacked Bar Chart by Gender - how2matplotlib.com')
ax.legend()

plt.show()

print("The stacked bar chart uses blue for men and red for women.")
Output:
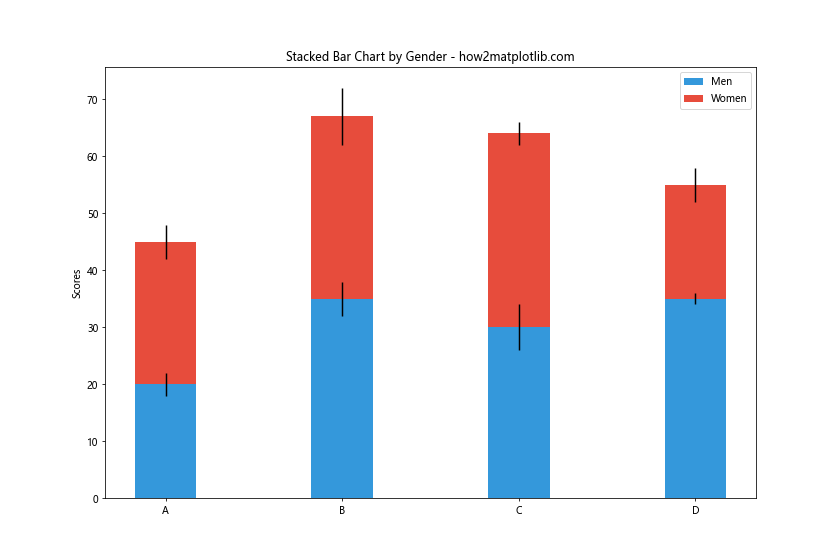
In this stacked bar chart, we’ve used contrasting colors (blue and red) to clearly distinguish between the two categories (men and women). The bottom parameter in the second bar call is used to stack the bars.
5.3 Heatmaps
Heatmaps rely heavily on color to represent data values. Choosing an appropriate colormap is crucial:
import matplotlib.pyplot as plt
import numpy as np

np.random.seed(42)
data = np.random.rand(10, 12)

fig, ax = plt.subplots(figsize=(12, 8))
im = ax.imshow(data, cmap='YlOrRd')

# Add colorbar
cbar = ax.figure.colorbar(im, ax=ax)
cbar.ax.set_ylabel('Values', rotation=-90, va="bottom")

# Add labels
ax.set_xticks(np.arange(data.shape[1]))
ax.set_yticks(np.arange(data.shape[0]))
ax.set_xticklabels([f'Col {i+1}' for i in range(data.shape[1])])
ax.set_yticklabels([f'Row {i+1}' for i in range(data.shape[0])])

plt.setp(ax.get_xticklabels(), rotation=45, ha="right", rotation_mode="anchor")

ax.set_title("Heatmap with YlOrRd Colormap - how2matplotlib.com")
fig.tight_layout()
plt.show()

print("The heatmap uses the YlOrRd (Yellow-Orange-Red) colormap to represent data intensity.")
Output:
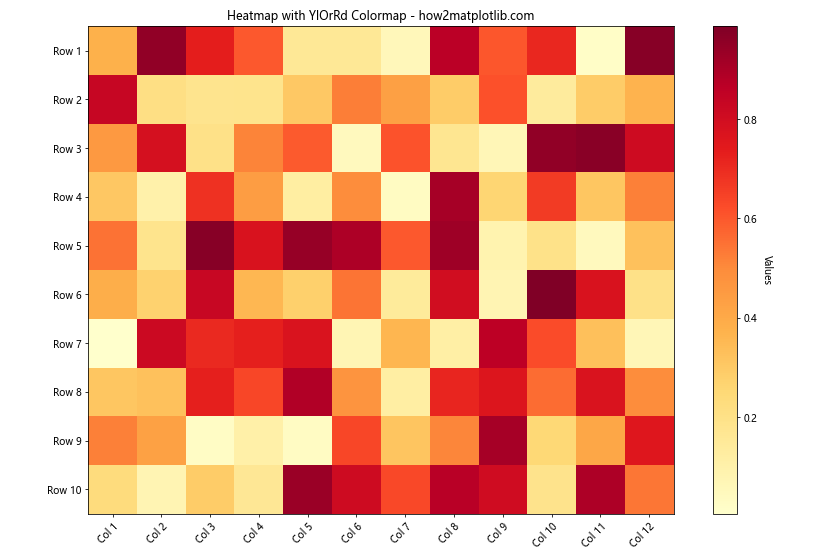
In this heatmap example, we’ve used the ‘YlOrRd’ colormap, which transitions from yellow to orange to red. This colormap is effective for showing intensity or density in data. The colorbar provides a reference for the values represented by the colors.
6. Color in 3D Plots
Matplotlib also supports 3D plotting, where color can add an extra dimension of information to your visualizations.
6.1 3D Surface Plots
In 3D surface plots, color can be used to represent the height of the surface:
import matplotlib.pyplot as plt
from mpl_toolkits.mplot3d import Axes3D
import numpy as np

fig = plt.figure(figsize=(12, 8))
ax = fig.add_subplot(111, projection='3d')

x = np.arange(-5, 5, 0.25)
y = np.arange(-5, 5, 0.25)
x, y = np.meshgrid(x, y)
r = np.sqrt(x**2 + y**2)
z = np.sin(r)

surf = ax.plot_surface(x, y, z, cmap='viridis', linewidth=0, antialiased=False)

ax.set_zlim(-1.01, 1.01)
fig.colorbar(surf, shrink=0.5, aspect=5)

ax.set_title('3D Surface Plot - how2matplotlib.com')
ax.set_xlabel('X-axis')
ax.set_ylabel('Y-axis')
ax.set_zlabel('Z-axis')

plt.show()

print("The 3D surface plot uses the 'viridis' colormap to represent the height of the surface.")
Output:
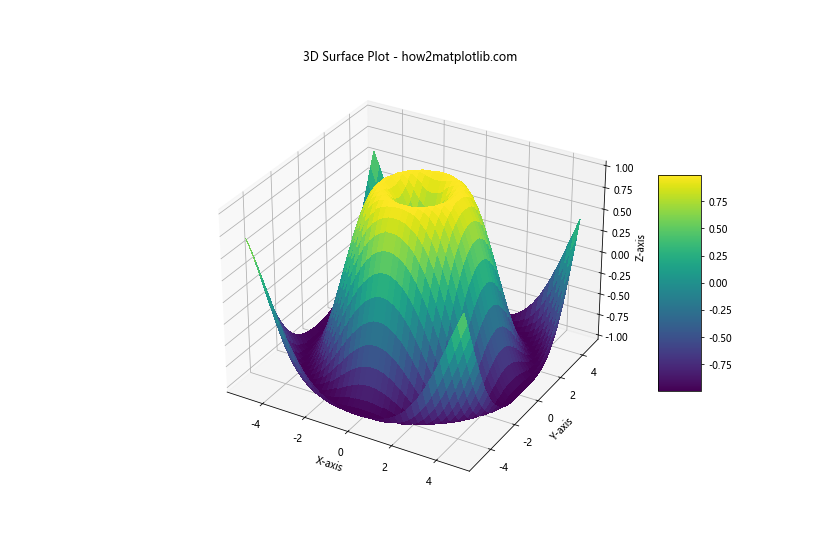
In this example, we’ve created a 3D surface plot where the color represents the height (z-value) of the surface. The ‘viridis’ colormap provides a clear visual representation of the surface’s contours.
6.2 3D Scatter Plots
In 3D scatter plots, color can be used to represent a fourth dimension of data:
import matplotlib.pyplot as plt
from mpl_toolkits.mplot3d import Axes3D
import numpy as np

fig = plt.figure(figsize=(12, 8))
ax = fig.add_subplot(111, projection='3d')

n = 100
xs = np.random.rand(n)
ys = np.random.rand(n)
zs = np.random.rand(n)
color_values = np.random.rand(n)

scatter = ax.scatter(xs, ys, zs, c=color_values, cmap='plasma', s=50)

ax.set_xlabel('X Label')
ax.set_ylabel('Y Label')
ax.set_zlabel('Z Label')
ax.set_title('3D Scatter Plot with Color Dimension - how2matplotlib.com')

plt.colorbar(scatter)
plt.show()

print("The 3D scatter plot uses color to represent a fourth dimension of data.")
Output:
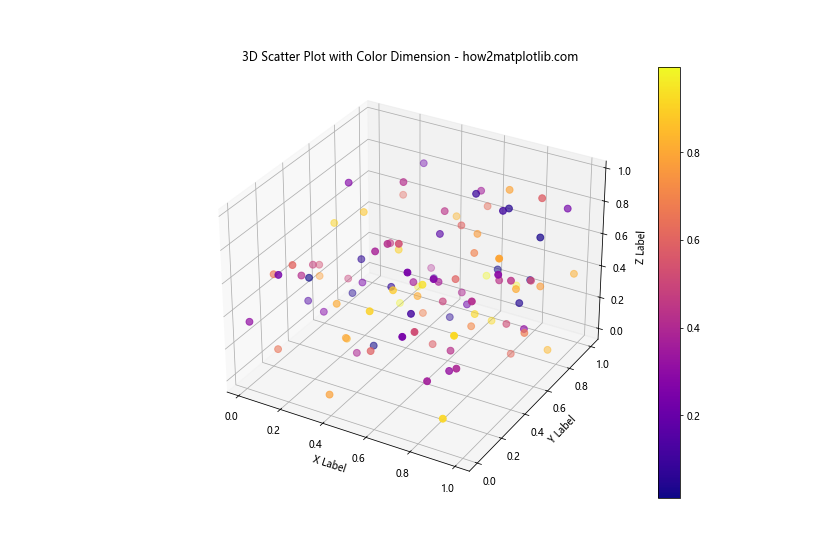
In this 3D scatter plot, we’ve used color to represent a fourth dimension of data. The ‘plasma’ colormap is applied to the color values, and a colorbar is added to provide a reference for these values.
7. Handling Color for Color-Blind Accessibility
When creating visualizations, it’s important to consider color-blind accessibility. Matplotlib provides colormaps that are designed to be perceptually uniform and accessible to individuals with various forms of color blindness.
7.1 Using Color-Blind Friendly Colormaps
Here’s an example using a color-blind friendly colormap:
import matplotlib.pyplot as plt
import numpy as np

np.random.seed(42)
data = np.random.rand(10, 10)

plt.figure(figsize=(12, 8))
im = plt.imshow(data, cmap='viridis')
plt.colorbar(im)
plt.title('Heatmap with Color-Blind Friendly Colormap - how2matplotlib.com')
plt.xlabel('X-axis')
plt.ylabel('Y-axis')
plt.show()

print("The heatmap uses the 'viridis' colormap, which is designed to be color-blind friendly.")
Output:
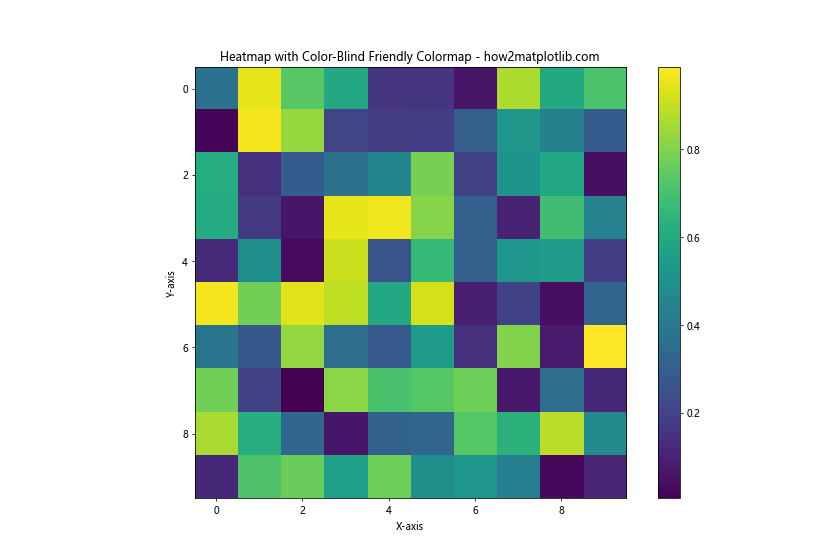
The ‘viridis’ colormap used in this example is designed to be perceptually uniform and accessible to individuals with various forms of color blindness.
7.2 Creating Custom Color-Blind Friendly Palettes
You can also create custom color palettes that are color-blind friendly:
import matplotlib.pyplot as plt
import numpy as np

# Color-blind friendly palette
cb_colors = ['#E69F00', '#56B4E9', '#009E73', '#F0E442', '#0072B2', '#D55E00', '#CC79A7']

x = np.linspace(0, 10, 100)

plt.figure(figsize=(12, 8))
for i, color in enumerate(cb_colors):
    plt.plot(x, np.sin(x + i), color=color, linewidth=2, label=f'Line {i+1}')

plt.title('Multiple Lines with Color-Blind Friendly Palette - how2matplotlib.com')
plt.xlabel('X-axis')
plt.ylabel('Y-axis')
plt.legend()
plt.grid(True)
plt.show()

print("The plot uses a custom color-blind friendly palette.")
Output:
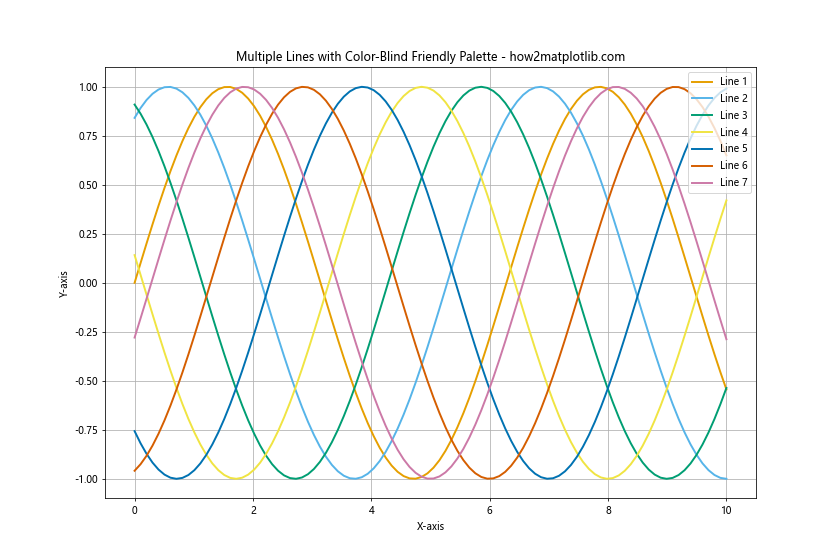
This example uses a custom color palette that is designed to be distinguishable for most types of color blindness.
8. Advanced Color Manipulation Techniques
For more sophisticated color manipulations, you can use Matplotlib’s color utilities and create custom color normalization.
8 Custom Color Normalization
For more control over how data values are mapped to colors, you can create custom color normalizations:
import matplotlib.pyplot as plt
import matplotlib.colors as mcolors
import numpy as np

class MidpointNormalize(mcolors.Normalize):
    def __init__(self, vmin=None, vmax=None, midpoint=None, clip=False):
        self.midpoint = midpoint
        mcolors.Normalize.__init__(self, vmin, vmax, clip)

    def __call__(self, value, clip=None):
        x, y = [self.vmin, self.midpoint, self.vmax], [0, 0.5, 1]
        return np.ma.masked_array(np.interp(value, x, y))

np.random.seed(42)
data = np.random.randn(20, 20)

fig, (ax1, ax2) = plt.subplots(1, 2, figsize=(16, 6))

# Standard normalization
im1 = ax1.imshow(data, cmap='RdBu_r')
ax1.set_title('Standard Normalization')
fig.colorbar(im1, ax=ax1)

# Custom midpoint normalization
norm = MidpointNormalize(midpoint=0)
im2 = ax2.imshow(data, cmap='RdBu_r', norm=norm)
ax2.set_title('Custom Midpoint Normalization')
fig.colorbar(im2, ax=ax2)

plt.suptitle('Comparison of Color Normalizations - how2matplotlib.com', fontsize=16)
plt.show()

print("The plot compares standard color normalization with a custom midpoint normalization.")
Output:
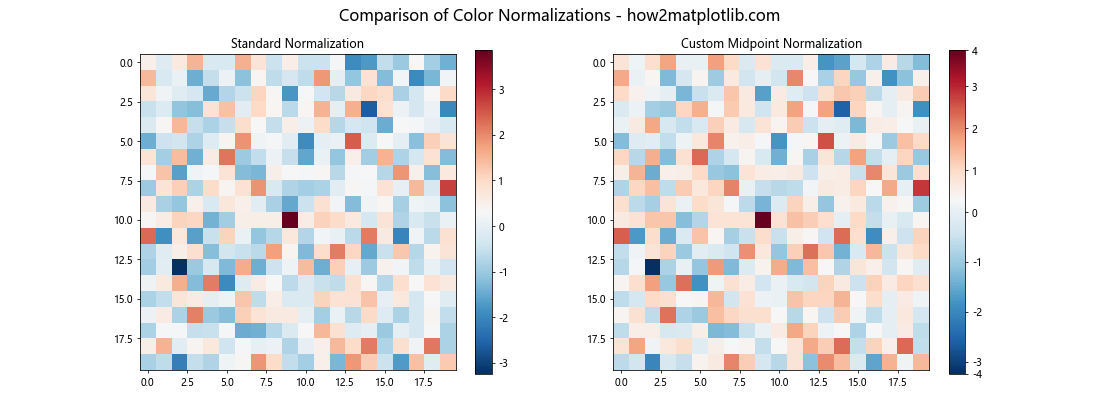
This example introduces a custom color normalization class MidpointNormalize that allows you to specify a midpoint for diverging colormaps. This is particularly useful for data that has a meaningful center point, such as temperature anomalies or correlation coefficients.
How to Set Color in Matplotlib Conclusion
Mastering color in Matplotlib opens up a world of possibilities for creating informative and visually appealing data visualizations. From basic color assignment to advanced techniques like custom colormaps and color normalization, the library offers a wide range of tools to enhance your plots.
Remember these key points when working with color in Matplotlib:
- Use appropriate color schemes for your data type and visualization goals.
- Consider color-blind accessibility when choosing colors.
- Leverage colormaps for continuous data representation.
- Customize colorbars to provide clear references for your color scales.
- Experiment with transparency and blending for complex visualizations.
- Maintain consistency in color usage across multiple plots or subplots.
- Utilize Matplotlib’s color utilities for fine-tuned color manipulations.
By applying these techniques and continually experimenting with Matplotlib’s color capabilities, you can create sophisticated, informative, and visually striking data visualizations that effectively communicate your data insights.