Gradient Fill Color in Matplotlib
Matplotlib is a powerful data visualization library in Python that allows users to create a wide variety of plots and charts. One of the advanced techniques that can greatly enhance the visual appeal of your plots is the use of gradient fill colors. Gradient fills can add depth, dimension, and visual interest to your charts, making them more engaging and informative. In this comprehensive guide, we’ll explore various methods and techniques for implementing gradient fill colors in Matplotlib, complete with detailed explanations and numerous code examples.
Understanding Gradient Fill Colors
Before diving into the implementation details, it’s important to understand what gradient fill colors are and why they’re useful in data visualization. A gradient fill is a smooth transition between two or more colors across a shape or area. In the context of Matplotlib, this can be applied to various plot elements such as bars, areas under curves, or backgrounds of plots.
Gradient fills serve several purposes:
- Aesthetic enhancement: They make plots more visually appealing.
- Data emphasis: They can draw attention to specific areas of a plot.
- Depth perception: They can create a sense of depth or dimension in 2D plots.
- Data representation: In some cases, gradients can represent a third dimension of data.
Now, let’s explore different ways to implement gradient fill colors in Matplotlib.
Basic Gradient Fill in Area Plots
One of the simplest ways to introduce gradient fills is in area plots. Let’s start with a basic example:
import numpy as np
import matplotlib.pyplot as plt
from matplotlib.colors import LinearSegmentedColormap

# Create data
x = np.linspace(0, 10, 100)
y = np.sin(x)

# Create custom colormap
colors = ['#ff9999', '#ff3333']
n_bins = 100
cmap = LinearSegmentedColormap.from_list('Custom', colors, N=n_bins)

# Create the plot
fig, ax = plt.subplots(figsize=(10, 6))
ax.fill_between(x, y, color='#ff9999', alpha=0.3)
for i in range(n_bins):
    ax.fill_between(x, y, where=y >= -1 + i*2/n_bins, color=cmap(i/n_bins), alpha=0.1)

ax.set_title('Gradient Fill in Area Plot - how2matplotlib.com', fontsize=16)
ax.set_xlabel('X-axis', fontsize=12)
ax.set_ylabel('Y-axis', fontsize=12)

plt.text(5, -0.5, 'Visit how2matplotlib.com for more examples', ha='center', va='center', fontsize=10)
plt.tight_layout()
plt.show()
Output:
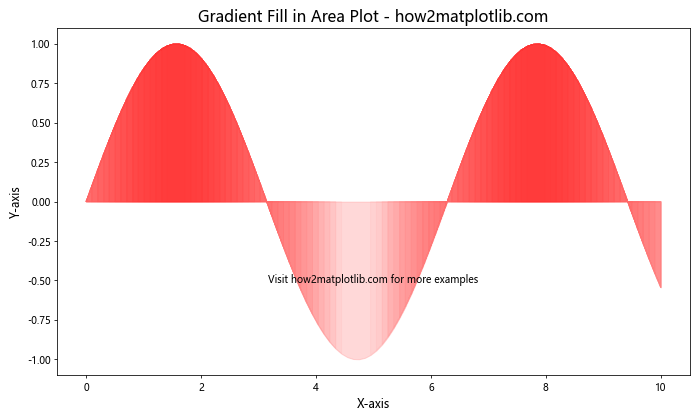
In this example, we create a simple sine wave and apply a gradient fill beneath it. Here’s a breakdown of the key steps:
- We create a custom colormap using
LinearSegmentedColormap.from_list(), defining the start and end colors of our gradient. - We use
fill_between()to create the base fill with a light color and low alpha for transparency. - We then loop through multiple
fill_between()calls, each with a slightly different color from our gradient and a condition to fill only above a certain y-value.
This technique creates a smooth gradient effect from light pink to dark red under the sine curve.
Gradient Fill in Bar Charts
Gradient fills can also be applied to bar charts to create a more dynamic visual effect. Here’s an example:
import numpy as np
import matplotlib.pyplot as plt
from matplotlib.colors import LinearSegmentedColormap

# Create data
categories = ['A', 'B', 'C', 'D', 'E']
values = [23, 45, 56, 78, 32]

# Create custom colormap
colors = ['#3498db', '#2980b9']
n_bins = 100
cmap = LinearSegmentedColormap.from_list('Custom', colors, N=n_bins)

# Create the plot
fig, ax = plt.subplots(figsize=(10, 6))

for i, (cat, val) in enumerate(zip(categories, values)):
    gradient = np.linspace(0, 1, 100).reshape(1, -1)
    gradient = np.repeat(gradient, 10, axis=0)
    ax.imshow(gradient, extent=[i-0.4, i+0.4, 0, val], aspect='auto', cmap=cmap)
    ax.bar(i, val, width=0.8, alpha=0.5, color='none', edgecolor='black')

ax.set_xticks(range(len(categories)))
ax.set_xticklabels(categories)
ax.set_title('Gradient Fill in Bar Chart - how2matplotlib.com', fontsize=16)
ax.set_xlabel('Categories', fontsize=12)
ax.set_ylabel('Values', fontsize=12)

plt.text(2, 40, 'Visit how2matplotlib.com for more examples', ha='center', va='center', fontsize=10)
plt.tight_layout()
plt.show()
Output:
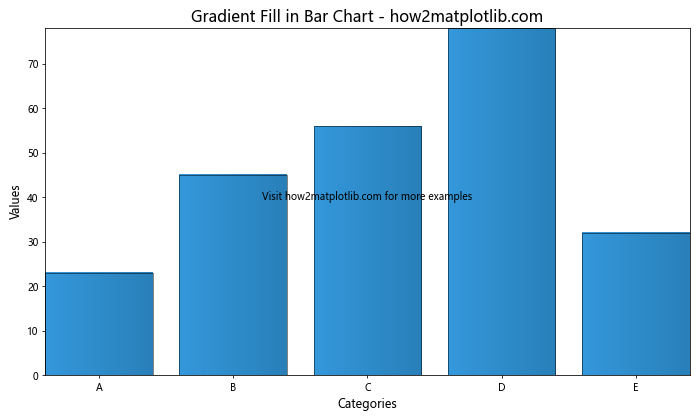
In this example, we create a bar chart with gradient-filled bars. Here’s how it works:
- We define a custom colormap for our gradient.
- For each bar, we create a gradient image using
np.linspace()andnp.repeat(). - We use
ax.imshow()to display this gradient within the bar’s boundaries. - We then overlay a transparent bar with a black edge to create the bar outline.
This technique results in bars with a smooth vertical gradient from light to dark blue.
Radial Gradient in Scatter Plots
Gradients can also be applied radially, which can be particularly effective in scatter plots. Here’s an example:
import numpy as np
import matplotlib.pyplot as plt
from matplotlib.colors import LinearSegmentedColormap

# Create data
np.random.seed(42)
x = np.random.rand(100)
y = np.random.rand(100)
sizes = np.random.rand(100) * 1000

# Create custom colormap
colors = ['#ff9999', '#ff3333']
n_bins = 100
cmap = LinearSegmentedColormap.from_list('Custom', colors, N=n_bins)

# Create the plot
fig, ax = plt.subplots(figsize=(10, 8))

scatter = ax.scatter(x, y, c=sizes, s=sizes, cmap=cmap, alpha=0.6)

ax.set_title('Radial Gradient in Scatter Plot - how2matplotlib.com', fontsize=16)
ax.set_xlabel('X-axis', fontsize=12)
ax.set_ylabel('Y-axis', fontsize=12)

cbar = plt.colorbar(scatter)
cbar.set_label('Size', fontsize=12)

plt.text(0.5, 0.5, 'Visit how2matplotlib.com for more examples', ha='center', va='center', fontsize=10)
plt.tight_layout()
plt.show()
Output:
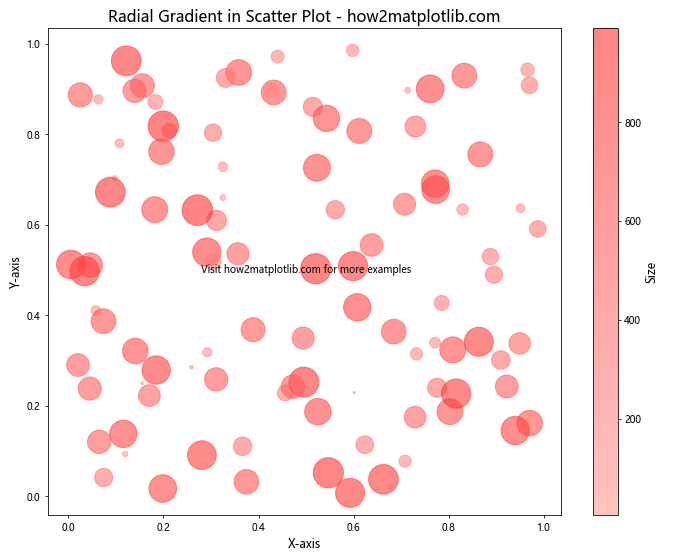
In this example, we create a scatter plot where the color and size of each point are determined by a single value. Here’s how it works:
- We generate random data for x, y, and sizes.
- We create a custom colormap for our gradient.
- We use
ax.scatter()to create the plot, passing the sizes to bothc(color) ands(size) parameters. - We add a colorbar to show the gradient scale.
This technique creates a scatter plot where larger points are darker, creating a radial gradient effect within each point.
Gradient Background
Gradients can also be applied to the background of a plot to create a more immersive visual experience. Here’s an example:
import numpy as np
import matplotlib.pyplot as plt
from matplotlib.colors import LinearSegmentedColormap

# Create data
x = np.linspace(0, 10, 100)
y1 = np.sin(x)
y2 = np.cos(x)

# Create custom colormap
colors = ['#e6f3ff', '#ffffff']
n_bins = 100
cmap = LinearSegmentedColormap.from_list('Custom', colors, N=n_bins)

# Create the plot
fig, ax = plt.subplots(figsize=(12, 8))

# Create gradient background
gradient = np.linspace(0, 1, 100).reshape(1, -1)
gradient = np.repeat(gradient, 100, axis=0)
ax.imshow(gradient, extent=[ax.get_xlim()[0], ax.get_xlim()[1], ax.get_ylim()[0], ax.get_ylim()[1]],
          aspect='auto', cmap=cmap, zorder=-1)

# Plot data
ax.plot(x, y1, color='#ff3333', linewidth=2, label='Sin')
ax.plot(x, y2, color='#3333ff', linewidth=2, label='Cos')

ax.set_title('Gradient Background - how2matplotlib.com', fontsize=16)
ax.set_xlabel('X-axis', fontsize=12)
ax.set_ylabel('Y-axis', fontsize=12)
ax.legend()

plt.text(5, 0, 'Visit how2matplotlib.com for more examples', ha='center', va='center', fontsize=10)
plt.tight_layout()
plt.show()
Output:
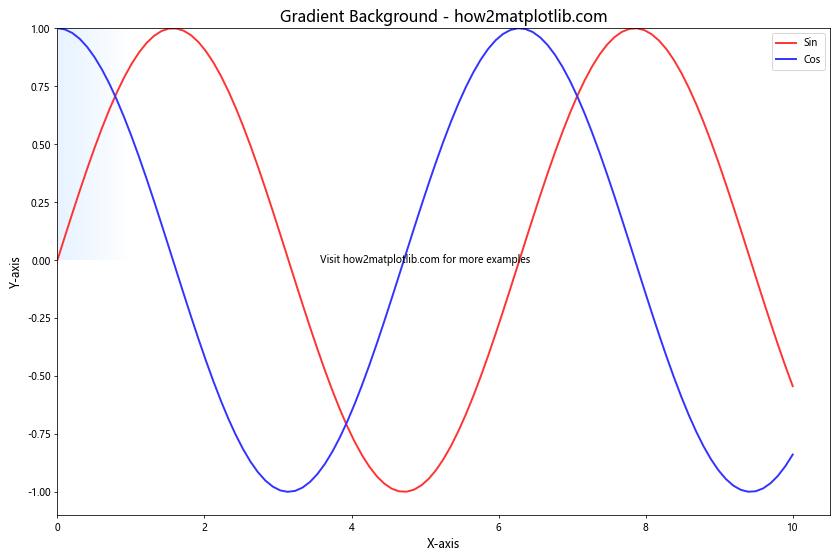
In this example, we create a plot with a gradient background. Here’s how it works:
- We create a custom colormap for our gradient.
- We generate a gradient image using
np.linspace()andnp.repeat(). - We use
ax.imshow()to display this gradient as the background of our plot, settingzorder=-1to ensure it’s behind our data. - We then plot our data on top of this gradient background.
This technique creates a subtle gradient background that transitions from light blue to white, enhancing the overall aesthetic of the plot.
Gradient Fill in Contour Plots
Gradient fills can be particularly effective in contour plots to represent different levels of data. Here’s an example:
import numpy as np
import matplotlib.pyplot as plt

# Create data
x = np.linspace(-3, 3, 100)
y = np.linspace(-3, 3, 100)
X, Y = np.meshgrid(x, y)
Z = np.exp(-(X**2 + Y**2))

# Create the plot
fig, ax = plt.subplots(figsize=(10, 8))

# Create filled contour plot
contour = ax.contourf(X, Y, Z, levels=20, cmap='viridis')

ax.set_title('Gradient Fill in Contour Plot - how2matplotlib.com', fontsize=16)
ax.set_xlabel('X-axis', fontsize=12)
ax.set_ylabel('Y-axis', fontsize=12)

# Add colorbar
cbar = fig.colorbar(contour)
cbar.set_label('Z-value', fontsize=12)

plt.text(0, -3.5, 'Visit how2matplotlib.com for more examples', ha='center', va='center', fontsize=10)
plt.tight_layout()
plt.show()
Output:
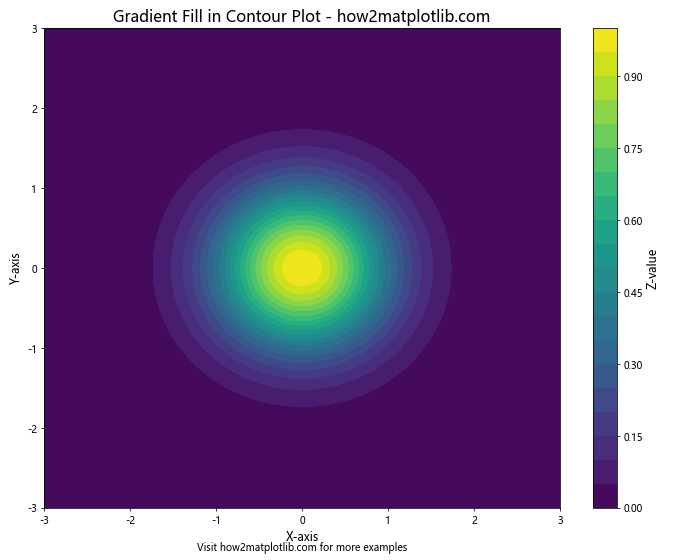
In this example, we create a contour plot with gradient fill. Here’s how it works:
- We generate 2D data using
np.meshgrid()and a mathematical function. - We use
ax.contourf()to create the filled contour plot. - We specify the number of levels and a colormap to create the gradient effect.
- We add a colorbar to show the gradient scale.
This technique results in a contour plot where different levels of the data are represented by different colors in a smooth gradient.
Gradient Fill in Heatmaps
Heatmaps are another type of plot where gradient fills can be very effective. Here’s an example:
import numpy as np
import matplotlib.pyplot as plt

# Create data
np.random.seed(42)
data = np.random.rand(10, 10)

# Create the plot
fig, ax = plt.subplots(figsize=(10, 8))

# Create heatmap
heatmap = ax.imshow(data, cmap='YlOrRd')

ax.set_title('Gradient Fill in Heatmap - how2matplotlib.com', fontsize=16)
ax.set_xlabel('X-axis', fontsize=12)
ax.set_ylabel('Y-axis', fontsize=12)

# Add colorbar
cbar = fig.colorbar(heatmap)
cbar.set_label('Value', fontsize=12)

plt.text(4.5, -1, 'Visit how2matplotlib.com for more examples', ha='center', va='center', fontsize=10)
plt.tight_layout()
plt.show()
Output:
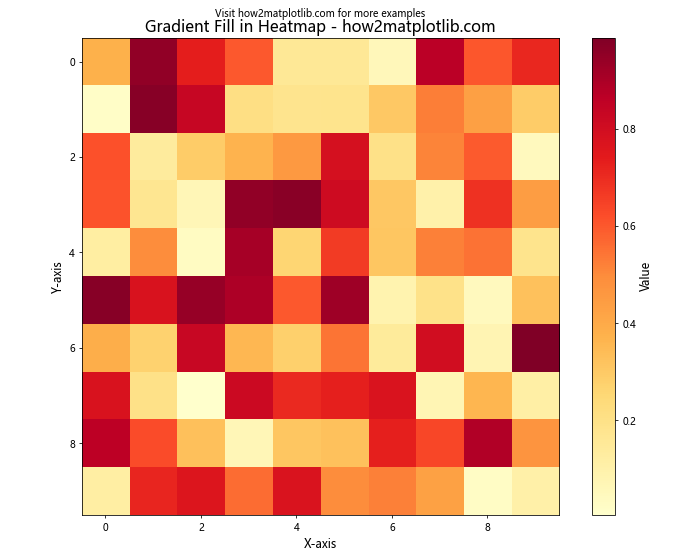
In this example, we create a heatmap with a gradient fill. Here’s how it works:
- We generate random 2D data.
- We use
ax.imshow()to create the heatmap. - We specify a colormap (‘YlOrRd’) to create the gradient effect from yellow to red.
- We add a colorbar to show the gradient scale.
This technique results in a heatmap where the intensity of each cell is represented by a color in the gradient, allowing for easy visualization of data patterns.
Gradient Fill in Polar Plots
Gradient fills can also be applied to polar plots to create visually striking representations of circular data. Here’s an example:
import numpy as np
import matplotlib.pyplot as plt
from matplotlib.colors import LinearSegmentedColormap

# Create data
theta = np.linspace(0, 2*np.pi, 100)
r = 1 + 0.5 * np.sin(5*theta)

# Create custom colormap
colors = ['#ff9999', '#ff3333']
n_bins = 100
cmap = LinearSegmentedColormap.from_list('Custom', colors, N=n_bins)

# Create the plot
fig, ax = plt.subplots(figsize=(10, 8), subplot_kw=dict(projection='polar'))

# Create gradient-filled polar plot
for i in range(len(theta)-1):
    ax.fill_between(theta[i:i+2], 0, r[i:i+2], color=cmap(i/len(theta)))

ax.set_title('Gradient Fill in Polar Plot - how2matplotlib.com', fontsize=16)

plt.text(0, 1.8, 'Visit how2matplotlib.com for more examples', ha='center', va='center', fontsize=10)
plt.tight_layout()
plt.show()
Output:
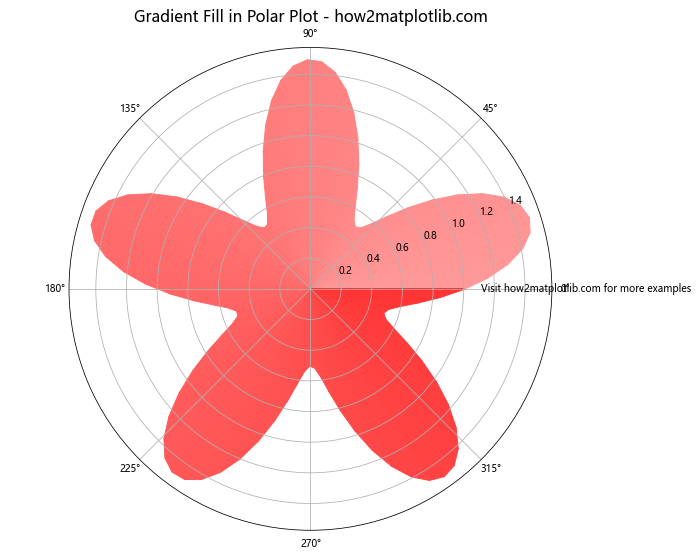
In this example, we create a polar plot with a gradient fill. Here’s how it works:
- We generate data for a polar plot using sine function.
- We create a custom colormap for our gradient.
- We use a loop to fill small wedges of the polar plot, each with a slightly different color from our gradient.
This technique results in a polar plot where the color transitions smoothly around the circle, creating a visually appealing representation of the data.
Gradient Fill in Stacked Area Charts
Gradient fills can be particularly effective in stacked area charts to distinguish between different categories while maintaining a cohesive look. Here’s an example:
import numpy as np
import matplotlib.pyplot as plt
from matplotlib.colors import LinearSegmentedColormap

# Create data
x = np.linspace(0, 10, 100)
y1 = np.exp(-x/10) * np.sin(x)
y2 = np.exp(-x/10) * np.cos(x)
y3 = np.exp(-x/5)

# Create custom colormaps
cmap1 = LinearSegmentedColormap.from_list('Custom1', ['#ff9999', '#ff3333'], N=100)
cmap2 = LinearSegmentedColormap.from_list('Custom2', ['#99ff99', '#33ff33'], N=100)
cmap3 = LinearSegmentedColormap.from_list('Custom3', ['#9999ff', '#3333ff'], N=100)

# Create the plot
fig, ax = plt.subplots(figsize=(12, 8))

# Create gradient-filled stacked area chart
for i in range(100):
    ax.fill_between(x, 0, y1, where=(x >= i*0.1) & (x < (i+1)*0.1), color=cmap1(i/100), alpha=0.7)
    ax.fill_between(x, y1, y1+y2, where=(x >= i*0.1) & (x < (i+1)*0.1), color=cmap2(i/100), alpha=0.7)
    ax.fill_between(x, y1+y2, y1+y2+y3, where=(x >= i*0.1) & (x < (i+1)*0.1), color=cmap3(i/100), alpha=0.7)

ax.set_title('Gradient Fill in Stacked Area Chart - how2matplotlib.com', fontsize=16)
ax.set_xlabel('X-axis', fontsize=12)
ax.set_ylabel('Y-axis', fontsize=12)

plt.text(5, 1.5, 'Visit how2matplotlib.com for more examples', ha='center', va='center', fontsize=10)
plt.tight_layout()
plt.show()
Output:
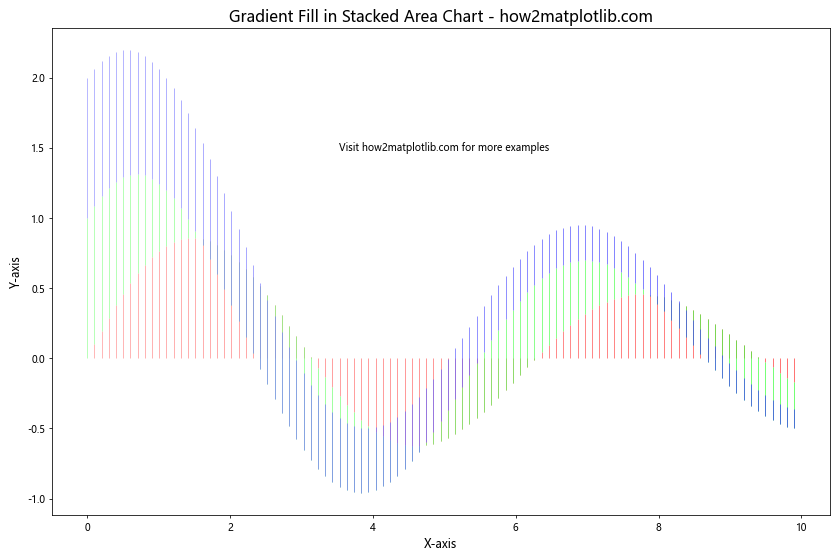
In this example, we create a stacked area chart with gradient fills for each area. Here's how it works:
- We generate data for three different areas.
- We create custom colormaps for each area.
- We use nested loops to fill small sections of each area, gradually changing the color to create the gradient effect.
This technique results in a stacked area chart where each area has its own gradient fill, creating a visually appealing and easily distinguishable representation of the data.
Gradient Fill in Streamplots
Streamplots can also benefit from gradient fills to represent the magnitude of the vector field. Here's an example:
import numpy as np
import matplotlib.pyplot as plt

# Create data
Y, X = np.mgrid[-3:3:100j, -3:3:100j]
U = -1 - X**2 + Y
V = 1 + X - Y**2
speed = np.sqrt(U**2 + V**2)

# Create the plot
fig, ax = plt.subplots(figsize=(10, 8))

# Create gradient-filled streamplot
strm = ax.streamplot(X, Y, U, V, color=speed, cmap='viridis', linewidth=2, density=1)

ax.set_title('Gradient Fill in Streamplot - how2matplotlib.com', fontsize=16)
ax.set_xlabel('X-axis', fontsize=12)
ax.set_ylabel('Y-axis', fontsize=12)

# Add colorbar
cbar = fig.colorbar(strm.lines)
cbar.set_label('Speed', fontsize=12)

plt.text(0, -3.5, 'Visit how2matplotlib.com for more examples', ha='center', va='center', fontsize=10)
plt.tight_layout()
plt.show()
Output:
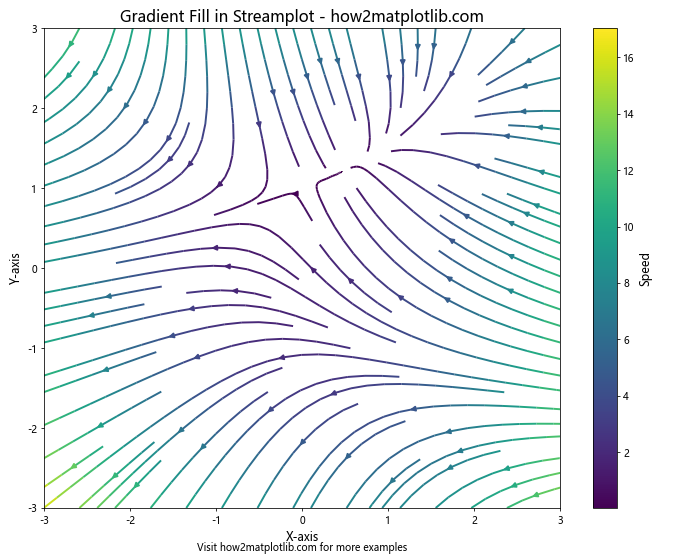
In this example, we create a streamplot with gradient-colored streamlines. Here's how it works:
- We generate vector field data (U and V) and calculate the speed.
- We use
ax.streamplot()to create the streamplot, setting the color parameter to the speed and specifying a colormap. - We add a colorbar to show the gradient scale.
This technique results in a streamplot where the color of each streamline represents its speed, creating a visually informative representation of the vector field.
Gradient Fill Color in Matplotlib Conclusion
Gradient fill colors in Matplotlib offer a powerful way to enhance the visual appeal and information content of your plots. From simple area plots to complex 3D surfaces, gradients can be applied in various ways to create stunning visualizations.
In this comprehensive guide, we've explored numerous techniques for implementing gradient fill colors across different types of plots. We've seen how gradients can be used to represent additional dimensions of data, enhance depth perception, and create visually striking effects.
Some key takeaways include:
- Custom colormaps can be created using
LinearSegmentedColormap.from_list()for precise control over gradient colors. - Gradients can be applied to various plot elements including areas, bars, backgrounds, and individual points.
- For complex gradients, multiple
fill_between()calls orimshow()can be used to create smooth transitions. - 3D plots and specialized plots like polar charts and streamplots can also benefit from gradient fills.
Remember, while gradient fills can greatly enhance your plots, it's important to use them judiciously. The primary goal should always be to clearly communicate your data. Gradients should enhance, not obscure, the information in your visualizations.
As you continue to explore Matplotlib, experiment with these techniques and combine them in creative ways to develop your own unique and informative data visualizations. The possibilities are endless, and with practice, you'll be creating professional-grade plots that effectively communicate your data insights.