How to Add Text to Matplotlib
How to add text to Matplotlib is an essential skill for creating informative and visually appealing data visualizations. Matplotlib is a powerful Python library that allows you to add various types of text elements to your plots, including titles, labels, annotations, and more. In this comprehensive guide, we’ll explore the different ways to add text to Matplotlib plots, providing detailed explanations and easy-to-understand examples along the way.
Understanding the Basics of Adding Text to Matplotlib
Before we dive into the specifics of how to add text to Matplotlib, it’s important to understand the basic concepts and components involved. Matplotlib provides several functions and methods for adding text to different parts of a plot. These include:
plt.title(): Adds a title to the entire figureplt.xlabel()andplt.ylabel(): Add labels to the x and y axesplt.text(): Adds text at specific coordinates within the plotplt.annotate(): Adds annotations with optional arrowsax.set_title(),ax.set_xlabel(), andax.set_ylabel(): Axis-specific methods for adding titles and labels
Let’s start with a simple example of how to add text to Matplotlib using these basic functions:
import matplotlib.pyplot as plt

# Create a simple plot
plt.plot([1, 2, 3, 4], [1, 4, 2, 3])

# Add title and axis labels
plt.title("How to Add Text to Matplotlib - Basic Example")
plt.xlabel("X-axis Label")
plt.ylabel("Y-axis Label")

# Add text within the plot
plt.text(2, 3, "This is how to add text to Matplotlib")

plt.show()
Output:
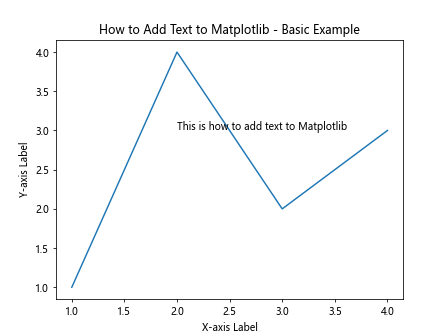
In this example, we’ve demonstrated how to add text to Matplotlib using the basic functions. We’ve added a title to the plot, labels for both axes, and a text element within the plot area. This gives you a good starting point for understanding how to add text to Matplotlib.
Adding Titles and Labels to Matplotlib Plots
One of the most common tasks when learning how to add text to Matplotlib is adding titles and labels to your plots. These elements provide context and help viewers understand the data being presented. Let’s explore some more advanced techniques for adding titles and labels:
Customizing Title Appearance
When adding a title to your Matplotlib plot, you can customize its appearance using various parameters. Here’s an example of how to add text to Matplotlib with a customized title:
import matplotlib.pyplot as plt

plt.figure(figsize=(10, 6))
plt.plot([1, 2, 3, 4], [1, 4, 2, 3])

plt.title("How to Add Text to Matplotlib - Customized Title",
          fontsize=16,
          fontweight='bold',
          color='navy',
          loc='left',
          pad=20)

plt.xlabel("X-axis")
plt.ylabel("Y-axis")

plt.text(2, 2, "Visit how2matplotlib.com for more examples", fontsize=12)

plt.show()
Output:
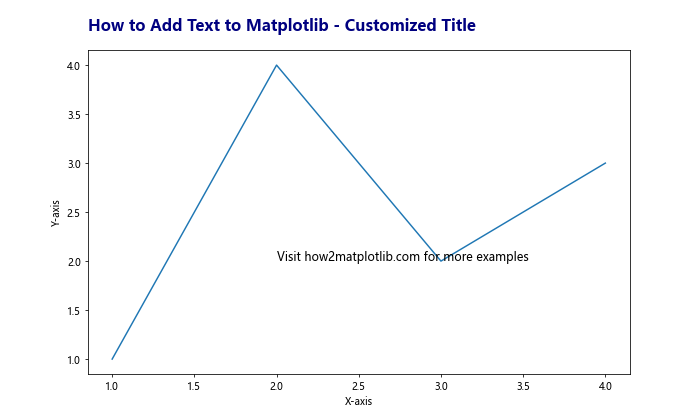
In this example, we’ve customized the title’s font size, weight, color, position, and padding. This demonstrates how to add text to Matplotlib with more control over its appearance.
Multi-line Titles and Labels
Sometimes, you may need to add multi-line text to your Matplotlib plots. Here’s how you can achieve this:
import matplotlib.pyplot as plt

plt.figure(figsize=(10, 6))
plt.plot([1, 2, 3, 4], [1, 4, 2, 3])

plt.title("How to Add Text to Matplotlib\nMulti-line Title Example", fontsize=14)
plt.xlabel("X-axis\n(Units)", fontsize=12)
plt.ylabel("Y-axis\n(Values)", fontsize=12)

plt.text(2, 2, "Learn more at\nhow2matplotlib.com", ha='center', va='center')

plt.show()
Output:
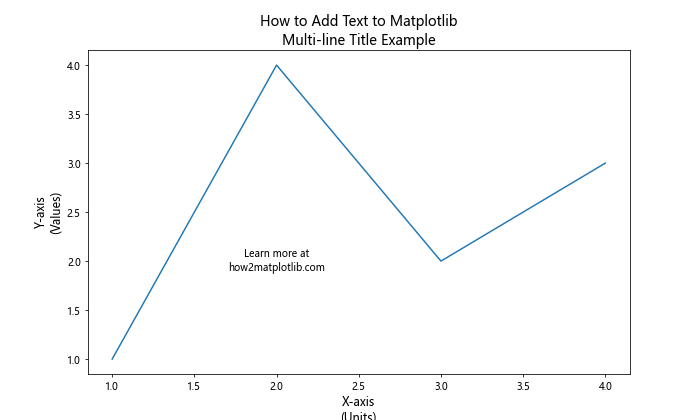
In this example, we’ve used the newline character (\n) to create multi-line titles and labels. This technique is useful when you need to provide more detailed information in your text elements.
Using plt.text() to Add Text to Specific Locations
The plt.text() function is a versatile tool for adding text to specific locations within your Matplotlib plot. Let’s explore some advanced techniques for using this function:
Positioning Text with Data Coordinates
When using plt.text(), you can specify the position of the text using data coordinates. This is particularly useful when you want to add text relative to specific data points:
import matplotlib.pyplot as plt
import numpy as np

x = np.linspace(0, 10, 100)
y = np.sin(x)

plt.figure(figsize=(10, 6))
plt.plot(x, y)

plt.title("How to Add Text to Matplotlib - Positioning with Data Coordinates")
plt.xlabel("X-axis")
plt.ylabel("Y-axis")

# Add text at specific data coordinates
plt.text(np.pi, 0, "π", fontsize=16, ha='center', va='center')
plt.text(2*np.pi, 0, "2π", fontsize=16, ha='center', va='center')
plt.text(5, 0.5, "Visit how2matplotlib.com", rotation=15, fontsize=12)

plt.show()
Output:
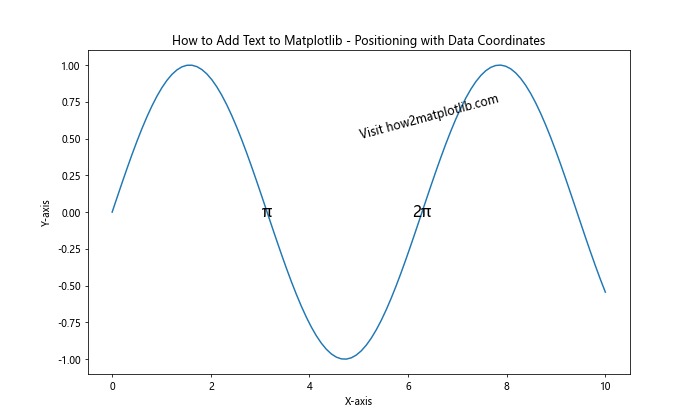
In this example, we’ve added text at specific data coordinates, including labels for π and 2π, as well as a rotated text element. This demonstrates how to add text to Matplotlib with precise positioning.
Using Text Boxes and Fancy Boxes
Matplotlib allows you to add text within boxes, which can help highlight important information. Here’s an example of how to add text to Matplotlib using text boxes:
import matplotlib.pyplot as plt
from matplotlib.patches import FancyBboxPatch

plt.figure(figsize=(10, 6))
plt.plot([1, 2, 3, 4], [1, 4, 2, 3])

plt.title("How to Add Text to Matplotlib - Text Boxes")
plt.xlabel("X-axis")
plt.ylabel("Y-axis")

# Add a simple text box
plt.text(2, 3, "Simple Text Box", bbox=dict(facecolor='white', edgecolor='black', boxstyle='round,pad=0.5'))

# Add a fancy text box
fancy_box = FancyBboxPatch((1.5, 1.5), 1, 0.5, boxstyle="round,pad=0.1,rounding_size=0.2",
                           ec="navy", fc="lightblue", alpha=0.8)
plt.gca().add_patch(fancy_box)
plt.text(2, 1.75, "Fancy Box\nhow2matplotlib.com", ha='center', va='center')

plt.show()
Output:
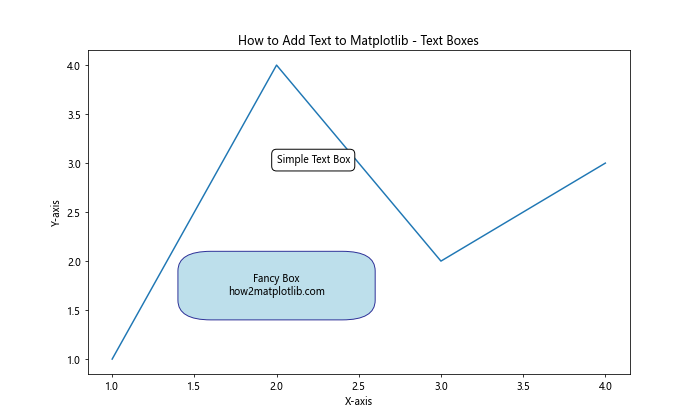
This example demonstrates how to add text to Matplotlib using both simple and fancy text boxes. These techniques can be useful for highlighting key information or adding legends to your plots.
Adding Annotations with plt.annotate()
Annotations are a powerful way to add explanatory text to your Matplotlib plots. The plt.annotate() function allows you to add text with optional arrows pointing to specific data points. Let’s explore some examples of how to add text to Matplotlib using annotations:
Basic Annotations
Here’s a simple example of how to add annotations to a Matplotlib plot:
import matplotlib.pyplot as plt
import numpy as np

x = np.linspace(0, 10, 100)
y = np.sin(x)

plt.figure(figsize=(10, 6))
plt.plot(x, y)

plt.title("How to Add Text to Matplotlib - Basic Annotations")
plt.xlabel("X-axis")
plt.ylabel("Y-axis")

# Add annotations
plt.annotate("Maximum", xy=(np.pi/2, 1), xytext=(np.pi/2, 1.2),
             arrowprops=dict(facecolor='black', shrink=0.05))

plt.annotate("Minimum", xy=(3*np.pi/2, -1), xytext=(3*np.pi/2, -1.2),
             arrowprops=dict(facecolor='black', shrink=0.05))

plt.annotate("Visit how2matplotlib.com", xy=(5, 0), xytext=(6, 0.5),
             arrowprops=dict(facecolor='red', shrink=0.05))

plt.show()
Output:
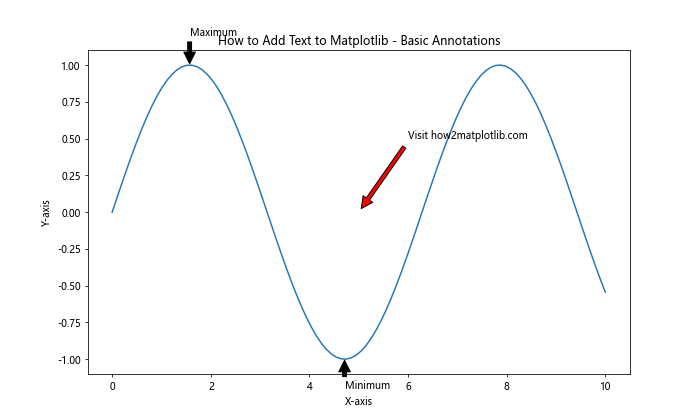
In this example, we’ve added three annotations to highlight the maximum and minimum points of the sine wave, as well as a promotional annotation. This demonstrates how to add text to Matplotlib with arrows pointing to specific features of your plot.
Customizing Annotation Appearance
You can customize the appearance of annotations to make them more visually appealing and informative. Here’s an example of how to add text to Matplotlib with customized annotations:
import matplotlib.pyplot as plt
import numpy as np

x = np.linspace(0, 10, 100)
y = np.exp(-x/10) * np.cos(2*np.pi*x)

plt.figure(figsize=(12, 6))
plt.plot(x, y)

plt.title("How to Add Text to Matplotlib - Customized Annotations")
plt.xlabel("X-axis")
plt.ylabel("Y-axis")

# Add customized annotations
plt.annotate("Exponential decay", xy=(5, 0), xytext=(6, 0.5),
             arrowprops=dict(facecolor='red', shrink=0.05, width=2, headwidth=8),
             bbox=dict(boxstyle="round,pad=0.3", fc="yellow", ec="orange", alpha=0.8),
             fontsize=12, fontweight='bold')

plt.annotate("Oscillation", xy=(2, 0.5), xytext=(3, 0.8),
             arrowprops=dict(arrowstyle="->", connectionstyle="arc3,rad=.2"),
             bbox=dict(boxstyle="round4,pad=0.3", fc="lightblue", ec="blue", alpha=0.8),
             fontsize=12, fontweight='bold')

plt.annotate("Visit how2matplotlib.com\nfor more examples", xy=(8, -0.5), xytext=(7, -0.8),
             arrowprops=dict(arrowstyle="fancy", fc="green", ec="none", connectionstyle="angle3,angleA=0,angleB=-90"),
             bbox=dict(boxstyle="square,pad=0.3", fc="white", ec="green", alpha=0.8),
             fontsize=10, ha='center')

plt.show()
Output:
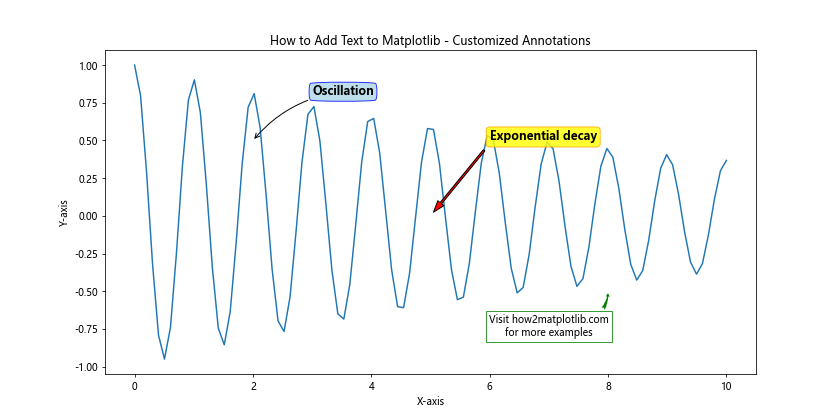
This example demonstrates how to add text to Matplotlib with highly customized annotations. We’ve used different arrow styles, connection styles, and text box styles to create visually appealing and informative annotations.
Adding Text to Multiple Subplots
When creating complex visualizations, you may need to add text to multiple subplots. Matplotlib provides several ways to accomplish this. Let’s explore some examples of how to add text to Matplotlib when working with subplots:
Adding Titles and Labels to Subplots
Here’s an example of how to add text to Matplotlib subplots using both the plt and ax interfaces:
import matplotlib.pyplot as plt
import numpy as np

fig, (ax1, ax2) = plt.subplots(1, 2, figsize=(12, 5))

x = np.linspace(0, 10, 100)
y1 = np.sin(x)
y2 = np.cos(x)

ax1.plot(x, y1)
ax2.plot(x, y2)

# Add main title
fig.suptitle("How to Add Text to Matplotlib - Subplots Example", fontsize=16)

# Add titles and labels to subplots
ax1.set_title("Sine Wave")
ax1.set_xlabel("X-axis")
ax1.set_ylabel("Y-axis")

ax2.set_title("Cosine Wave")
ax2.set_xlabel("X-axis")
ax2.set_ylabel("Y-axis")

# Add text to subplots
ax1.text(5, 0, "Sin(x)", fontsize=14, ha='center')
ax2.text(5, 0, "Cos(x)", fontsize=14, ha='center')

# Add a common text
fig.text(0.5, 0.01, "Visit how2matplotlib.com for more examples", ha='center', fontsize=12)

plt.tight_layout()
plt.show()
Output:
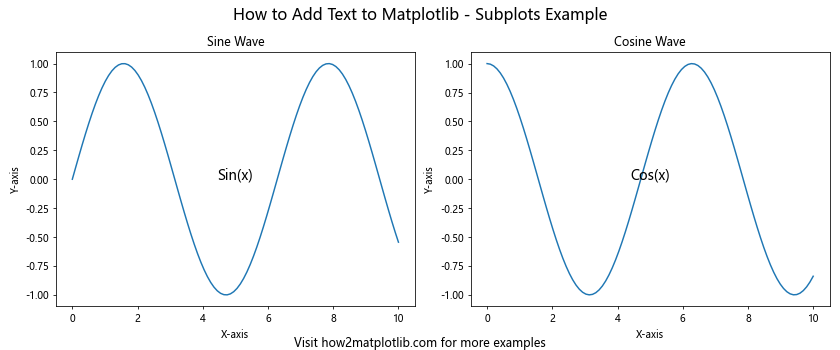
This example demonstrates how to add text to Matplotlib when working with subplots. We’ve added a main title, individual subplot titles and labels, and text elements within each subplot.
Using GridSpec for Complex Layouts
For more complex layouts, you can use GridSpec to create custom subplot arrangements. Here’s an example of how to add text to Matplotlib using GridSpec:
import matplotlib.pyplot as plt
import matplotlib.gridspec as gridspec
import numpy as np

fig = plt.figure(figsize=(12, 8))
gs = gridspec.GridSpec(2, 3)

ax1 = fig.add_subplot(gs[0, :2])
ax2 = fig.add_subplot(gs[0, 2])
ax3 = fig.add_subplot(gs[1, :])

x = np.linspace(0, 10, 100)
y1 = np.sin(x)
y2 = np.cos(x)
y3 = np.tan(x)

ax1.plot(x, y1)
ax2.plot(x, y2)
ax3.plot(x, y3)

fig.suptitle("How to Add Text to Matplotlib - GridSpec Example", fontsize=16)

ax1.set_title("Sine Wave")
ax2.set_title("Cosine Wave")
ax3.set_title("Tangent Wave")

for ax in [ax1, ax2, ax3]:
    ax.set_xlabel("X-axis")
    ax.set_ylabel("Y-axis")

ax1.text(5, 0, "Sin(x)", fontsize=14, ha='center')
ax2.text(5, 0, "Cos(x)", fontsize=14, ha='center')
ax3.text(5, 0, "Tan(x)", fontsize=14, ha='center')

fig.text(0.5, 0.02, "Learn how to add text to Matplotlib at how2matplotlib.com", ha='center', fontsize=12)

plt.tight_layout()
plt.show()
Output:
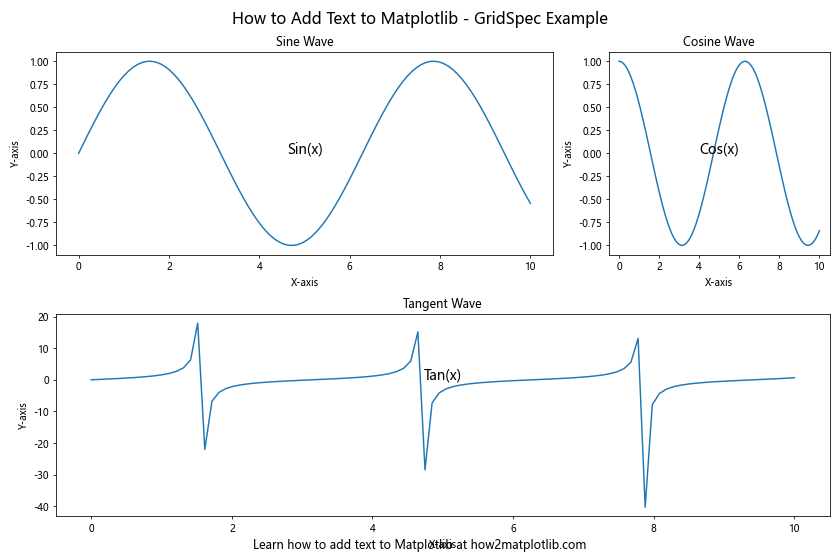
This example shows how to add text to Matplotlib using GridSpec for a more complex subplot layout. We’ve created a custom arrangement of subplots and added text elements to each one.
Advanced Text Formatting Techniques
Matplotlib offers several advanced techniques for formatting text, allowing you to create more visually appealing and informative plots. Let’s explore some of these techniques for how to add text to Matplotlib:
Using LaTeX Formatting
Matplotlib supports LaTeX formatting for text elements, which is particularly useful for adding mathematical equations to your plots. Here’s an example of how to add text to Matplotlib using LaTeX formatting:
import matplotlib.pyplot as plt
import numpy as np

plt.figure(figsize=(10, 6))
x = np.linspace(-2*np.pi, 2*np.pi, 100)
y = np.sin(x)
plt.plot(x, y)

plt.title(r"How to Add Text to Matplotlib - LaTeX Example: $f(x) = \sin(x)$", fontsize=16)
plt.xlabel(r"$x$")
plt.ylabel(r"$f(x)$")

plt.text(0, 0.5, r"$\int_{-\infty}^{\infty} e^{-x^2} dx = \sqrt{\pi}$", fontsize=14, bbox=dict(facecolor='white', alpha=0.8))
plt.text(0, -0.5, r"Visit $\texttt{how2matplotlib.com}$ for more examples", fontsize=12)

plt.show()
This example demonstrates how to add text to Matplotlib using LaTeX formatting. We’ve added a title with a mathematical function, axis labels using LaTeX symbols, and a text box containing a complex mathematical equation.
Using Custom Fonts
Matplotlib allows you to use custom fonts for your text elements. Here’s an example of how to add text to Matplotlib using custom fonts:
import matplotlib.pyplot as plt
from matplotlib import font_manager

# Add a custom font
font_path = '/path/to/your/custom/font.ttf'  # Replace with your font path
font_manager.fontManager.addfont(font_path)
custom_font = font_manager.FontProperties(fname=font_path)

plt.figure(figsize=(10, 6))
plt.plot([1, 2, 3, 4], [1, 4, 2, 3])

plt.title("How to Add Text to Matplotlib - Custom Font Example", fontproperties=custom_font, fontsize=16)
plt.xlabel("X-axis", fontproperties=custom_font)
plt.ylabel("Y-axis", fontproperties=custom_font)

plt.text(2, 3, "This text uses a custom font", fontproperties=custom_font, fontsize=14)
plt.text(2, 2, "Visit how2matplotlib.com", fontsize=12)

plt.show()
In this example, we’ve demonstrated how to add text to Matplotlib using a custom font. You’ll need to replace the font_path variable with the path to your desired font file.
Using Text with Transparency
Adding transparency to text elements can help them blend better with your plot. Here’s an example of how to add text to Matplotlib with transparency:
import matplotlib.pyplot as plt
import numpy as np

plt.figure(figsize=(10, 6))
x = np.linspace(0, 10, 100)
y = np.sin(x)
plt.plot(x, y)

plt.title("How to Add Text to Matplotlib - Transparent Text Example", fontsize=16)
plt.xlabel("X-axis")
plt.ylabel("Y-axis")

plt.text(5, 0.5, "Transparent Text", fontsize=40, color='red', alpha=0.3, ha='center', va='center')
plt.text(5, -0.5, "Visit how2matplotlib.com", fontsize=12, alpha=0.7, ha='center', va='center')

plt.show()
Output:
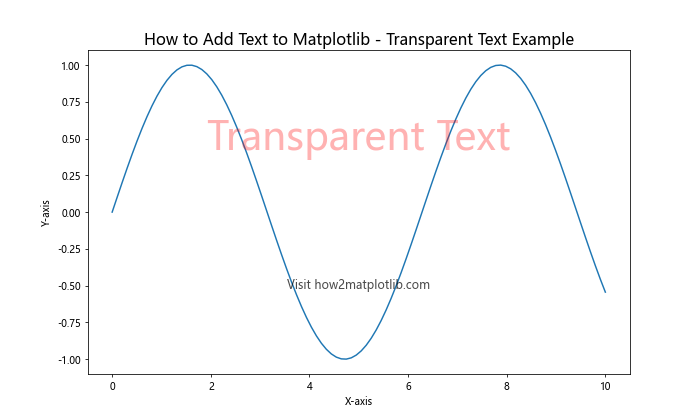
This example shows how to add text to Matplotlib with varying levels of transparency using the alpha parameter.
Adding Text to Different Plot Types
Matplotlib supports various types of plots, and knowing how to add text to each type is essential. Let’s explore how to add text to Matplotlib for different plot types:
Adding Text to Bar Charts
Bar charts often require labels and annotations to provide context. Here’s an example of how to add text to Matplotlib bar charts:
import matplotlib.pyplot as plt
import numpy as np

categories = ['A', 'B', 'C', 'D']
values = [3, 7, 2, 5]

plt.figure(figsize=(10, 6))
bars = plt.bar(categories, values)

plt.title("How to Add Text to Matplotlib - Bar Chart Example", fontsize=16)
plt.xlabel("Categories")
plt.ylabel("Values")

# Add value labels on top of each bar
for bar in bars:
    height = bar.get_height()
    plt.text(bar.get_x() + bar.get_width()/2, height, f'{height}',
             ha='center', va='bottom')

plt.text(1.5, 6, "Visit how2matplotlib.com\nfor more examples", ha='center', va='center', bbox=dict(facecolor='white', edgecolor='black', alpha=0.7))

plt.show()
Output:
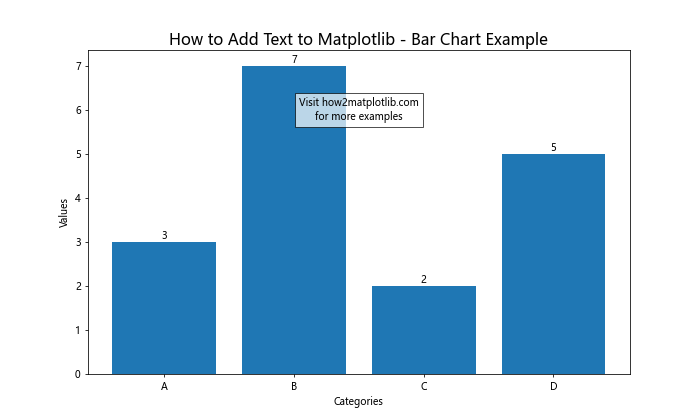
This example demonstrates how to add text to Matplotlib bar charts, including value labels on top of each bar and a text box with additional information.
Adding Text to Scatter Plots
Scatter plots often benefit from annotations to highlight specific data points. Here’s an example of how to add text to Matplotlib scatter plots:
import matplotlib.pyplot as plt
import numpy as np

np.random.seed(42)
x = np.random.rand(20)
y = np.random.rand(20)

plt.figure(figsize=(10, 6))
plt.scatter(x, y)

plt.title("How to Add Text to Matplotlib - Scatter Plot Example", fontsize=16)
plt.xlabel("X-axis")
plt.ylabel("Y-axis")

# Add labels to some points
for i, (x_val, y_val) in enumerate(zip(x, y)):
    if i % 5 == 0:
        plt.annotate(f'Point {i}', (x_val, y_val), xytext=(5, 5), textcoords='offset points')

plt.text(0.5, 0.95, "Learn how to add text to Matplotlib\nat how2matplotlib.com", ha='center', va='top', transform=plt.gca().transAxes, bbox=dict(facecolor='white', edgecolor='black', alpha=0.7))

plt.show()
Output:
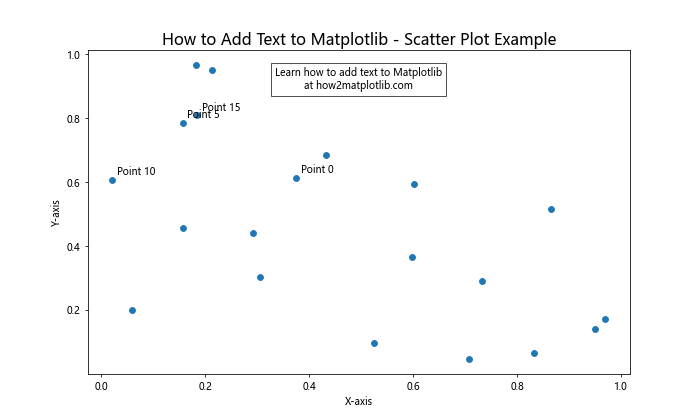
This example shows how to add text to Matplotlib scatter plots, including annotations for specific data points and a text box with additional information.
Adding Text to Pie Charts
Pie charts often require labels and percentages to be added directly to the chart. Here’s an example of how to add text to Matplotlib pie charts:
import matplotlib.pyplot as plt

sizes = [30, 25, 20, 15, 10]
labels = ['A', 'B', 'C', 'D', 'E']
colors = ['#ff9999', '#66b3ff', '#99ff99', '#ffcc99', '#ff99cc']

plt.figure(figsize=(10, 8))
wedges, texts, autotexts = plt.pie(sizes, labels=labels, colors=colors, autopct='%1.1f%%', startangle=90)

plt.title("How to Add Text to Matplotlib - Pie Chart Example", fontsize=16)

# Enhance the appearance of percentage labels
for autotext in autotexts:
    autotext.set_color('white')
    autotext.set_fontweight('bold')

plt.text(-1.3, -1.3, "Visit how2matplotlib.com\nfor more examples", ha='left', va='bottom', bbox=dict(facecolor='white', edgecolor='black', alpha=0.7))

plt.axis('equal')
plt.show()
Output:
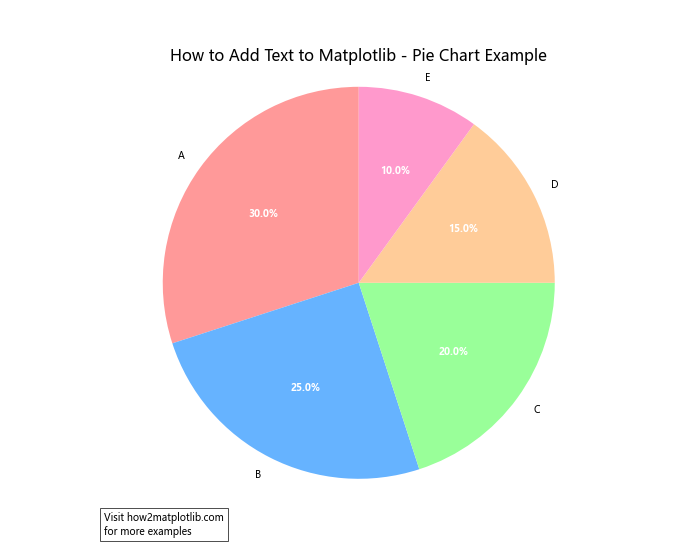
This example demonstrates how to add text to Matplotlib pie charts, including percentage labels and a text box with additional information.
Best Practices for Adding Text to Matplotlib
When learning how to add text to Matplotlib, it’s important to follow best practices to ensure your visualizations are clear, informative, and visually appealing. Here are some tips to keep in mind:
- Keep it concise: Use short, descriptive text that conveys information quickly.
- Choose appropriate font sizes: Ensure your text is readable but not overpowering.
- Use consistent styling: Maintain a consistent style for similar text elements throughout your plot.
- Consider color contrast: Ensure your text is easily readable against the background.
- Avoid clutter: Don’t overcrowd your plot with too much text.
- Use annotations wisely: Add annotations to highlight important data points or features.
- Leverage LaTeX for equations: Use LaTeX formatting for mathematical equations and symbols.
- Test for readability: View your plot at different sizes to ensure text remains readable.
Here’s an example that demonstrates these best practices for how to add text to Matplotlib:
import matplotlib.pyplot as plt
import numpy as np

plt.figure(figsize=(12, 8))

x = np.linspace(0, 10, 100)
y1 = np.sin(x)
y2 = np.cos(x)

plt.plot(x, y1, label='sin(x)')
plt.plot(x, y2, label='cos(x)')

plt.title("How to Add Text to Matplotlib: Best Practices Example", fontsize=16, fontweight='bold')
plt.xlabel("X-axis", fontsize=12)
plt.ylabel("Y-axis", fontsize=12)

plt.text(5, 0.7, "Key Features:", fontsize=14, fontweight='bold')
plt.text(5, 0.5, "• Concise labels\n• Consistent styling\n• Appropriate font sizes\n• Good color contrast", fontsize=12, va='top')

plt.annotate("Maximum", xy=(np.pi/2, 1), xytext=(np.pi/2, 1.2),
             arrowprops=dict(facecolor='black', shrink=0.05),
             fontsize=10, ha='center')

plt.text(8, -0.5, r"$\int_{0}^{\pi} \sin(x) dx = 2$", fontsize=12, bbox=dict(facecolor='white', edgecolor='black', alpha=0.7))

plt.legend(loc='lower right')

plt.text(0.5, -0.15, "Visit how2matplotlib.com for more examples on how to add text to Matplotlib",
         ha='center', va='center', transform=plt.gca().transAxes, fontsize=10, style='italic')

plt.tight_layout()
plt.show()
Output:
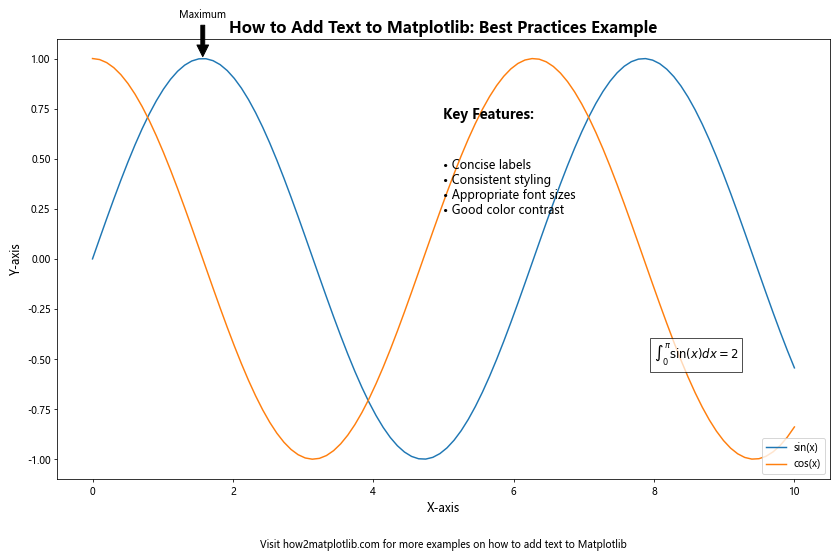
This example incorporates various best practices for how to add text to Matplotlib, including concise labels, consistent styling, appropriate font sizes, and good use of annotations and mathematical formatting.
Troubleshooting Common Issues
When learning how to add text to Matplotlib, you may encounter some common issues. Here are some problems you might face and how to solve them:
- Text overlapping: If text elements overlap, try adjusting their positions or using the
haandvaparameters to align them differently. Text cut off: Ensure you have enough space in your plot by adjusting the figure size or using
plt.tight_layout().Incorrect font: If custom fonts aren’t displaying correctly, double-check the font file path and ensure it’s installed on your system.
LaTeX errors: When using LaTeX formatting, make sure you have a LaTeX distribution installed and use raw strings (r””) for LaTeX content.
Text not showing: Check that your text color contrasts with the background and that the
zorderof your text is higher than other plot elements.
Here’s an example that demonstrates solutions to these common issues: