Horizontal Line in Matplotlib
Matplotlib is a powerful library in Python for creating visualizations. Horizontal lines are useful for adding references or highlighting specific values on a plot. In this article, we will explore how to add horizontal lines to a Matplotlib plot.
Basic Horizontal Line
Let’s start by creating a simple plot and adding a horizontal line at y = 0. We can use the axhline method from Matplotlib’s pyplot module to achieve this.
import matplotlib.pyplot as plt

plt.plot([1, 2, 3, 4], [1, 4, 9, 16])
plt.axhline(y=0, color='r', linestyle='--')
plt.show()
Output:
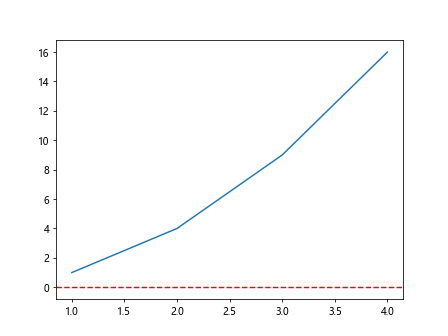
In this example, we are plotting a simple line plot and adding a horizontal line at y = 0 in red color with a dashed line style. The axhline function takes parameters like y, color, and linestyle to customize the appearance of the horizontal line.
Multiple Horizontal Lines
We can also add multiple horizontal lines to a plot by calling the axhline function multiple times. Let’s add horizontal lines at y = 5 and y = 10 to the same plot.
import matplotlib.pyplot as plt

plt.plot([1, 2, 3, 4], [1, 4, 9, 16])
plt.axhline(y=5, color='b', linestyle='-.')
plt.axhline(y=10, color='g', linestyle=':')
plt.show()
Output:
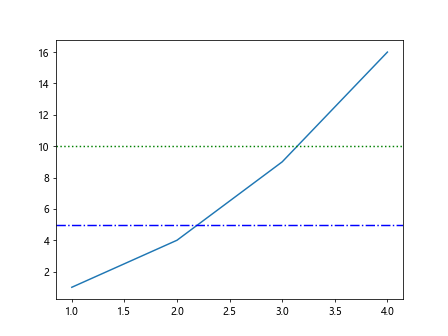
In this example, we have added two horizontal lines at y = 5 and y = 10 with different colors and line styles. This shows how you can customize and add multiple horizontal lines to your plot.
Adjusting Line Properties
We can further customize the horizontal lines by adjusting their line width, transparency, and other properties. Let’s add a horizontal line with a thicker line width and higher transparency.
import matplotlib.pyplot as plt

plt.plot([1, 2, 3, 4], [1, 4, 9, 16])
plt.axhline(y=0, color='purple', linewidth=2, alpha=0.5)
plt.show()
Output:
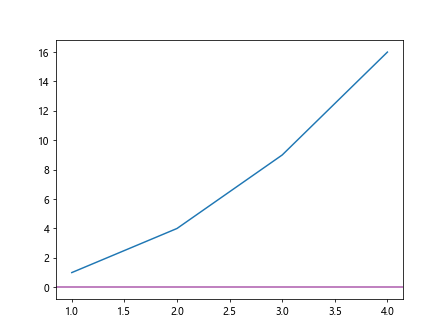
In this example, we have increased the line width to 2 and set the transparency to 0.5 for the horizontal line at y = 0. This allows you to control the appearance of the horizontal lines based on your requirements.
Adding Horizontal Lines to Subplots
If you are working with subplots in Matplotlib, you can add horizontal lines to specific subplots as well. Let’s create two subplots and add horizontal lines to each of them.
import matplotlib.pyplot as plt

fig, (ax1, ax2) = plt.subplots(1, 2)

ax1.plot([1, 2, 3, 4], [1, 4, 9, 16])
ax1.axhline(y=0, color='r', linestyle='--')

ax2.plot([1, 2, 3, 4], [1, 8, 27, 64])
ax2.axhline(y=10, color='b', linestyle='-.')

plt.show()
Output:
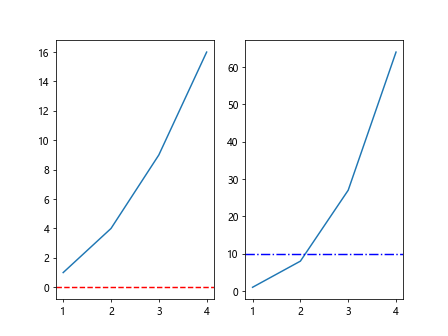
In this example, we are creating two subplots and adding horizontal lines to each of them. This demonstrates how you can add horizontal lines to specific subplots within a larger plot.
Customizing Horizontal Lines
You can further customize the horizontal lines by changing their position, color, style, and other properties dynamically based on your data. Let’s add horizontal lines at specific y-values based on a condition.
import matplotlib.pyplot as plt

data = [3, 5, 8, 2, 10, 6]
threshold = 5

plt.plot(data)

for val in data:
    if val > threshold:
        plt.axhline(y=val, color='r', linestyle='--')
    else:
        plt.axhline(y=val, color='b', linestyle='-.')

plt.show()
Output:
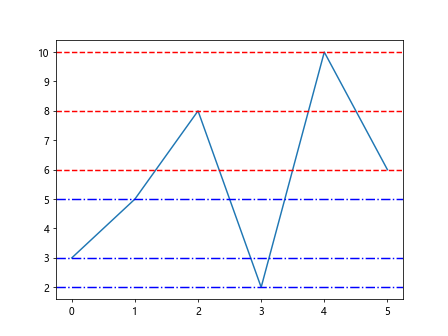
In this example, we are plotting a line chart of data and adding horizontal lines at each value based on a threshold condition. This shows how you can dynamically customize horizontal lines based on your data.
Adding Annotations with Horizontal Lines
Horizontal lines can be used to annotate specific points or ranges on a plot. Let’s add annotations to a plot using horizontal lines.
import matplotlib.pyplot as plt

plt.plot([1, 2, 3, 4], [1, 4, 9, 16])
plt.axhline(y=5, color='b', linestyle='-.')
plt.annotate('Threshold', xy=(2, 5), xytext=(3, 6), arrowprops=dict(facecolor='black', shrink=0.05))
plt.show()
Output:
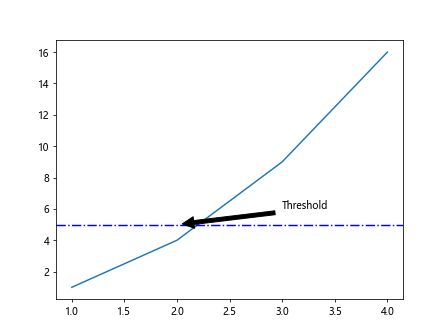
In this example, we have added an annotation “Threshold” at the point (2, 5) on the plot using a horizontal line and an arrow. This demonstrates how you can combine horizontal lines with annotations to highlight specific points on the plot.
Using Horizontal Lines for Reference Lines
Horizontal lines are commonly used as reference lines in visualizations to compare data points against a fixed value. Let’s create a scatter plot with a horizontal reference line for comparison.
import matplotlib.pyplot as plt
import numpy as np

x = np.arange(1, 6)
y = np.random.randint(1, 10, size=5)

plt.scatter(x, y)
plt.axhline(y=np.mean(y), color='r', linestyle='--', label='Mean')
plt.legend()
plt.show()
Output:
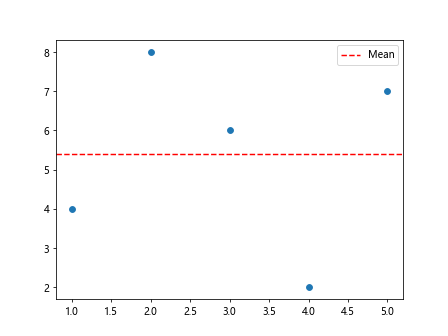
In this example, we are plotting a scatter plot of x and y values and adding a horizontal reference line at the mean of y using the axhline function. This allows you to visually compare the data points against the reference line.
Interactive Plot with Horizontal Lines
You can create interactive plots with horizontal lines using libraries like plotly in Python. Let’s create an interactive line plot with horizontal lines using plotly.
import plotly.graph_objects as go

x = [1, 2, 3, 4]
y = [1, 4, 9, 16]

fig = go.Figure()
fig.add_trace(go.Scatter(x=x, y=y, mode='lines'))

fig.add_shape(type='line', x0=min(x), x1=max(x), y0=5, y1=5, line=dict(color='red', width=2))

fig.show()
In this example, we are creating an interactive line plot using plotly and adding a horizontal line at y = 5 using the add_shape method. This allows you to create interactive visualizations with horizontal lines for better data exploration.
Horizontal Line in Matplotlib Conclusion
Adding horizontal lines to Matplotlib plots is a useful technique for highlighting specific values, creating reference lines, and annotating points on a plot. By customizing the properties of horizontal lines, you can enhance the visual appearance of your plots and convey information effectively. Experiment with different styles, colors, and positions of horizontal lines to create visually appealing and informative plots in Matplotlib.