Matplotlib Clear Plot
Matplotlib is a widely used visualization library in Python that allows users to create various types of plots. However, sometimes we may want to clear a plot before creating a new one. In this article, we will explore different ways to clear plots in Matplotlib.
Method 1: Using plt.clf()
The plt.clf() function in Matplotlib can be used to clear the current figure. Let’s see an example:
import matplotlib.pyplot as plt
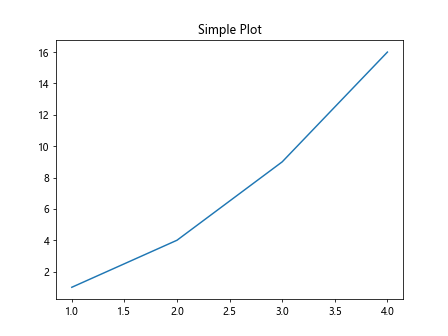
# Create a simple plot
plt.plot([1, 2, 3, 4], [1, 4, 9, 16])
plt.title("Simple Plot")
plt.show()
# Clear the plot using plt.clf()
plt.clf()
Output:
After running the code above, you will notice that the previously created plot is cleared.
Method 2: Using plt.cla()
The plt.cla() function in Matplotlib can be used to clear the current axes. Let’s see an example:
import matplotlib.pyplot as plt

# Create a simple plot
plt.plot([1, 2, 3, 4], [1, 4, 9, 16])
plt.title("Simple Plot")
plt.show()

# Clear the axes using plt.cla()
plt.cla()
Output:

After running the code above, you will notice that the data plotted on the axes is cleared, but the figure remains.
Method 3: Using plt.close()
The plt.close() function in Matplotlib can be used to close the current figure. Let’s see an example:
import matplotlib.pyplot as plt

# Create a simple plot
plt.plot([1, 2, 3, 4], [1, 4, 9, 16])
plt.title("Simple Plot")
plt.show()

# Close the figure using plt.close()
plt.close()
Output:

After running the code above, you will notice that the entire figure is closed.
Method 4: Using Figure.clear()
The Figure.clear() method in Matplotlib can be used to clear the current figure. Let’s see an example:
import matplotlib.pyplot as plt

# Create a simple plot
fig, ax = plt.subplots()
ax.plot([1, 2, 3, 4], [1, 4, 9, 16])
ax.set_title("Simple Plot")
plt.show()

# Clear the figure using Figure.clear()
fig.clear()
Output:

After running the code above, you will notice that the entire figure is cleared.
Method 5: Using Axes.clear()
The Axes.clear() method in Matplotlib can be used to clear the current axes. Let’s see an example:
import matplotlib.pyplot as plt

# Create a simple plot
fig, ax = plt.subplots()
ax.plot([1, 2, 3, 4], [1, 4, 9, 16])
ax.set_title("Simple Plot")
plt.show()

# Clear the axes using Axes.clear()
ax.clear()
Output:

After running the code above, you will notice that the data plotted on the axes is cleared.
Method 6: Using plt.gcf() and plt.gca()
The plt.gcf() function in Matplotlib returns the current figure, while the plt.gca() function returns the current axes. By using these functions, we can clear the figure or axes as needed. Let’s see an example:
import matplotlib.pyplot as plt

# Create a simple plot
fig, ax = plt.subplots()
ax.plot([1, 2, 3, 4], [1, 4, 9, 16])
ax.set_title("Simple Plot")
plt.show()

# Clear the figure using plt.gcf()
plt.gcf().clear()

# Or clear the axes using plt.gca()
plt.gca().clear()
Output:

After running the code above, you will notice that either the entire figure or just the axes is cleared.
Method 7: Using clf() and cla() shortcuts
In addition to plt.clf() and plt.cla(), Matplotlib also provides shortcuts clf() and cla() to clear the figure and axes, respectively. Let’s see an example:
import matplotlib.pyplot as plt

# Create a simple plot
plt.plot([1, 2, 3, 4], [1, 4, 9, 16])
plt.title("Simple Plot")
plt.show()

# Clear the figure using clf()
plt.clf()

# Or clear the axes using cla()
plt.cla()
Output:

Both plt.clf() and plt.cla() can be used interchangeably with their shortcuts.
Method 8: Clearing Multiple Plots
If you have multiple plots in the same figure, you can use the methods mentioned above to clear them. Let’s see an example with multiple plots:
import matplotlib.pyplot as plt
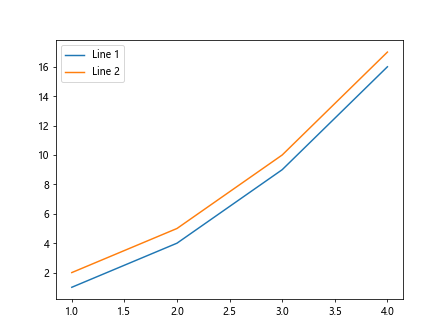
# Create multiple plots
plt.plot([1, 2, 3, 4], [1, 4, 9, 16], label="Line 1")
plt.plot([1, 2, 3, 4], [2, 5, 10, 17], label="Line 2")
plt.legend()
plt.show()
# Clear the figure using clf()
plt.clf()
Output:
After running the code above, you will notice that both plots are cleared from the figure.
Method 9: Clearing Subplots
If you have multiple subplots in a figure, you can clear them individually or all at once. Let’s see an example:
import matplotlib.pyplot as plt
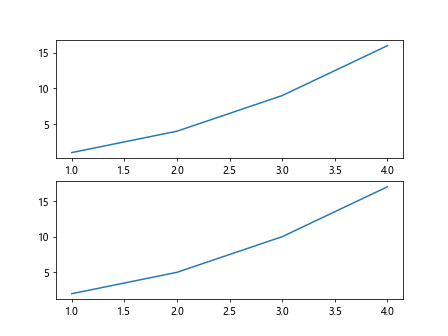
# Create multiple subplots
fig, axs = plt.subplots(2)
axs[0].plot([1, 2, 3, 4], [1, 4, 9, 16])
axs[1].plot([1, 2, 3, 4], [2, 5, 10, 17])
plt.show()
# Clear the first subplot using clear()
axs[0].clear()
# Or clear all subplots using plt.clf()
plt.clf()
Output:
After running the code above, you will notice that either the first subplot or all subplots are cleared.
Method 10: Clearing Specific Plots
Sometimes you may want to clear specific plots from a figure while keeping others. This can be achieved by manipulating the Line2D objects returned by the plot() function. Let’s see an example:
import matplotlib.pyplot as plt

# Create multiple plots
line1, = plt.plot([1, 2, 3, 4], [1, 4, 9, 16], label="Line 1")
line2, = plt.plot([1, 2, 3, 4], [2, 5, 10, 17], label="Line 2")
plt.legend()
plt.show()

# Clear the second plot by setting the data to empty lists
line2.set_data([], [])

# Or remove the second plot from the legend
line2.remove()
plt.legend()
plt.show()
After running the code above, you will notice that either the second plot data or the second plot legend entry is cleared.
Matplotlib Clear Plot Conclusion
In this article, we have explored various methods to clear plots in Matplotlib. Whether you want to clear the entire figure, axes, specific plots, or subplots, there are different ways to achieve this in Matplotlib. By using the examples provided, you can effectively manage and clear plots in your visualizations.