Matplotlib Color Maps
Matplotlib is a popular data visualization library in Python that provides a variety of tools and functions for creating visually appealing plots and figures. One key component of creating visually appealing plots is using suitable color maps. Color maps in Matplotlib allow you to specify how colors are displayed in your plots, which can greatly enhance the readability and aesthetics of your visualizations.
In this article, we will explore different aspects of color maps in Matplotlib, including how to use built-in color maps, customize color maps, and create your own custom color maps.
Using Built-in Color Maps
Matplotlib provides a wide range of built-in color maps that you can easily use in your plots. These color maps cover a range of color schemes, from simple grayscale to vibrant rainbow colors. Let’s start by exploring some of the popular built-in color maps in Matplotlib.
1. Viridis Color Map
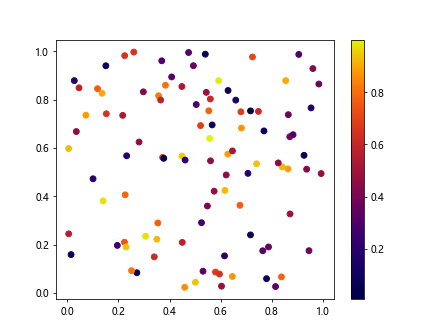
The Viridis color map is a popular choice for visualizing numerical data as it is perceptually uniform and colorblind friendly. To use the Viridis color map in Matplotlib, you can simply specify the cmap parameter in functions like imshow() or scatter().
import matplotlib.pyplot as plt
import numpy as np

# Generate random data
x = np.random.rand(100)
y = np.random.rand(100)
colors = np.random.rand(100)

# Create a scatter plot with Viridis color map
plt.scatter(x, y, c=colors, cmap='viridis')
plt.colorbar()  # Show color bar
plt.show()
Output:
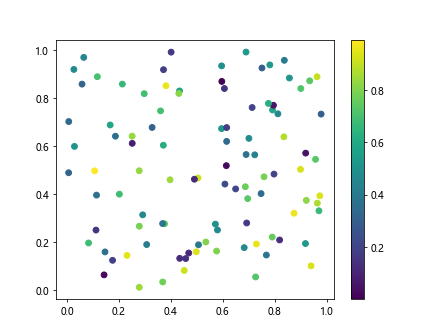
In the above example, we create a scatter plot with random data points and use the Viridis color map to visualize the data points in different colors.
2. Plasma Color Map
The Plasma color map is another popular choice due to its vibrant colors and high contrast. Similar to the Viridis color map, you can use the Plasma color map by specifying the cmap parameter in Matplotlib functions.
import matplotlib.pyplot as plt
import numpy as np

# Generate random data
x = np.random.rand(100)
y = np.random.rand(100)
colors = np.random.rand(100)

# Create a scatter plot with Plasma color map
plt.scatter(x, y, c=colors, cmap='plasma')
plt.colorbar()  # Show color bar
plt.show()
Output:
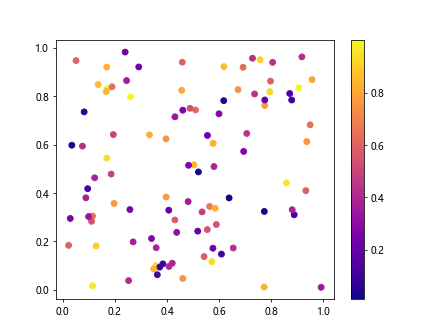
By changing the cmap parameter to 'plasma', we can see the difference in color scheme provided by the Plasma color map.
3. Jet Color Map
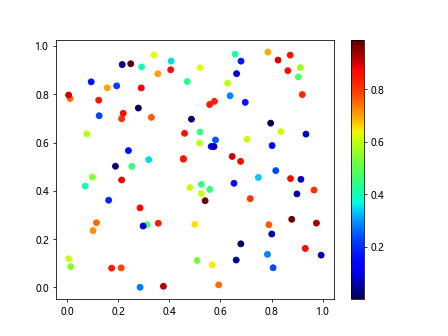
The Jet color map is a traditional rainbow color map that is widely used but has some disadvantages such as being perceptually non-uniform. Despite its drawbacks, the Jet color map is still used in various applications for its vibrant and colorful appearance.
import matplotlib.pyplot as plt
import numpy as np

# Generate random data
x = np.random.rand(100)
y = np.random.rand(100)
colors = np.random.rand(100)

# Create a scatter plot with Jet color map
plt.scatter(x, y, c=colors, cmap='jet')
plt.colorbar()  # Show color bar
plt.show()
Output:
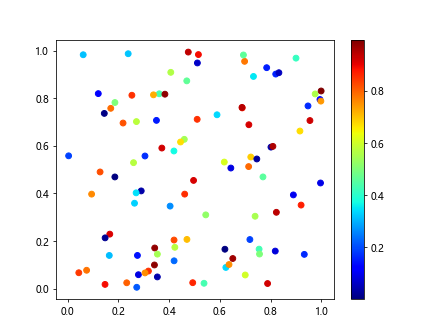
In this example, we create a scatter plot using the Jet color map to demonstrate its rainbow color scheme.
Customizing Color Maps
While the built-in color maps in Matplotlib are convenient to use, you may sometimes want to customize the color map to better suit your data or visual preferences. Matplotlib provides options for customizing color maps by adjusting parameters such as brightness, contrast, and saturation. Let’s explore how to customize color maps in Matplotlib.
4. Adjusting Brightness
You can adjust the brightness of a color map by modifying the brightness parameter. By increasing or decreasing the brightness, you can make the colors appear lighter or darker in the plot.
import matplotlib.pyplot as plt
import numpy as np
# Create a modified colormap with adjusted brightness
from matplotlib.colors import LinearSegmentedColormap

# Generate random data
x = np.random.rand(100)
y = np.random.rand(100)
colors = np.random.rand(100)

# Get the Viridis color map
viridis_map = plt.get_cmap('viridis')

# Define brightness factor
brightness = 0.5

# Adjust brightness of the color map
new_colors = viridis_map(np.linspace(0, 1, 256))
new_colors[:, :3] = new_colors[:, :3] * brightness  # Adjust brightness of RGB values
new_map = LinearSegmentedColormap.from_list('viridis_bright', new_colors)

# Create a scatter plot with modified brightness
plt.scatter(x, y, c=colors, cmap=new_map)
plt.colorbar()  # Show color bar
plt.show()
Output:
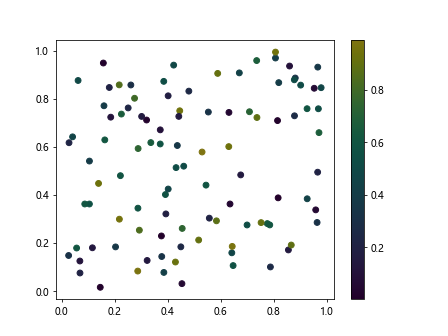
In this example, we adjust the brightness of the Viridis color map by modifying the RGB values of the colors. By changing the brightness parameter, you can control the overall brightness of the color map.
5. Adjusting Contrast
You can adjust the contrast of a color map by modifying the gamma parameter. By changing the gamma value, you can increase or decrease the difference between dark and light colors in the plot.
import matplotlib.pyplot as plt
import numpy as np
# Create a modified colormap with adjusted brightness
from matplotlib.colors import LinearSegmentedColormap

# Generate random data
x = np.random.rand(100)
y = np.random.rand(100)
colors = np.random.rand(100)

# Create a modified colormap with adjusted contrast
# Get the Plasma color map
plasma_map = plt.get_cmap('plasma')

# Define gamma factor
gamma = 2.0

# Adjust contrast of the color map
new_colors = plasma_map(np.linspace(0, 1, 256)) ** gamma  # Adjust contrast
new_map = LinearSegmentedColormap.from_list('plasma_high_contrast', new_colors)

# Create a scatter plot with modified contrast
plt.scatter(x, y, c=colors, cmap=new_map)
plt.colorbar()  # Show color bar
plt.show()
Output:
By adjusting the gamma parameter in the code above, you can control the contrast of the Plasma color map to make the colors appear more distinct.
6. Adjusting Saturation
You can adjust the saturation of a color map by modifying the saturation parameter. By increasing or decreasing the saturation, you can make the colors appear more vibrant or muted in the plot.
import matplotlib.pyplot as plt
import numpy as np
# Create a modified colormap with adjusted brightness
from matplotlib.colors import LinearSegmentedColormap

# Generate random data
x = np.random.rand(100)
y = np.random.rand(100)
colors = np.random.rand(100)

# Create a modified colormap with adjusted saturation
# Get the Jet color map
jet_map = plt.get_cmap('jet')

# Define saturation factor
saturation = 1.5

# Adjust saturation of the color map
new_colors = jet_map(np.linspace(0, 1, 256))
new_colors[:, :3] = new_colors[:, :3] ** saturation  # Adjust saturation of RGB values
new_map = LinearSegmentedColormap.from_list('jet_vibrant', new_colors)

# Create a scatter plot with modified saturation
plt.scatter(x, y, c=colors, cmap=new_map)
plt.colorbar()  # Show color bar
plt.show()
Output:
By changing the saturation parameter in the code above, you can control the intensity of colors in the Jet color map to create a more vibrant or muted color scheme.
Creating Custom Color Maps
If the built-in color maps do not meet your requirements or preferences, you can create your own custom color maps in Matplotlib. Custom color maps allow you to define specific color schemes tailored to your data visualization needs. Let’s see how to create custom color maps in Matplotlib.
7. Linear Color Map
You can create a custom linear color map by specifying a list of colors and their respective positions along the colormap. This allows you to define a gradual color transition from one color to another in a linear fashion.
import matplotlib.pyplot as plt
import numpy as np
# Create a modified colormap with adjusted brightness
from matplotlib.colors import LinearSegmentedColormap

# Generate random data
x = np.random.rand(100)
y = np.random.rand(100)
colors = np.random.rand(100)

# Create a custom linear color map
colors = ['red', 'green', 'blue']
positions = [0.0, 0.5, 1.0]

# Create a LinearSegmentedColormap object
custom_map = LinearSegmentedColormap.from_list('custom_linear', list(zip(positions, colors)))

# Create a scatter plot with custom linear color map
plt.scatter(x, y, c=colors, cmap=custom_map)
plt.colorbar()  # Show color bar
plt.show()
In the example above, we define a custom linear color map with three colors (red, green, blue) transitioning from left to right in the plot.
8. Discrete Color Map
You can create a custom discrete color map by specifying a list of colors. This allows you to assign specific colors to different data values in a discrete manner.
import matplotlib.pyplot as plt
import numpy as np
# Create a modified colormap with adjusted brightness
from matplotlib.colors import LinearSegmentedColormap

# Generate random data
x = np.random.rand(100)
y = np.random.rand(100)
colors = np.random.rand(100)

# Create a custom discrete color map
colors = ['red', 'green', 'blue']

# Create a ListedColormap object
custom_map = ListedColormap(colors)

# Create a scatter plot with custom discrete color map
plt.scatter(x, y, c=colors, cmap=custom_map)
plt.colorbar()  # Show color bar
plt.show()
By using the ListedColormap class in Matplotlib, you can create a custom discrete color map with specific colors assigned to each data value.
9. Custom Color Map with Transparency
You can create a custom color map with transparency by specifying RGBA values for each color. This allows you to create plots with translucent colors for a more visually appealing effect.
import matplotlib.pyplot as plt
import numpy as np
# Create a modified colormap with adjusted brightness
from matplotlib.colors import LinearSegmentedColormap

# Generate random data
x = np.random.rand(100)
y = np.random.rand(100)
colors = np.random.rand(100)

# Create a custom color map with transparency
colors = [(1, 0, 0, 0.5), (0, 1, 0, 0.5), (0, 0, 1, 0.5)]  # (R, G, B, A)
positions = [0.0, 0.5, 1.0]

# Create a LinearSegmentedColormap object with transparency
custom_map = LinearSegmentedColormap.from_list('custom_transparent', list(zip(positions, colors)))

# Create a scatter plot with custom color map with transparency
plt.scatter(x, y, c=colors, cmap=custom_map)
plt.colorbar()  # Show color bar
plt.show()
In the code above, we define a custom color map with transparency using RGBA values for each color. This allows us to create a scatter plot with translucent colors.
10. Custom Color Map with HSL Scheme
You can create a custom color map using the Hue-Saturation-Lightness (HSL) color scheme by specifying HSL values for each color. This allows you to define colors based on their hue, saturation, and lightness components.
from matplotlib.colors import hls_to_rgb
import matplotlib.pyplot as plt
import numpy as np
# Create a modified colormap with adjusted brightness
from matplotlib.colors import LinearSegmentedColormap

# Generate random data
x = np.random.rand(100)
y = np.random.rand(100)
colors = np.random.rand(100)

# Create a custom color map with HSL values
colors = [(0.0, 0.5, 0.5), (0.33, 0.5, 0.5), (0.66, 0.5, 0.5)]  # (H, L, S)
rgb_colors = [hls_to_rgb(color) for color in colors]

# Create a ListedColormap object with RGB values
custom_map = ListedColormap(rgb_colors)

# Create a scatter plot with custom color map using HSL scheme
plt.scatter(x, y, c=range(len(colors)), cmap=custom_map)
plt.colorbar()  # Show color bar
plt.show()
By converting HSL values to RGB values using the hls_to_rgb function, we can create a custom color map with colors defined based on the HSL color scheme.
Matplotlib Color Maps Conclusion
In this article, we have explored the use of color maps in Matplotlib for creating visually appealing plots. We have covered how to use built-in color maps, customize color maps, and create custom color maps tailored to your data visualization needs. By understanding the principles of color maps and experimenting with different color schemes, you can enhance the clarity and aesthetic appeal of your plots in Matplotlib.
Color maps play a crucial role in data visualization by conveying information effectively through colors. Whether you are visualizing numerical data, categorical data, or creating complex plots, choosing the right color map can make a significant difference in how your plots are perceived. Experimenting with different color maps and customizing them to suit your specific requirements can enrich your data visualizations and improve the overall readability of your plots.