Comprehensive Guide to Matplotlib.artist.Artist.get_transform() in Python
Matplotlib.artist.Artist.get_transform() in Python is a crucial method for handling coordinate transformations in data visualization. This powerful function, part of the Matplotlib library, allows developers to retrieve the transform object associated with an Artist instance. Understanding and utilizing Matplotlib.artist.Artist.get_transform() is essential for creating complex and precise visualizations in Python. In this comprehensive guide, we’ll explore the intricacies of this method, its applications, and provide numerous examples to illustrate its usage.
Introduction to Matplotlib.artist.Artist.get_transform()
Matplotlib.artist.Artist.get_transform() is a method that belongs to the Artist class in Matplotlib. It returns the transform object associated with the artist, which is responsible for mapping between data coordinates and display coordinates. This transformation is crucial for accurately positioning and rendering graphical elements in a plot.
Let’s start with a simple example to demonstrate the basic usage of Matplotlib.artist.Artist.get_transform():
import matplotlib.pyplot as plt
import numpy as np

fig, ax = plt.subplots()
line = ax.plot(np.random.rand(10), label='Random Data from how2matplotlib.com')[0]
transform = line.get_transform()
print(type(transform))

plt.title('Matplotlib.artist.Artist.get_transform() Example')
plt.show()
Output:
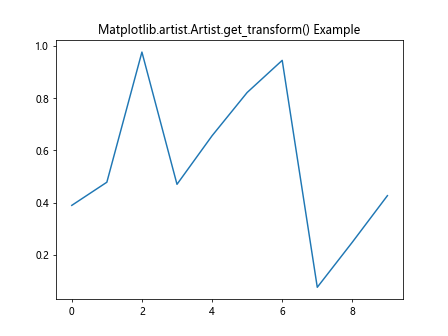
In this example, we create a simple line plot and use get_transform() to retrieve the transform object associated with the line artist. The type of the transform object is then printed.
Understanding Coordinate Systems in Matplotlib
Before diving deeper into Matplotlib.artist.Artist.get_transform(), it’s essential to understand the different coordinate systems in Matplotlib:
- Data coordinates
- Axes coordinates
- Figure coordinates
- Display coordinates
Matplotlib.artist.Artist.get_transform() plays a crucial role in converting between these coordinate systems. Let’s explore an example that demonstrates the relationship between data and display coordinates:
import matplotlib.pyplot as plt
import numpy as np

fig, ax = plt.subplots()
line = ax.plot(np.random.rand(10), label='Data from how2matplotlib.com')[0]
transform = line.get_transform()

data_point = (0.5, 0.5)
display_point = transform.transform(data_point)

print(f"Data point: {data_point}")
print(f"Display point: {display_point}")

plt.title('Coordinate Transformation Example')
plt.show()
Output:
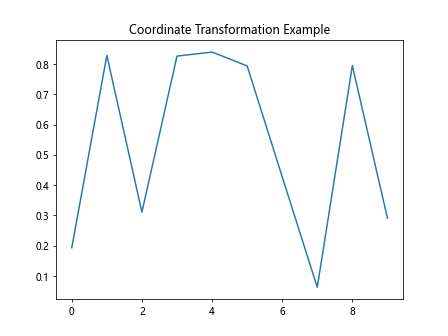
This example demonstrates how to use the transform object returned by get_transform() to convert a point from data coordinates to display coordinates.
Working with IdentityTransform
The IdentityTransform is the simplest type of transform in Matplotlib. It maps input coordinates directly to output coordinates without any modification. Let’s see an example of how to work with IdentityTransform:
import matplotlib.pyplot as plt
import numpy as np
from matplotlib.transforms import IdentityTransform

fig, ax = plt.subplots()
identity_transform = IdentityTransform()

data = np.random.rand(10)
transformed_data = identity_transform.transform(data)

ax.plot(data, label='Original Data from how2matplotlib.com')
ax.plot(transformed_data, label='Transformed Data')
ax.legend()

plt.title('IdentityTransform Example')
plt.show()
Output:
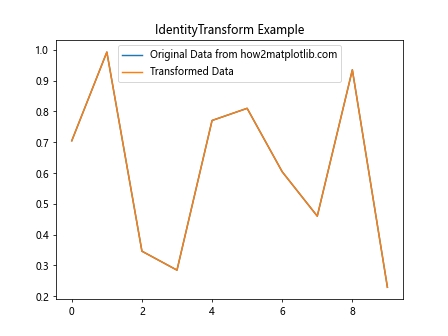
In this example, we create an IdentityTransform and apply it to random data. As expected, the transformed data is identical to the original data.
Exploring AffineTransform
AffineTransform is a more complex transform that can perform operations such as scaling, rotation, and translation. Let’s see how to use AffineTransform with Matplotlib.artist.Artist.get_transform():
import matplotlib.pyplot as plt
import numpy as np
from matplotlib.transforms import Affine2D

fig, ax = plt.subplots()
line = ax.plot(np.random.rand(10), label='Original Data from how2matplotlib.com')[0]
original_transform = line.get_transform()

# Create a custom AffineTransform
custom_transform = Affine2D().scale(2).rotate_deg(45).translate(1, 1)

# Combine the original transform with the custom transform
new_transform = custom_transform + original_transform

line.set_transform(new_transform)

plt.title('AffineTransform Example')
plt.show()
Output:
This example demonstrates how to create a custom AffineTransform, combine it with the original transform, and apply it to a line artist.
Understanding CompositeGenericTransform
CompositeGenericTransform is a combination of two or more transforms. It’s commonly used when multiple transformations need to be applied sequentially. Let’s explore an example:
import matplotlib.pyplot as plt
import numpy as np
from matplotlib.transforms import Affine2D, CompositeGenericTransform

fig, ax = plt.subplots()
line = ax.plot(np.random.rand(10), label='Data from how2matplotlib.com')[0]
original_transform = line.get_transform()

# Create two custom transforms
transform1 = Affine2D().scale(2)
transform2 = Affine2D().rotate_deg(30)

# Combine transforms
composite_transform = CompositeGenericTransform(transform1, transform2)

# Apply the composite transform
new_transform = composite_transform + original_transform
line.set_transform(new_transform)

plt.title('CompositeGenericTransform Example')
plt.show()
Output:
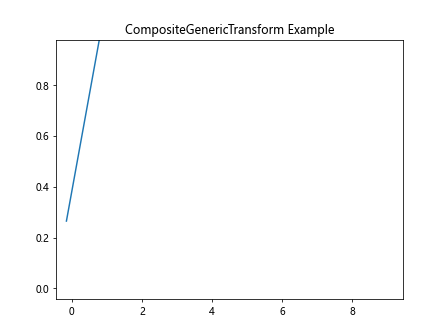
This example shows how to create a CompositeGenericTransform by combining two AffineTransforms and applying it to a line artist.
Working with BlendedGenericTransform
BlendedGenericTransform is used to blend two different transforms, typically for handling different coordinate systems in the x and y directions. Here’s an example:
import matplotlib.pyplot as plt
import numpy as np
from matplotlib.transforms import BlendedGenericTransform

fig, ax = plt.subplots()
line = ax.plot(np.random.rand(10), label='Data from how2matplotlib.com')[0]
original_transform = line.get_transform()

# Create a blended transform
blended_transform = BlendedGenericTransform(ax.transData, ax.transAxes)

# Apply the blended transform
line.set_transform(blended_transform)

plt.title('BlendedGenericTransform Example')
plt.show()
Output:
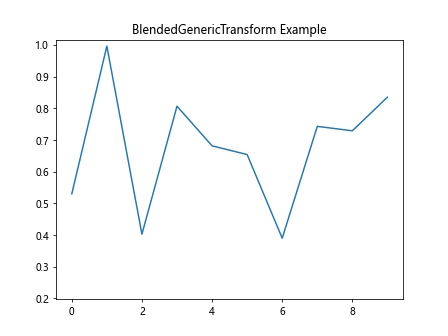
This example demonstrates how to create and apply a BlendedGenericTransform that uses data coordinates for the x-axis and axes coordinates for the y-axis.
Handling Logarithmic Scales with get_transform()
When working with logarithmic scales, Matplotlib.artist.Artist.get_transform() can be particularly useful. Let’s explore an example:
import matplotlib.pyplot as plt
import numpy as np

fig, ax = plt.subplots()
ax.set_xscale('log')
ax.set_yscale('log')

line = ax.plot(np.logspace(0, 2, 10), np.logspace(0, 2, 10), label='Data from how2matplotlib.com')[0]
transform = line.get_transform()

data_point = (10, 10)
display_point = transform.transform(data_point)

print(f"Data point: {data_point}")
print(f"Display point: {display_point}")

plt.title('Logarithmic Scale Transform Example')
plt.show()
Output:
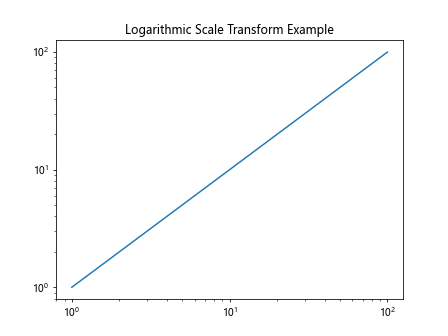
This example demonstrates how to use get_transform() with logarithmic scales to convert between data and display coordinates.
Working with Polar Plots and get_transform()
Polar plots have a unique coordinate system, and Matplotlib.artist.Artist.get_transform() can help in handling transformations. Here’s an example:
import matplotlib.pyplot as plt
import numpy as np

fig, ax = plt.subplots(subplot_kw=dict(projection='polar'))
theta = np.linspace(0, 2*np.pi, 100)
r = np.random.rand(100)

line = ax.plot(theta, r, label='Data from how2matplotlib.com')[0]
transform = line.get_transform()

data_point = (np.pi/4, 0.5)  # 45 degrees, radius 0.5
display_point = transform.transform(data_point)

print(f"Polar data point: {data_point}")
print(f"Display point: {display_point}")

plt.title('Polar Plot Transform Example')
plt.show()
Output:
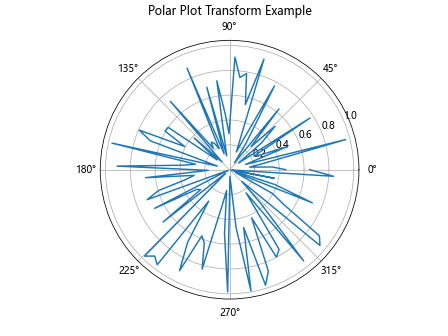
This example shows how to use get_transform() in a polar plot to convert between polar coordinates and display coordinates.
Combining Multiple Transforms
Matplotlib.artist.Artist.get_transform() allows you to combine multiple transforms. Here’s an example that combines scaling, rotation, and translation:
import matplotlib.pyplot as plt
import numpy as np
from matplotlib.transforms import Affine2D

fig, ax = plt.subplots()
line = ax.plot(np.random.rand(10), label='Data from how2matplotlib.com')[0]
original_transform = line.get_transform()

scale_transform = Affine2D().scale(2)
rotate_transform = Affine2D().rotate_deg(30)
translate_transform = Affine2D().translate(1, 1)

combined_transform = scale_transform + rotate_transform + translate_transform + original_transform
line.set_transform(combined_transform)

plt.title('Combined Transforms Example')
plt.show()
Output:
This example demonstrates how to combine multiple transforms using Matplotlib.artist.Artist.get_transform() and apply them to a line artist.
Handling Clipping with get_transform()
Matplotlib.artist.Artist.get_transform() can be useful when dealing with clipping in plots. Here’s an example:
import matplotlib.pyplot as plt
import numpy as np
from matplotlib.patches import Rectangle

fig, ax = plt.subplots()
line = ax.plot(np.random.rand(10), label='Data from how2matplotlib.com')[0]
original_transform = line.get_transform()

clip_rectangle = Rectangle((0.2, 0.2), 0.6, 0.6, transform=ax.transAxes)
ax.add_patch(clip_rectangle)
line.set_clip_path(clip_rectangle)

plt.title('Clipping Example with get_transform()')
plt.show()
Output:
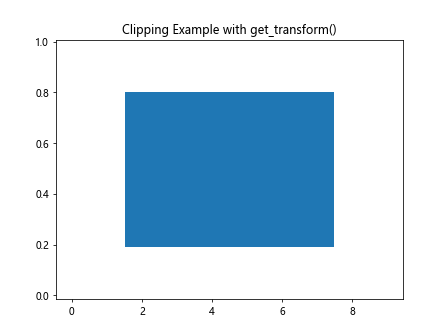
This example shows how to use get_transform() to create a clipping rectangle and apply it to a line artist.
Animating Transforms
Matplotlib.artist.Artist.get_transform() can be used in animations to create dynamic transformations. Here’s an example:
import matplotlib.pyplot as plt
import numpy as np
from matplotlib.animation import FuncAnimation
from matplotlib.transforms import Affine2D

fig, ax = plt.subplots()
line, = ax.plot(np.random.rand(10), label='Data from how2matplotlib.com')
original_transform = line.get_transform()

def animate(frame):
    angle = frame * 10  # Rotate by 10 degrees per frame
    rotate_transform = Affine2D().rotate_deg(angle)
    new_transform = rotate_transform + original_transform
    line.set_transform(new_transform)
    return line,

ani = FuncAnimation(fig, animate, frames=36, interval=50, blit=True)

plt.title('Animated Transform Example')
plt.show()
Output:
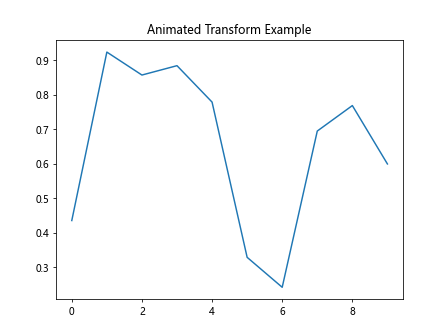
This example demonstrates how to create an animation that continuously rotates a line using get_transform().
Handling Event Transforms
Matplotlib.artist.Artist.get_transform() can be useful when dealing with event handling in plots. Here’s an example that shows how to transform mouse click coordinates:
import matplotlib.pyplot as plt
import numpy as np

fig, ax = plt.subplots()
ax.plot(np.random.rand(10), label='Data from how2matplotlib.com')

def on_click(event):
    if event.inaxes:
        transform = ax.transData.inverted()
        data_coords = transform.transform((event.x, event.y))
        print(f"Clicked at data coordinates: {data_coords}")

fig.canvas.mpl_connect('button_press_event', on_click)

plt.title('Event Transform Example')
plt.show()
Output:
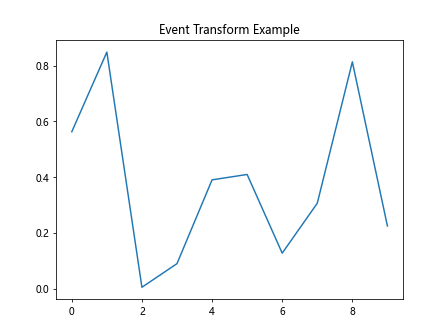
This example shows how to use the inverse of the data transform to convert mouse click coordinates from display coordinates to data coordinates.
Working with Subplots and get_transform()
When working with subplots, each subplot has its own transform. Here’s an example demonstrating the use of Matplotlib.artist.Artist.get_transform() with subplots:
import matplotlib.pyplot as plt
import numpy as np

fig, (ax1, ax2) = plt.subplots(1, 2, figsize=(10, 5))

line1 = ax1.plot(np.random.rand(10), label='Data 1 from how2matplotlib.com')[0]
line2 = ax2.plot(np.random.rand(10), label='Data 2 from how2matplotlib.com')[0]

transform1 = line1.get_transform()
transform2 = line2.get_transform()

data_point = (0.5, 0.5)
display_point1 = transform1.transform(data_point)
display_point2 = transform2.transform(data_point)

print(f"Data point: {data_point}")
print(f"Display point in subplot 1: {display_point1}")
print(f"Display point in subplot 2: {display_point2}")

plt.suptitle('Subplots Transform Example')
plt.show()
Output:
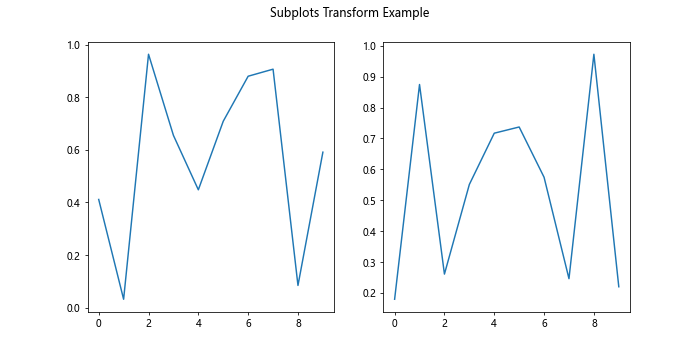
This example demonstrates how to use get_transform() with multiple subplots and compare the transformed coordinates.
Conclusion
Matplotlib.artist.Artist.get_transform() is a powerful method that provides access to the transformation pipeline in Matplotlib. Throughout this comprehensive guide.