Comprehensive Guide to Matplotlib.artist.Artist.get_transformed_clip_path_and_affine() in Python
Matplotlib.artist.Artist.get_transformed_clip_path_and_affine() in Python is a powerful method that plays a crucial role in handling clipping paths and affine transformations for artists in Matplotlib. This comprehensive guide will delve deep into the intricacies of this method, exploring its functionality, usage, and practical applications. We’ll cover everything from basic concepts to advanced techniques, providing you with a thorough understanding of how to leverage Matplotlib.artist.Artist.get_transformed_clip_path_and_affine() in your data visualization projects.
Understanding the Basics of Matplotlib.artist.Artist.get_transformed_clip_path_and_affine()
Matplotlib.artist.Artist.get_transformed_clip_path_and_affine() is a method that belongs to the Artist class in Matplotlib. Its primary purpose is to return the clip path with the non-affine part of its transformation applied, and the remaining affine part of its transformation. This method is essential for managing clipping and transformations in Matplotlib, allowing you to control how your plots are rendered and displayed.
Let’s start with a simple example to illustrate the basic usage of Matplotlib.artist.Artist.get_transformed_clip_path_and_affine():
import matplotlib.pyplot as plt
import numpy as np

fig, ax = plt.subplots()
circle = plt.Circle((0.5, 0.5), 0.2, fill=False)
ax.add_artist(circle)

clip_path, affine = circle.get_transformed_clip_path_and_affine()
print("Clip Path:", clip_path)
print("Affine Transformation:", affine)

plt.title("How2matplotlib.com: Basic Usage of get_transformed_clip_path_and_affine()")
plt.show()
Output:
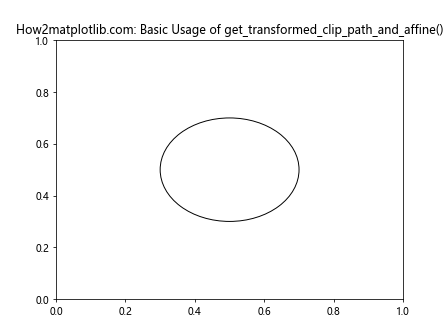
In this example, we create a simple circle artist and add it to the axes. We then call the get_transformed_clip_path_and_affine() method on the circle object to obtain its clip path and affine transformation. The method returns two values: the clip path and the affine transformation matrix.
Exploring the Clip Path in Matplotlib.artist.Artist.get_transformed_clip_path_and_affine()
The clip path returned by Matplotlib.artist.Artist.get_transformed_clip_path_and_affine() is a Path object that defines the region where the artist should be visible. Understanding how to work with clip paths is crucial for creating complex visualizations with precise control over what parts of your plot are visible.
Let’s examine a more detailed example of working with clip paths:
import matplotlib.pyplot as plt
import matplotlib.path as mpath
import numpy as np

fig, ax = plt.subplots()

# Create a custom path for clipping
star = mpath.Path.unit_regular_star(5)
clip_path = mpath.Path(star.vertices * 0.5 + 0.5)

# Create a circle artist
circle = plt.Circle((0.5, 0.5), 0.4, fill=False)
ax.add_artist(circle)

# Apply the clip path to the circle
circle.set_clip_path(clip_path, ax.transData)

# Get the transformed clip path and affine
transformed_clip_path, affine = circle.get_transformed_clip_path_and_affine()

ax.set_xlim(0, 1)
ax.set_ylim(0, 1)
plt.title("How2matplotlib.com: Custom Clip Path with get_transformed_clip_path_and_affine()")
plt.show()
Output:
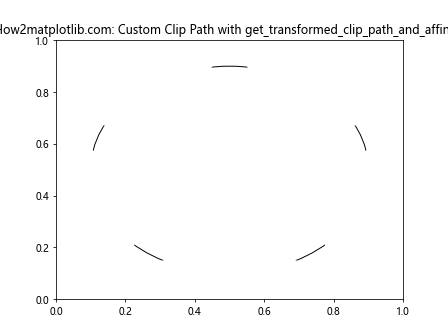
In this example, we create a custom star-shaped clip path and apply it to a circle artist. We then use get_transformed_clip_path_and_affine() to obtain the transformed clip path and affine transformation. This demonstrates how you can create complex clipping shapes and apply them to your artists.
Understanding Affine Transformations in Matplotlib.artist.Artist.get_transformed_clip_path_and_affine()
The affine transformation returned by Matplotlib.artist.Artist.get_transformed_clip_path_and_affine() is a 3×3 transformation matrix that represents the remaining affine part of the artist’s transformation. Affine transformations are crucial for scaling, rotating, and translating your plots.
Let’s explore an example that demonstrates working with affine transformations:
import matplotlib.pyplot as plt
import matplotlib.transforms as transforms
import numpy as np

fig, ax = plt.subplots()

# Create a rectangle artist
rect = plt.Rectangle((0.2, 0.2), 0.3, 0.3, fill=False)
ax.add_artist(rect)

# Apply a custom transformation
t = transforms.Affine2D().rotate_deg(45).scale(1.5)
rect.set_transform(t + ax.transData)

# Get the transformed clip path and affine
clip_path, affine = rect.get_transformed_clip_path_and_affine()

print("Affine Transformation Matrix:")
print(affine)

ax.set_xlim(0, 1)
ax.set_ylim(0, 1)
plt.title("How2matplotlib.com: Affine Transformations with get_transformed_clip_path_and_affine()")
plt.show()
Output:
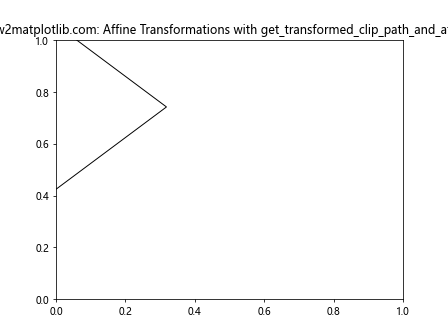
In this example, we create a rectangle artist and apply a custom affine transformation that rotates it by 45 degrees and scales it by 1.5. We then use get_transformed_clip_path_and_affine() to obtain the transformed clip path and affine transformation matrix. This demonstrates how you can work with complex transformations and retrieve the resulting affine matrix.
Practical Applications of Matplotlib.artist.Artist.get_transformed_clip_path_and_affine()
Now that we’ve covered the basics, let’s explore some practical applications of Matplotlib.artist.Artist.get_transformed_clip_path_and_affine() in real-world scenarios.
Combining Multiple Transformations
Matplotlib.artist.Artist.get_transformed_clip_path_and_affine() is particularly useful when working with multiple transformations. Let’s explore an example that combines rotation, scaling, and translation:
import matplotlib.pyplot as plt
import matplotlib.transforms as transforms
import numpy as np

fig, ax = plt.subplots()

# Create a triangle artist
triangle = plt.Polygon([(0, 0), (0.5, 0.5), (1, 0)], fill=False)
ax.add_artist(triangle)

# Create a composite transformation
t1 = transforms.Affine2D().rotate_deg(30)
t2 = transforms.Affine2D().scale(1.5)
t3 = transforms.Affine2D().translate(0.2, 0.2)
composite_transform = t1 + t2 + t3 + ax.transData

# Apply the composite transformation
triangle.set_transform(composite_transform)

# Get the transformed clip path and affine
clip_path, affine = triangle.get_transformed_clip_path_and_affine()

print("Composite Affine Transformation Matrix:")
print(affine)

ax.set_xlim(0, 2)
ax.set_ylim(0, 2)
plt.title("How2matplotlib.com: Composite Transformations with get_transformed_clip_path_and_affine()")
plt.show()
Output:
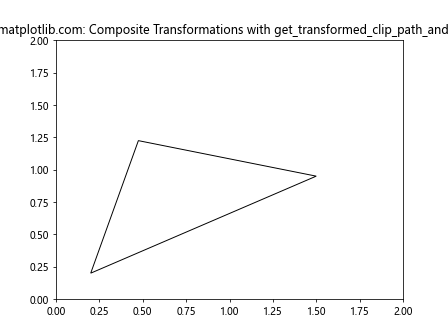
This example demonstrates how to combine multiple transformations (rotation, scaling, and translation) and apply them to a triangle artist. We then use get_transformed_clip_path_and_affine() to obtain the resulting transformed clip path and affine transformation matrix.
Advanced Techniques with Matplotlib.artist.Artist.get_transformed_clip_path_and_affine()
As you become more comfortable with Matplotlib.artist.Artist.get_transformed_clip_path_and_affine(), you can explore more advanced techniques to create sophisticated visualizations.
Creating Masked Plots
One advanced application of get_transformed_clip_path_and_affine() is creating masked plots, where certain parts of your data are hidden based on a custom mask. Here’s an example:
import matplotlib.pyplot as plt
import matplotlib.path as mpath
import numpy as np

fig, ax = plt.subplots()

# Create data for a 2D plot
x = np.linspace(-5, 5, 100)
y = np.linspace(-5, 5, 100)
X, Y = np.meshgrid(x, y)
Z = np.sin(np.sqrt(X**2 + Y**2))

# Create a custom mask shape (a star)
star = mpath.Path.unit_regular_star(5)
clip_path = mpath.Path(star.vertices * 3)

# Plot the data
im = ax.imshow(Z, extent=[-5, 5, -5, 5], origin='lower', cmap='viridis')

# Apply the clip path to the image
im.set_clip_path(clip_path, ax.transData)

# Get the transformed clip path and affine
clip_path, affine = im.get_transformed_clip_path_and_affine()

plt.title("How2matplotlib.com: Masked Plot with get_transformed_clip_path_and_affine()")
plt.colorbar(im)
plt.show()
Output:
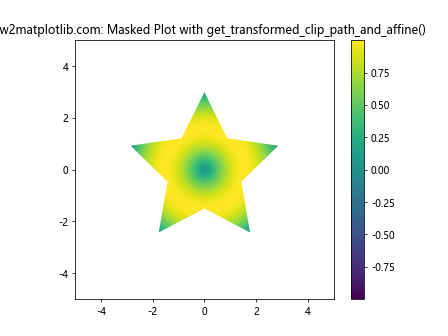
In this example, we create a 2D plot of a sinusoidal function and apply a star-shaped mask to it using a clip path. We then use get_transformed_clip_path_and_affine() to obtain the transformed clip path and affine transformation, demonstrating how you can create complex masked plots.
Animating Transformations
Another advanced technique is using get_transformed_clip_path_and_affine() in animations to create dynamic transformations. Here’s an example that animates a rotating and scaling rectangle:
import matplotlib.pyplot as plt
import matplotlib.transforms as transforms
import matplotlib.animation as animation
import numpy as np

fig, ax = plt.subplots()

# Create a rectangle artist
rect = plt.Rectangle((0, 0), 1, 0.5, fill=False)
ax.add_artist(rect)

# Initialize the transformation
t = transforms.Affine2D()
rect.set_transform(t + ax.transData)

ax.set_xlim(-2, 2)
ax.set_ylim(-2, 2)

# Animation update function
def update(frame):
    angle = frame * 2 * np.pi / 100
    scale = 1 + 0.5 * np.sin(angle)
    t.clear().rotate(angle).scale(scale)

    # Get the transformed clip path and affine
    clip_path, affine = rect.get_transformed_clip_path_and_affine()

    return rect,

# Create the animation
ani = animation.FuncAnimation(fig, update, frames=100, interval=50, blit=True)

plt.title("How2matplotlib.com: Animated Transformations with get_transformed_clip_path_and_affine()")
plt.show()
Output:
This example creates an animation of a rectangle that rotates and scales over time. We use get_transformed_clip_path_and_affine() in each frame to obtain the updated transformation, demonstrating how you can create dynamic visualizations with changing transformations.
Best Practices for Using Matplotlib.artist.Artist.get_transformed_clip_path_and_affine()
When working with Matplotlib.artist.Artist.get_transformed_clip_path_and_affine(), it’s important to follow some best practices to ensure efficient and effective use of the method:
- Understand the coordinate systems: Be aware of the different coordinate systems in Matplotlib (data coordinates, axes coordinates, figure coordinates) and how they interact with transformations.
Use appropriate transformations: Choose the right transformation for your needs. Matplotlib provides various transformation classes like Affine2D, BlendedGenericTransform, and CompositeGenericTransform.
Optimize performance: If you’re working with large datasets or complex visualizations, consider caching the results of get_transformed_clip_path_and_affine() to avoid unnecessary recalculations.
Combine with other Matplotlib features: Leverage other Matplotlib features like zorder, alpha, and blending modes to create more sophisticated visualizations.
Test with different backends: Ensure your code works correctly with different Matplotlib backends, as some transformations may behave differently depending on the backend used.
Let’s look at an example that demonstrates some of these best practices: