How to Use Matplotlib.artist.Artist.get_sketch_params() in Python
Matplotlib.artist.Artist.get_sketch_params() in Python is an essential method for retrieving sketch parameters of Matplotlib artists. This comprehensive guide will explore the various aspects of using Matplotlib.artist.Artist.get_sketch_params() in Python, providing detailed explanations and practical examples to help you master this powerful feature of Matplotlib.
Understanding Matplotlib.artist.Artist.get_sketch_params() in Python
Matplotlib.artist.Artist.get_sketch_params() in Python is a method that returns a tuple containing the sketch parameters for a given artist. These parameters control the appearance of the sketch-style drawing of the artist. The method is part of the Artist class, which is the base class for all drawable objects in Matplotlib.
Let’s start with a simple example to demonstrate how to use Matplotlib.artist.Artist.get_sketch_params() in Python:
import matplotlib.pyplot as plt

fig, ax = plt.subplots()
line, = ax.plot([1, 2, 3, 4], [1, 4, 2, 3], label='how2matplotlib.com')
sketch_params = line.get_sketch_params()
print(f"Sketch parameters: {sketch_params}")

plt.title("Using get_sketch_params() in Matplotlib")
plt.show()
Output:
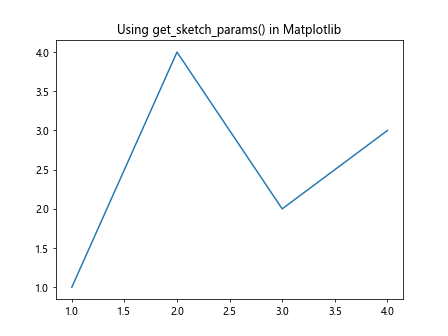
In this example, we create a simple line plot and then use the get_sketch_params() method to retrieve the sketch parameters of the line artist. The returned tuple contains three values: scale, length, and randomness.
Setting Sketch Parameters with Matplotlib.artist.Artist.set_sketch_params() in Python
While Matplotlib.artist.Artist.get_sketch_params() in Python is used to retrieve sketch parameters, it’s often used in conjunction with set_sketch_params() to modify the sketch appearance of an artist. Let’s see an example of how these methods work together:
import matplotlib.pyplot as plt

fig, (ax1, ax2) = plt.subplots(1, 2, figsize=(10, 4))

circle1 = plt.Circle((0.5, 0.5), 0.4, fill=False, label='how2matplotlib.com')
ax1.add_patch(circle1)
ax1.set_title("Before set_sketch_params()")

circle2 = plt.Circle((0.5, 0.5), 0.4, fill=False, label='how2matplotlib.com')
ax2.add_patch(circle2)
circle2.set_sketch_params(scale=5, length=100, randomness=0.3)
ax2.set_title("After set_sketch_params()")

for ax in (ax1, ax2):
    ax.set_xlim(0, 1)
    ax.set_ylim(0, 1)

plt.tight_layout()
plt.show()
Output:
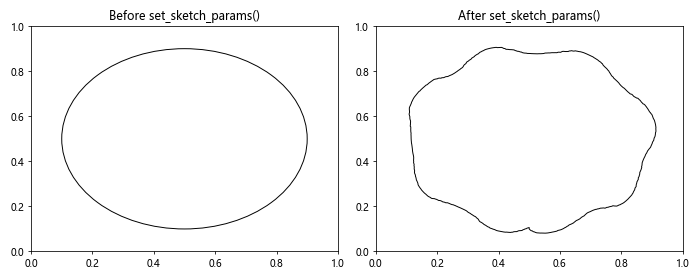
In this example, we create two circles. The first one uses the default sketch parameters, while the second one has its sketch parameters modified using set_sketch_params(). We then use get_sketch_params() to verify the changes:
print("Circle 1 sketch params:", circle1.get_sketch_params())
print("Circle 2 sketch params:", circle2.get_sketch_params())
Using Matplotlib.artist.Artist.get_sketch_params() with Different Artist Types
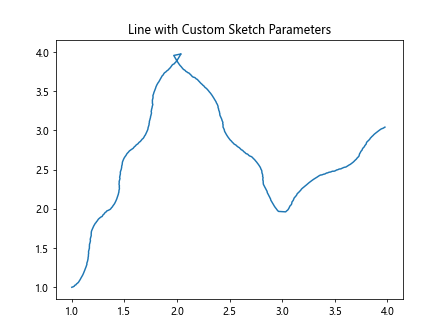
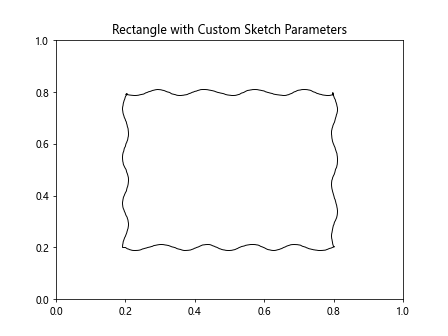
Matplotlib.artist.Artist.get_sketch_params() in Python can be used with various types of artists in Matplotlib. Let’s explore how to use this method with different artist types:
Lines
import matplotlib.pyplot as plt

fig, ax = plt.subplots()
line, = ax.plot([1, 2, 3, 4], [1, 4, 2, 3], label='how2matplotlib.com')
line.set_sketch_params(scale=5, length=100, randomness=0.3)

sketch_params = line.get_sketch_params()
print(f"Line sketch parameters: {sketch_params}")

plt.title("Line with Custom Sketch Parameters")
plt.show()
Output:
Rectangles
import matplotlib.pyplot as plt

fig, ax = plt.subplots()
rect = plt.Rectangle((0.2, 0.2), 0.6, 0.6, fill=False, label='how2matplotlib.com')
ax.add_patch(rect)
rect.set_sketch_params(scale=3, length=50, randomness=0.5)

sketch_params = rect.get_sketch_params()
print(f"Rectangle sketch parameters: {sketch_params}")

plt.title("Rectangle with Custom Sketch Parameters")
plt.xlim(0, 1)
plt.ylim(0, 1)
plt.show()
Output:
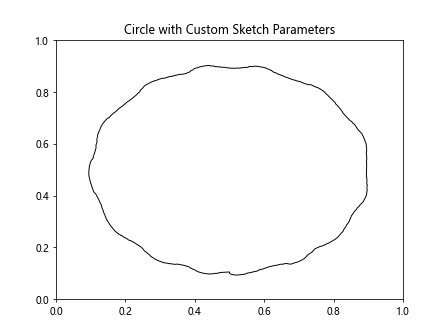
Circles
import matplotlib.pyplot as plt

fig, ax = plt.subplots()
circle = plt.Circle((0.5, 0.5), 0.4, fill=False, label='how2matplotlib.com')
ax.add_patch(circle)
circle.set_sketch_params(scale=2, length=75, randomness=0.2)

sketch_params = circle.get_sketch_params()
print(f"Circle sketch parameters: {sketch_params}")

plt.title("Circle with Custom Sketch Parameters")
plt.xlim(0, 1)
plt.ylim(0, 1)
plt.show()
Output:
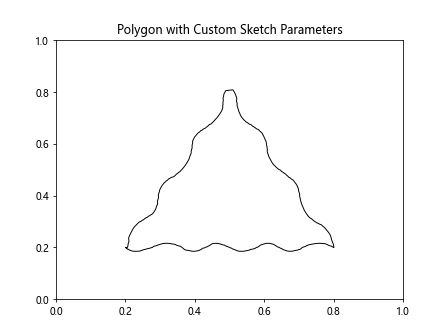
Polygons
import matplotlib.pyplot as plt
import numpy as np

fig, ax = plt.subplots()
polygon = plt.Polygon(np.array([[0.2, 0.2], [0.8, 0.2], [0.5, 0.8]]), fill=False, label='how2matplotlib.com')
ax.add_patch(polygon)
polygon.set_sketch_params(scale=4, length=60, randomness=0.4)

sketch_params = polygon.get_sketch_params()
print(f"Polygon sketch parameters: {sketch_params}")

plt.title("Polygon with Custom Sketch Parameters")
plt.xlim(0, 1)
plt.ylim(0, 1)
plt.show()
Output:
Advanced Usage of Matplotlib.artist.Artist.get_sketch_params() in Python
Now that we’ve covered the basics of Matplotlib.artist.Artist.get_sketch_params() in Python, let’s explore some more advanced usage scenarios:
Comparing Sketch Parameters Across Multiple Artists
import matplotlib.pyplot as plt

fig, ax = plt.subplots()

artists = [
    plt.Line2D([0, 1], [0, 1], label='Line how2matplotlib.com'),
    plt.Rectangle((0.2, 0.2), 0.3, 0.3, fill=False, label='Rectangle how2matplotlib.com'),
    plt.Circle((0.7, 0.7), 0.2, fill=False, label='Circle how2matplotlib.com')
]

for artist in artists:
    ax.add_artist(artist)
    artist.set_sketch_params(scale=3, length=50, randomness=0.3)

for artist in artists:
    sketch_params = artist.get_sketch_params()
    print(f"{type(artist).__name__} sketch parameters: {sketch_params}")

plt.title("Comparing Sketch Parameters Across Artists")
plt.xlim(0, 1)
plt.ylim(0, 1)
plt.legend()
plt.show()
Output:
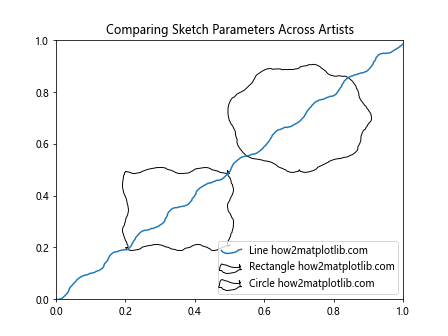
This example demonstrates how to set and get sketch parameters for multiple artists of different types, allowing for easy comparison.
Animating Sketch Parameters
import matplotlib.pyplot as plt
import matplotlib.animation as animation

fig, ax = plt.subplots()
circle = plt.Circle((0.5, 0.5), 0.4, fill=False, label='how2matplotlib.com')
ax.add_patch(circle)

def animate(frame):
    scale = 1 + frame * 0.1
    circle.set_sketch_params(scale=scale, length=50, randomness=0.3)
    sketch_params = circle.get_sketch_params()
    print(f"Frame {frame}: {sketch_params}")
    return circle,

ani = animation.FuncAnimation(fig, animate, frames=50, interval=100, blit=True)

plt.title("Animating Sketch Parameters")
plt.xlim(0, 1)
plt.ylim(0, 1)
plt.show()
Output:
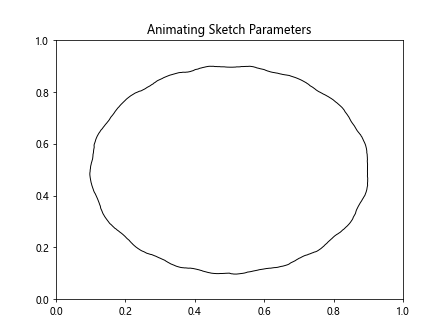
This example creates an animation where the sketch scale of a circle changes over time, demonstrating how get_sketch_params() can be used in dynamic visualizations.
Common Pitfalls and Best Practices for Matplotlib.artist.Artist.get_sketch_params() in Python
When working with Matplotlib.artist.Artist.get_sketch_params() in Python, there are some common pitfalls to avoid and best practices to follow:
Pitfall 1: Assuming All Artists Support Sketch Parameters
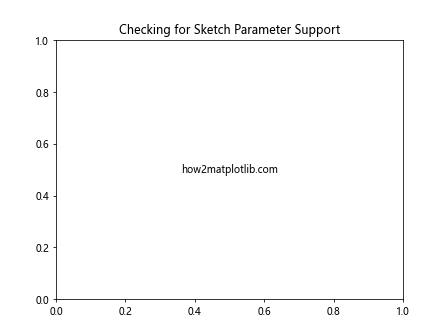
Not all Matplotlib artists support sketch parameters. Always check the documentation or use try-except blocks when working with unfamiliar artist types:
import matplotlib.pyplot as plt

fig, ax = plt.subplots()
text = ax.text(0.5, 0.5, "how2matplotlib.com", ha='center', va='center')

try:
    sketch_params = text.get_sketch_params()
    print(f"Text sketch parameters: {sketch_params}")
except AttributeError:
    print("Text artists do not support sketch parameters")

plt.title("Checking for Sketch Parameter Support")
plt.show()
Output:
Best Practice 1: Use get_sketch_params() for Verification
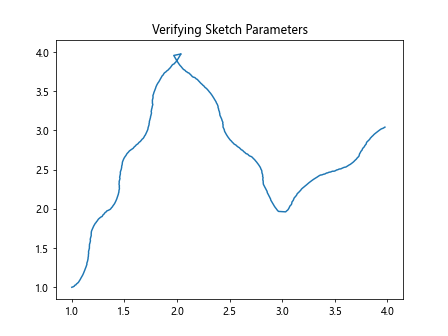
Always use get_sketch_params() to verify that set_sketch_params() has been applied correctly:
import matplotlib.pyplot as plt

fig, ax = plt.subplots()
line, = ax.plot([1, 2, 3, 4], [1, 4, 2, 3], label='how2matplotlib.com')

line.set_sketch_params(scale=5, length=100, randomness=0.3)
sketch_params = line.get_sketch_params()

print(f"Set sketch parameters: scale=5, length=100, randomness=0.3")
print(f"Retrieved sketch parameters: {sketch_params}")

plt.title("Verifying Sketch Parameters")
plt.show()
Output:
Best Practice 2: Use Named Parameters for Clarity
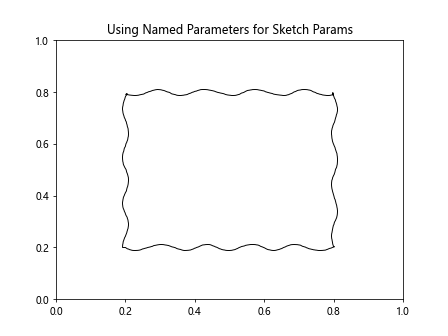
When setting sketch parameters, use named parameters for clarity and to avoid confusion:
import matplotlib.pyplot as plt

fig, ax = plt.subplots()
rect = plt.Rectangle((0.2, 0.2), 0.6, 0.6, fill=False, label='how2matplotlib.com')
ax.add_patch(rect)

# Good practice
rect.set_sketch_params(scale=3, length=50, randomness=0.5)

# Avoid this
# rect.set_sketch_params(3, 50, 0.5)

sketch_params = rect.get_sketch_params()
print(f"Rectangle sketch parameters: {sketch_params}")

plt.title("Using Named Parameters for Sketch Params")
plt.xlim(0, 1)
plt.ylim(0, 1)
plt.show()
Output:
Integrating Matplotlib.artist.Artist.get_sketch_params() with Other Matplotlib Features
Matplotlib.artist.Artist.get_sketch_params() in Python can be effectively integrated with other Matplotlib features to create more complex and informative visualizations. Let’s explore some examples:
Combining Sketch Parameters with Color Mapping
import matplotlib.pyplot as plt
import numpy as np

fig, ax = plt.subplots()

x = np.linspace(0, 10, 100)
y = np.sin(x)

line, = ax.plot(x, y, label='how2matplotlib.com')
line.set_sketch_params(scale=5, length=100, randomness=0.3)

points = ax.scatter(x, y, c=y, cmap='viridis')
points.set_sketch_params(scale=3, length=50, randomness=0.5)

sketch_params_line = line.get_sketch_params()
sketch_params_points = points.get_sketch_params()

print(f"Line sketch parameters: {sketch_params_line}")
print(f"Points sketch parameters: {sketch_params_points}")

plt.colorbar(points)
plt.title("Combining Sketch Parameters with Color Mapping")
plt.show()
Output:
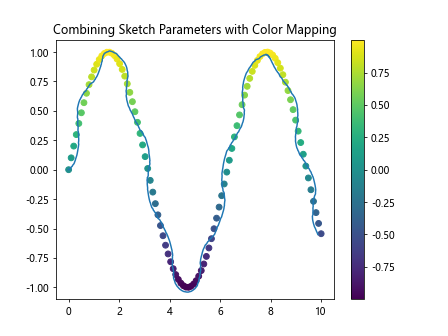
This example demonstrates how to combine sketch parameters with color mapping, creating a visually interesting plot that uses both techniques.
Using Sketch Parameters in Subplots
import matplotlib.pyplot as plt
import numpy as np

fig, (ax1, ax2) = plt.subplots(1, 2, figsize=(10, 4))

x = np.linspace(0, 10, 100)
y1 = np.sin(x)
y2 = np.cos(x)

line1, = ax1.plot(x, y1, label='Sin how2matplotlib.com')
line1.set_sketch_params(scale=3, length=75, randomness=0.2)

line2, = ax2.plot(x, y2, label='Cos how2matplotlib.com')
line2.set_sketch_params(scale=5, length=100, randomness=0.4)

sketch_params1 = line1.get_sketch_params()
sketch_params2 = line2.get_sketch_params()

print(f"Sin line sketch parameters: {sketch_params1}")
print(f"Cos line sketch parameters: {sketch_params2}")

ax1.set_title("Sin with Sketch Parameters")
ax2.set_title("Cos with Sketch Parameters")

plt.tight_layout()
plt.show()
Output:
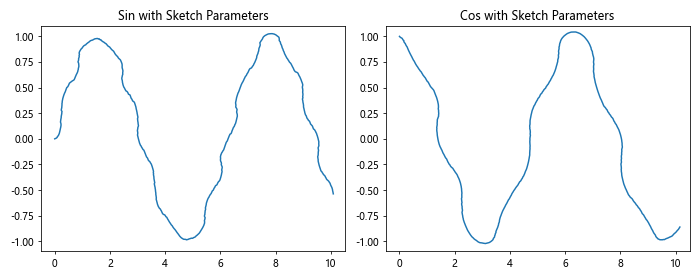
This example shows how to apply different sketch parameters to plots in different subplots, allowing for easy comparison of the effects.
Advanced Techniques with Matplotlib.artist.Artist.get_sketch_params() in Python
Let’s explore some advanced techniques that leverage Matplotlib.artist.Artist.get_sketch_params() in Python to create more sophisticated visualizations:
Creating a Custom Sketch Style Legend
import matplotlib.pyplot as plt
import matplotlib.patches as patches

fig, ax = plt.subplots()

styles = [
    {'scale': 1, 'length': 50, 'randomness': 0.1},
    {'scale': 3, 'length': 75, 'randomness': 0.3},
    {'scale': 5, 'length': 100, 'randomness': 0.5}
]

for i, style in enumerate(styles):
    line = patches.Rectangle((0, i), 1, 0.8, fill=False, label=f'Style {i+1} how2matplotlib.com')
    line.set_sketch_params(**style)
    ax.add_patch(line)

    params = line.get_sketch_params()
    print(f"Style {i+1} parameters: {params}")

ax.set_ylim(-0.5, len(styles) - 0.5)
ax.set_xlim(-0.1, 1.1)
ax.set_yticks(range(len(styles)))
ax.set_yticklabels([f'Style {i+1}' for i in range(len(styles))])
ax.set_title("Custom Sketch Style Legend")

plt.tight_layout()
plt.show()
Output:
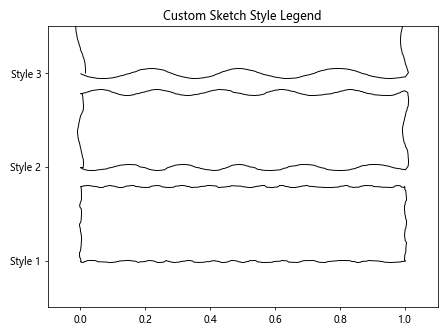
This example creates a custom legend that showcases different sketch styles, using get_sketch_params() to verify the applied styles.
Dynamically Adjusting Sketch Parameters Based on Data
import matplotlib.pyplot as plt
import numpy as np

fig, ax = plt.subplots()

x = np.linspace(0, 10, 100)
y = np.sin(x)

line, = ax.plot(x, y, label='how2matplotlib.com')

for i, yi in enumerate(y):
    scale = 1 + abs(yi) * 5
    line.set_sketch_params(scale=scale, length=50, randomness=0.3)

    if i % 10 == 0:
        params = line.get_sketch_params()
        print(f"Point {i}: y={yi:.2f}, sketch parameters: {params}")

plt.title("Dynamically Adjusted Sketch Parameters")
plt.show()
Output:
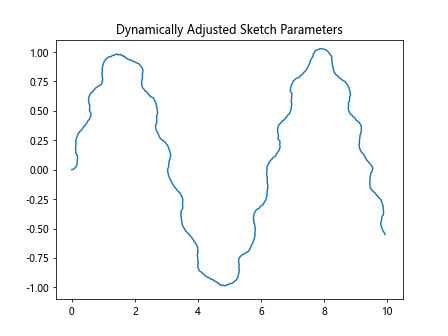
This example demonstrates how to dynamically adjust sketch parameters based on the data values, creating a visualization where the sketch effect varies along the line.
Troubleshooting Common Issues with Matplotlib.artist.Artist.get_sketch_params() in Python
When working with Matplotlib.artist.Artist.get_sketch_params() in Python, you may encounter some common issues. Let’s address these and provide solutions:
Issue 1: Sketch Parameters Not Visible
Sometimes, you might set sketch parameters but not see any visible effect. This can happen if the artist’s line width is too small:
import matplotlib.pyplot as plt

fig, (ax1, ax2) = plt.subplots(1, 2, figsize=(10, 4))

line1, = ax1.plot([1, 2, 3, 4], [1, 4, 2, 3], linewidth=0.5, label='Thin line how2matplotlib.com')
line1.set_sketch_params(scale=5, length=100, randomness=0.3)

line2, = ax2.plot([1, 2, 3, 4], [1, 4, 2, 3], linewidth=2, label='Thick line how2matplotlib.com')
line2.set_sketch_params(scale=5, length=100, randomness=0.3)

print("Thin line sketch params:", line1.get_sketch_params())
print("Thick line sketch params:", line2.get_sketch_params())

ax1.set_title("Thin Line (Sketch Not Visible)")
ax2.set_title("Thick Line (Sketch Visible)")

plt.tight_layout()
plt.show()
Output:
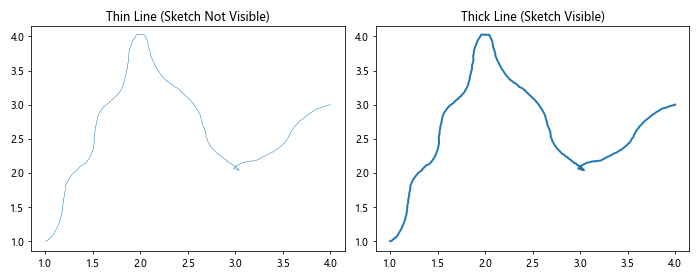
Solution: Increase the line width to make the sketch effect more visible.
Issue 2: Inconsistent Sketch Appearance Across Plots
You might notice that the sketch appearance looks different when applied to plots of different scales:
import matplotlib.pyplot as plt
import numpy as np

fig, (ax1, ax2) = plt.subplots(1, 2, figsize=(10, 4))

x1 = np.linspace(0, 1, 100)
y1 = np.sin(2 * np.pi * x1)
line1, = ax1.plot(x1, y1, label='Small scale how2matplotlib.com')
line1.set_sketch_params(scale=5, length=100, randomness=0.3)

x2 = np.linspace(0, 100, 100)
y2 = np.sin(2 * np.pi * x2 / 100) * 100
line2, = ax2.plot(x2, y2, label='Large scale how2matplotlib.com')
line2.set_sketch_params(scale=5, length=100, randomness=0.3)

print("Small scale sketch params:", line1.get_sketch_params())
print("Large scale sketch params:", line2.get_sketch_params())

ax1.set_title("Small Scale Plot")
ax2.set_title("Large Scale Plot")

plt.tight_layout()
plt.show()
Output:
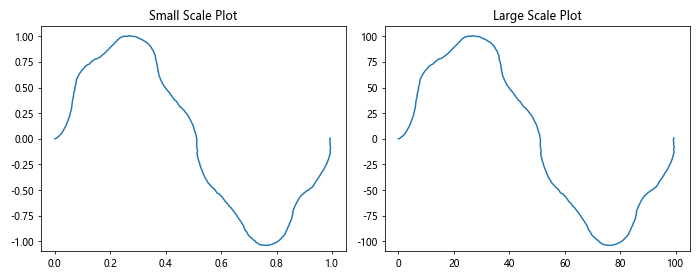
Solution: Adjust the sketch parameters based on the scale of your plot to maintain a consistent appearance.
Best Practices for Using Matplotlib.artist.Artist.get_sketch_params() in Python
To make the most of Matplotlib.artist.Artist.get_sketch_params() in Python, consider the following best practices:
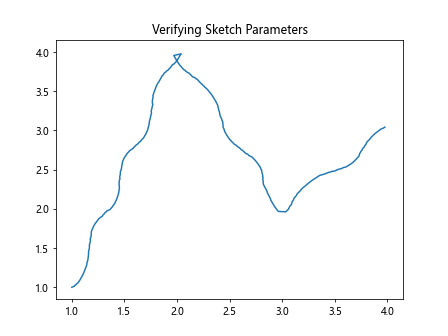
- Always verify sketch parameters after setting them:
import matplotlib.pyplot as plt

fig, ax = plt.subplots()
line, = ax.plot([1, 2, 3, 4], [1, 4, 2, 3], label='how2matplotlib.com')
line.set_sketch_params(scale=5, length=100, randomness=0.3)

params = line.get_sketch_params()
print(f"Verified sketch parameters: {params}")

plt.title("Verifying Sketch Parameters")
plt.show()
Output:
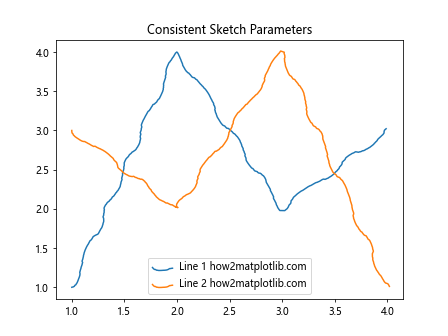
- Use consistent sketch parameters across related artists:
import matplotlib.pyplot as plt

fig, ax = plt.subplots()

sketch_params = (3, 75, 0.2)

line1, = ax.plot([1, 2, 3, 4], [1, 4, 2, 3], label='Line 1 how2matplotlib.com')
line2, = ax.plot([1, 2, 3, 4], [3, 2, 4, 1], label='Line 2 how2matplotlib.com')

line1.set_sketch_params(*sketch_params)
line2.set_sketch_params(*sketch_params)

print("Line 1 sketch params:", line1.get_sketch_params())
print("Line 2 sketch params:", line2.get_sketch_params())

plt.title("Consistent Sketch Parameters")
plt.legend()
plt.show()
Output:
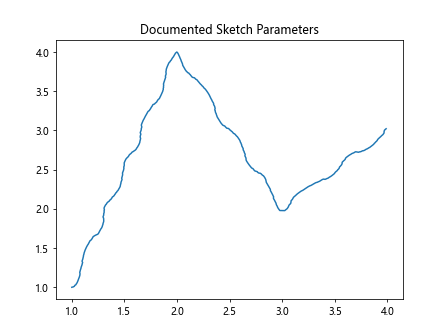
- Document your use of sketch parameters:
import matplotlib.pyplot as plt

fig, ax = plt.subplots()

# Define sketch parameters
sketch_params = {
    'scale': 3,      # Controls the amplitude of the wiggle
    'length': 75,    # Controls the wavelength of the wiggle
    'randomness': 0.2  # Controls the randomness of the wiggle
}

line, = ax.plot([1, 2, 3, 4], [1, 4, 2, 3], label='how2matplotlib.com')
line.set_sketch_params(**sketch_params)

print("Applied sketch parameters:", line.get_sketch_params())

plt.title("Documented Sketch Parameters")
plt.show()
Output:
Conclusion: Mastering Matplotlib.artist.Artist.get_sketch_params() in Python
Throughout this comprehensive guide, we’ve explored the ins and outs of using Matplotlib.artist.Artist.get_sketch_params() in Python. We’ve covered everything from basic usage to advanced techniques, troubleshooting common issues, and best practices.
Matplotlib.artist.Artist.get_sketch_params() in Python is a powerful tool for retrieving and verifying sketch parameters of Matplotlib artists. By mastering this method, you can create more visually interesting and dynamic plots, add sketch-like effects to your visualizations, and ensure consistency across your Matplotlib projects.