Comprehensive Guide to Matplotlib.artist.Artist.get_picker() in Python
Matplotlib.artist.Artist.get_picker() in Python is a powerful method that plays a crucial role in creating interactive visualizations. This function is an essential part of the Matplotlib library, which is widely used for creating static, animated, and interactive plots in Python. In this comprehensive guide, we’ll explore the ins and outs of Matplotlib.artist.Artist.get_picker(), its usage, and how it can enhance your data visualization projects.
Understanding Matplotlib.artist.Artist.get_picker() in Python
Matplotlib.artist.Artist.get_picker() in Python is a method that returns the picker object used by an Artist. The picker is responsible for determining whether the artist is hit by a mouse event. This functionality is particularly useful when creating interactive plots where you want to respond to user input, such as clicking on specific elements of your visualization.
Let’s start with a simple example to demonstrate how to use Matplotlib.artist.Artist.get_picker():
import matplotlib.pyplot as plt

fig, ax = plt.subplots()
line, = ax.plot([1, 2, 3, 4], [1, 4, 2, 3], picker=5)
plt.title("How2matplotlib.com - Simple Picker Example")

picker = line.get_picker()
print(f"The picker value is: {picker}")

plt.show()
Output:
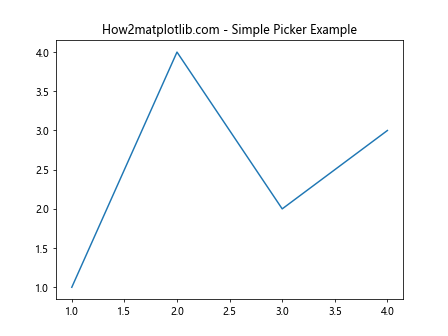
In this example, we create a simple line plot and set the picker value to 5. We then use the get_picker() method to retrieve the picker value and print it. This demonstrates the basic usage of Matplotlib.artist.Artist.get_picker() in Python.
Setting and Getting Picker Values with Matplotlib.artist.Artist.get_picker()
Matplotlib.artist.Artist.get_picker() in Python works hand in hand with the set_picker() method. While get_picker() retrieves the current picker value, set_picker() allows you to set or modify the picker value. Let’s explore how these methods work together:
import matplotlib.pyplot as plt

fig, ax = plt.subplots()
scatter = ax.scatter([1, 2, 3, 4], [1, 4, 2, 3])
plt.title("How2matplotlib.com - Setting and Getting Picker Values")

# Set the picker value
scatter.set_picker(True)

# Get the picker value
picker = scatter.get_picker()
print(f"The picker value is: {picker}")

plt.show()
Output:
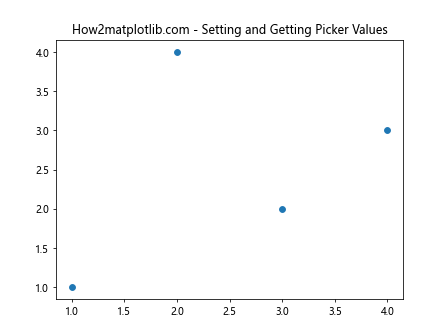
In this example, we create a scatter plot and set the picker value to True using set_picker(). We then use Matplotlib.artist.Artist.get_picker() in Python to retrieve and print the picker value.
Types of Picker Values in Matplotlib.artist.Artist.get_picker()
Matplotlib.artist.Artist.get_picker() in Python can return different types of values, depending on how the picker was set. Let’s explore the various types of picker values:
- Boolean Picker:
import matplotlib.pyplot as plt

fig, ax = plt.subplots()
line, = ax.plot([1, 2, 3, 4], [1, 4, 2, 3])
plt.title("How2matplotlib.com - Boolean Picker")

line.set_picker(True)
picker = line.get_picker()
print(f"Boolean picker value: {picker}")

plt.show()
Output:
- Float Picker:
import matplotlib.pyplot as plt

fig, ax = plt.subplots()
scatter = ax.scatter([1, 2, 3, 4], [1, 4, 2, 3])
plt.title("How2matplotlib.com - Float Picker")

scatter.set_picker(5.0)
picker = scatter.get_picker()
print(f"Float picker value: {picker}")

plt.show()
Output:
- Function Picker:
import matplotlib.pyplot as plt

def custom_picker(artist, mouseevent):
    return True if mouseevent.xdata < 2 else False

fig, ax = plt.subplots()
line, = ax.plot([1, 2, 3, 4], [1, 4, 2, 3])
plt.title("How2matplotlib.com - Function Picker")

line.set_picker(custom_picker)
picker = line.get_picker()
print(f"Function picker: {picker}")

plt.show()
Output:
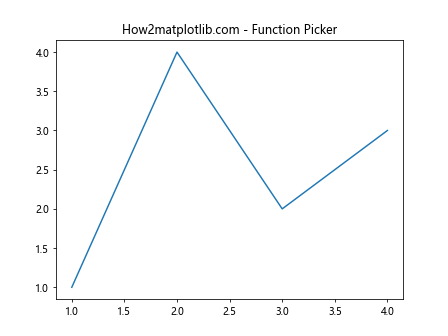
These examples demonstrate the different types of picker values that Matplotlib.artist.Artist.get_picker() in Python can return.
Using Matplotlib.artist.Artist.get_picker() with Different Artist Types
Matplotlib.artist.Artist.get_picker() in Python can be used with various types of artists in Matplotlib. Let's explore how to use it with different artist types:
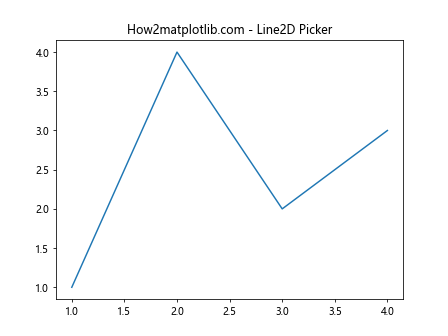
- Line2D:
import matplotlib.pyplot as plt

fig, ax = plt.subplots()
line, = ax.plot([1, 2, 3, 4], [1, 4, 2, 3], picker=True)
plt.title("How2matplotlib.com - Line2D Picker")

picker = line.get_picker()
print(f"Line2D picker value: {picker}")

plt.show()
Output:
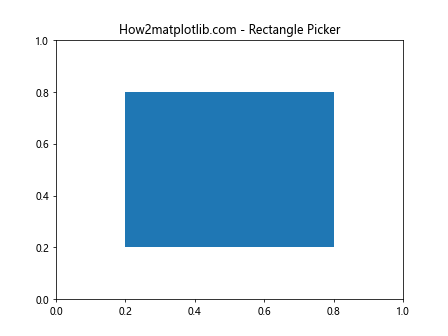
- Rectangle:
import matplotlib.pyplot as plt

fig, ax = plt.subplots()
rect = plt.Rectangle((0.2, 0.2), 0.6, 0.6, picker=True)
ax.add_patch(rect)
plt.title("How2matplotlib.com - Rectangle Picker")

picker = rect.get_picker()
print(f"Rectangle picker value: {picker}")

plt.show()
Output:
- Text:
import matplotlib.pyplot as plt

fig, ax = plt.subplots()
text = ax.text(0.5, 0.5, "How2matplotlib.com", picker=True)
plt.title("How2matplotlib.com - Text Picker")

picker = text.get_picker()
print(f"Text picker value: {picker}")

plt.show()
Output:
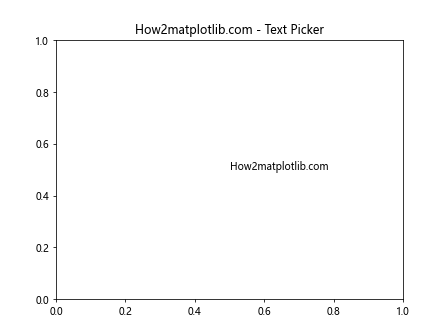
These examples showcase how Matplotlib.artist.Artist.get_picker() in Python can be used with different types of Matplotlib artists.
Implementing Interactive Features with Matplotlib.artist.Artist.get_picker()
Matplotlib.artist.Artist.get_picker() in Python is particularly useful when implementing interactive features in your visualizations. Let's explore some examples of how to use it to create interactive plots:
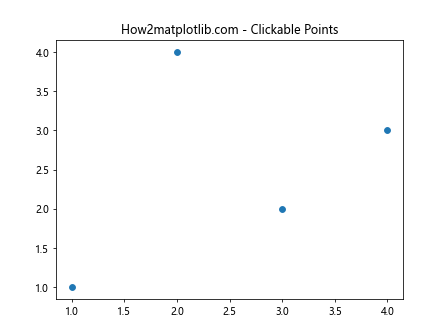
- Clickable Points:
import matplotlib.pyplot as plt

def on_pick(event):
    artist = event.artist
    xdata, ydata = artist.get_data()
    ind = event.ind
    print(f'You clicked on point: ({xdata[ind[0]]:.2f}, {ydata[ind[0]]:.2f})')

fig, ax = plt.subplots()
line, = ax.plot([1, 2, 3, 4], [1, 4, 2, 3], 'o', picker=5)
plt.title("How2matplotlib.com - Clickable Points")

fig.canvas.mpl_connect('pick_event', on_pick)

plt.show()
Output:
- Hoverable Lines:
import matplotlib.pyplot as plt

def on_hover(event):
    if event.inaxes == ax:
        for line in ax.get_lines():
            if line.contains(event)[0]:
                line.set_linewidth(3)
            else:
                line.set_linewidth(1)
        fig.canvas.draw_idle()

fig, ax = plt.subplots()
line1, = ax.plot([1, 2, 3, 4], [1, 4, 2, 3], picker=True)
line2, = ax.plot([1, 2, 3, 4], [2, 3, 4, 1], picker=True)
plt.title("How2matplotlib.com - Hoverable Lines")

fig.canvas.mpl_connect('motion_notify_event', on_hover)

plt.show()
Output:
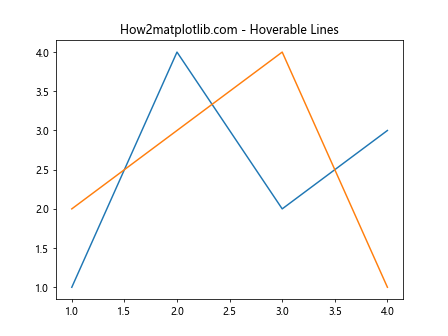
These examples demonstrate how Matplotlib.artist.Artist.get_picker() in Python can be used to create interactive visualizations with clickable and hoverable elements.
Advanced Techniques with Matplotlib.artist.Artist.get_picker()
Matplotlib.artist.Artist.get_picker() in Python can be used in more advanced scenarios to create complex interactive visualizations. Let's explore some advanced techniques:
- Custom Picker Function:
import matplotlib.pyplot as plt
import numpy as np

def custom_picker(artist, mouseevent):
    if mouseevent.xdata is None:
        return False, {}
    xdata = artist.get_xdata()
    ydata = artist.get_ydata()
    maxd = 0.05
    d = np.sqrt((xdata - mouseevent.xdata)**2 + (ydata - mouseevent.ydata)**2)
    ind = np.nonzero(np.less_equal(d, maxd))
    if len(ind[0]) > 0:
        return True, {'ind': ind[0]}
    else:
        return False, {}

fig, ax = plt.subplots()
line, = ax.plot([1, 2, 3, 4], [1, 4, 2, 3], 'o-', picker=custom_picker)
plt.title("How2matplotlib.com - Custom Picker Function")

def on_pick(event):
    if event.artist == line:
        ind = event.ind
        print(f'You picked point {ind}')

fig.canvas.mpl_connect('pick_event', on_pick)

plt.show()
Output:
- Multiple Picker Types:
import matplotlib.pyplot as plt

def on_pick(event):
    artist = event.artist
    if isinstance(artist, plt.Line2D):
        print("You clicked on a line")
    elif isinstance(artist, plt.Text):
        print("You clicked on text")

fig, ax = plt.subplots()
line, = ax.plot([1, 2, 3, 4], [1, 4, 2, 3], picker=5)
text = ax.text(2, 3, "How2matplotlib.com", picker=True)
plt.title("How2matplotlib.com - Multiple Picker Types")

fig.canvas.mpl_connect('pick_event', on_pick)

plt.show()
Output:
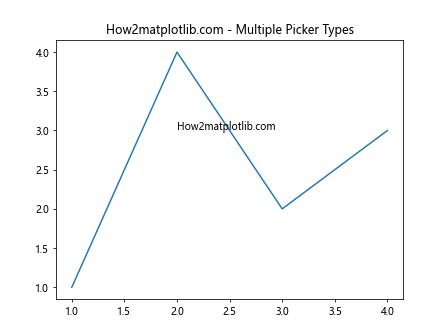
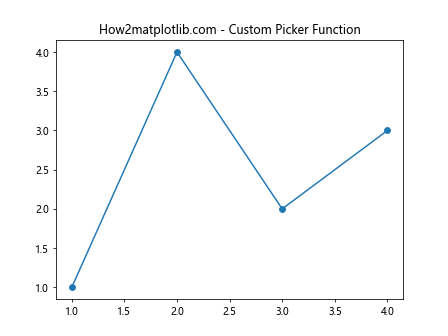
These advanced examples showcase how Matplotlib.artist.Artist.get_picker() in Python can be used to create more sophisticated interactive visualizations.
Best Practices for Using Matplotlib.artist.Artist.get_picker()
When working with Matplotlib.artist.Artist.get_picker() in Python, it's important to follow some best practices to ensure your code is efficient and maintainable:
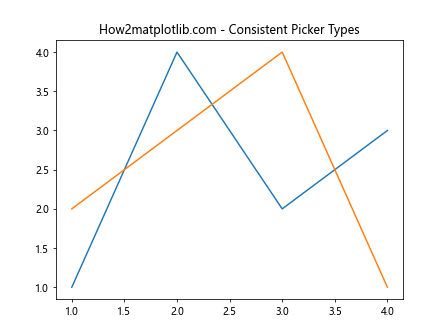
- Use Consistent Picker Types:
import matplotlib.pyplot as plt

fig, ax = plt.subplots()
line1, = ax.plot([1, 2, 3, 4], [1, 4, 2, 3], picker=5)
line2, = ax.plot([1, 2, 3, 4], [2, 3, 4, 1], picker=5)
plt.title("How2matplotlib.com - Consistent Picker Types")

print(f"Line1 picker: {line1.get_picker()}")
print(f"Line2 picker: {line2.get_picker()}")

plt.show()
Output:
- Check Picker Values:
import matplotlib.pyplot as plt

fig, ax = plt.subplots()
line, = ax.plot([1, 2, 3, 4], [1, 4, 2, 3])
plt.title("How2matplotlib.com - Check Picker Values")

picker = line.get_picker()
if picker is None:
    print("No picker set")
    line.set_picker(5)
else:
    print(f"Picker value: {picker}")

plt.show()
Output:
- Use Appropriate Picker Values:
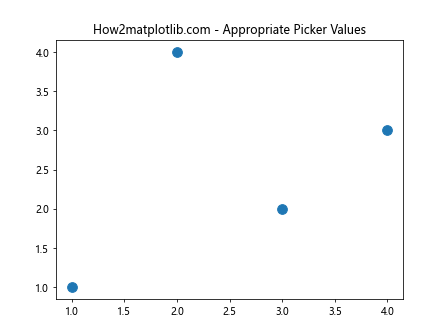
import matplotlib.pyplot as plt

fig, ax = plt.subplots()
scatter = ax.scatter([1, 2, 3, 4], [1, 4, 2, 3], s=100)
plt.title("How2matplotlib.com - Appropriate Picker Values")

scatter.set_picker(True)  # For scatter plots, True is often sufficient
picker = scatter.get_picker()
print(f"Scatter picker value: {picker}")

plt.show()
Output:
These examples demonstrate best practices for using Matplotlib.artist.Artist.get_picker() in Python to create efficient and maintainable interactive visualizations.
Troubleshooting Common Issues with Matplotlib.artist.Artist.get_picker()
When working with Matplotlib.artist.Artist.get_picker() in Python, you may encounter some common issues. Let's explore how to troubleshoot these problems:
- Picker Not Responding:
import matplotlib.pyplot as plt

def on_pick(event):
    print("Pick event triggered")

fig, ax = plt.subplots()
line, = ax.plot([1, 2, 3, 4], [1, 4, 2, 3], picker=5)
plt.title("How2matplotlib.com - Troubleshooting Picker")

# Ensure the pick_event is connected
cid = fig.canvas.mpl_connect('pick_event', on_pick)

# Check if the picker is set correctly
picker = line.get_picker()
print(f"Picker value: {picker}")

plt.show()
Output:
- Incorrect Picker Type:
import matplotlib.pyplot as plt

fig, ax = plt.subplots()
line, = ax.plot([1, 2, 3, 4], [1, 4, 2, 3])
plt.title("How2matplotlib.com - Incorrect Picker Type")

# Attempt to set an invalid picker type
try:
    line.set_picker("invalid")
except TypeError as e:
    print(f"Error: {e}")
    print("Setting picker to a valid value")
    line.set_picker(5)

picker = line.get_picker()
print(f"Corrected picker value: {picker}")

plt.show()
- Picker Conflicts:
import matplotlib.pyplot as plt

def on_pick(event):
    artist = event.artist
    print(f"Picked artist: {artist}")

fig, ax = plt.subplots()
line1, = ax.plot([1, 2, 3, 4], [1, 4, 2, 3], picker=5, label="Line 1")
line2, = ax.plot([1, 2, 3, 4], [2, 3, 4, 1], picker=5, label="Line 2")
plt.title("How2matplotlib.com - Picker Conflicts")

ax.legend()

fig.canvas.mpl_connect('pick_event', on_pick)

print(f"Line1 picker: {line1.get_picker()}")
print(f"Line2 picker: {line2.get_picker()}")

plt.show()
Output:
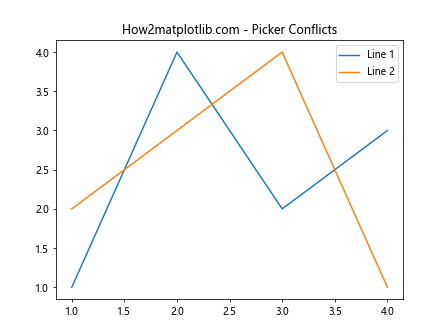
These examples demonstrate how to troubleshoot common issues when using Matplotlib.artist.Artist.get_picker() in Python.
Integrating Matplotlib.artist.Artist.get_picker() with Other Libraries
Matplotlib.artist.Artist.get_picker() in Python can be integrated with other libraries to create more complex and interactive visualizations. Let's explore some examples:
- Integration with NumPy:
import matplotlib.pyplot as plt
import numpy as np

def on_pick(event):
    ind = event.ind
    print(f"Picked points: {data[ind]}")

fig, ax = plt.subplots()
data = np.random.rand(100, 2)
scatter = ax.scatter(data[:, 0], data[:, 1], picker=True)
plt.title("How2matplotlib.com - Integration with NumPy")

fig.canvas.mpl_connect('pick_event', on_pick)

plt.show()
Output:
- Integration with Pandas:
import matplotlib.pyplot as plt
import pandas as pd

def on_pick(event):
    ind = event.ind
    print(f"Picked data: {df.iloc[ind]}")

df = pd.DataFrame({
    'x': [1,2, 3, 4],
    'y': [1, 4, 2, 3],
    'label': ['A', 'B', 'C', 'D']
})

fig, ax = plt.subplots()
scatter = ax.scatter(df['x'], df['y'], picker=True)
plt.title("How2matplotlib.com - Integration with Pandas")

for i, label in enumerate(df['label']):
    ax.annotate(label, (df['x'][i], df['y'][i]))

fig.canvas.mpl_connect('pick_event', on_pick)

plt.show()
Output:
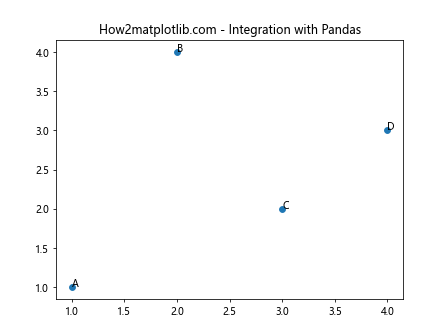
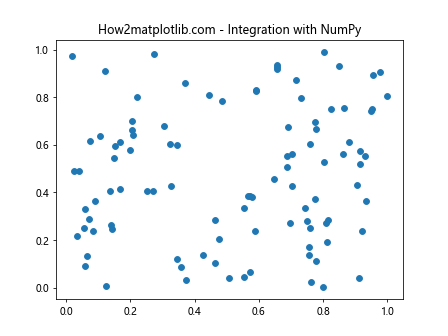
These examples demonstrate how Matplotlib.artist.Artist.get_picker() in Python can be integrated with other popular libraries like NumPy and Pandas to create more powerful interactive visualizations.
Performance Considerations for Matplotlib.artist.Artist.get_picker()
When using Matplotlib.artist.Artist.get_picker() in Python, it's important to consider performance, especially when dealing with large datasets or complex visualizations. Here are some tips to optimize performance:
- Use Appropriate Picker Tolerance:
import matplotlib.pyplot as plt
import numpy as np

fig, ax = plt.subplots()
x = np.linspace(0, 10, 1000)
y = np.sin(x)
line, = ax.plot(x, y, picker=0.1)  # Small picker tolerance for better performance
plt.title("How2matplotlib.com - Optimized Picker Tolerance")

def on_pick(event):
    print(f"Picked point at x={event.mouseevent.xdata:.2f}, y={event.mouseevent.ydata:.2f}")

fig.canvas.mpl_connect('pick_event', on_pick)

plt.show()
Output:
- Use Blitting for Faster Updates:
import matplotlib.pyplot as plt
import numpy as np

fig, ax = plt.subplots()
x = np.linspace(0, 10, 100)
y = np.sin(x)
line, = ax.plot(x, y, picker=5)
plt.title("How2matplotlib.com - Blitting for Faster Updates")

def on_pick(event):
    if event.artist == line:
        line.set_color('red')
        fig.canvas.draw_idle()
        fig.canvas.flush_events()

fig.canvas.mpl_connect('pick_event', on_pick)

# Enable blitting
fig.canvas.draw()
ax.draw_artist(line)
fig.canvas.blit(ax.bbox)

plt.show()
Output:
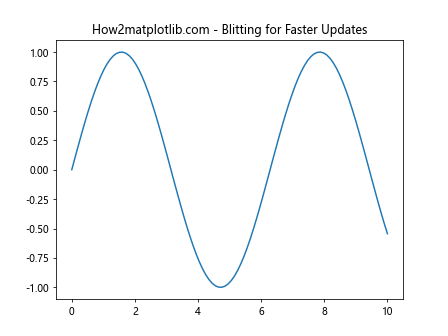
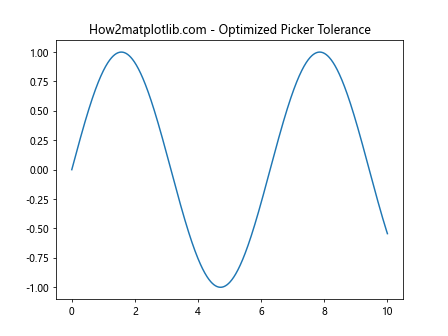
These examples demonstrate how to optimize performance when using Matplotlib.artist.Artist.get_picker() in Python for large datasets or complex visualizations.
Future Developments and Trends in Matplotlib.artist.Artist.get_picker()
As Matplotlib continues to evolve, we can expect to see new developments and trends in the use of Matplotlib.artist.Artist.get_picker() in Python. While it's difficult to predict exact future changes, we can speculate on some potential improvements:
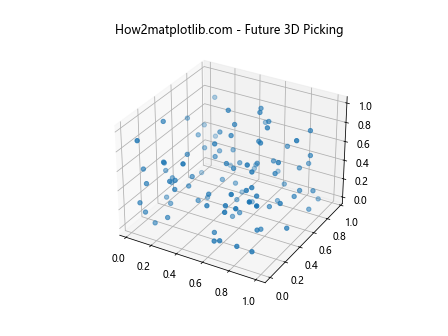
- Enhanced 3D Picking:
import matplotlib.pyplot as plt
from mpl_toolkits.mplot3d import Axes3D
import numpy as np

fig = plt.figure()
ax = fig.add_subplot(111, projection='3d')

x = np.random.rand(100)
y = np.random.rand(100)
z = np.random.rand(100)
scatter = ax.scatter(x, y, z, picker=True)
plt.title("How2matplotlib.com - Future 3D Picking")

def on_pick(event):
    ind = event.ind
    print(f"Picked point: ({x[ind[0]]:.2f}, {y[ind[0]]:.2f}, {z[ind[0]]:.2f})")

fig.canvas.mpl_connect('pick_event', on_pick)

plt.show()
Output:
- Machine Learning Integration:
import matplotlib.pyplot as plt
import numpy as np
from sklearn.cluster import KMeans

# Generate sample data
np.random.seed(0)
X = np.random.rand(100, 2)

# Perform K-means clustering
kmeans = KMeans(n_clusters=3, random_state=0).fit(X)

fig, ax = plt.subplots()
scatter = ax.scatter(X[:, 0], X[:, 1], c=kmeans.labels_, picker=True)
plt.title("How2matplotlib.com - ML Integration")

def on_pick(event):
    ind = event.ind
    cluster = kmeans.labels_[ind[0]]
    print(f"Picked point belongs to cluster {cluster}")

fig.canvas.mpl_connect('pick_event', on_pick)

plt.show()
Output:
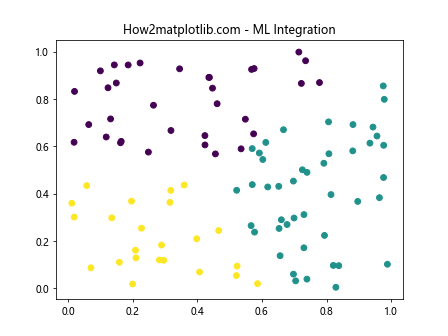
These examples showcase potential future developments in Matplotlib.artist.Artist.get_picker() in Python, including enhanced 3D picking and integration with machine learning libraries.
Conclusion
Matplotlib.artist.Artist.get_picker() in Python is a powerful tool for creating interactive visualizations. Throughout this comprehensive guide, we've explored its various aspects, from basic usage to advanced techniques and potential future developments. By mastering Matplotlib.artist.Artist.get_picker(), you can create more engaging and interactive data visualizations that allow users to explore and interact with your data in meaningful ways.