Comprehensive Guide to Using Matplotlib.artist.Artist.get_label() in Python for Data Visualization
Matplotlib.artist.Artist.get_label() in Python is a crucial method for managing labels in Matplotlib plots. This comprehensive guide will explore the various aspects of using Matplotlib.artist.Artist.get_label() in Python, providing detailed explanations and practical examples to help you master this essential function for data visualization.
Understanding Matplotlib.artist.Artist.get_label() in Python
Matplotlib.artist.Artist.get_label() in Python is a method that belongs to the Artist class in Matplotlib. This method is used to retrieve the label associated with an Artist object. Labels are essential for identifying and distinguishing different elements in a plot, such as lines, markers, or patches. By using Matplotlib.artist.Artist.get_label() in Python, you can access and manipulate these labels programmatically.
Let’s start with a simple example to demonstrate how to use Matplotlib.artist.Artist.get_label() in Python:
import matplotlib.pyplot as plt

# Create a figure and axis
fig, ax = plt.subplots()

# Plot a line and set its label
line, = ax.plot([1, 2, 3, 4], [1, 4, 2, 3], label='how2matplotlib.com')

# Get the label using get_label()
label = line.get_label()

print(f"The label of the line is: {label}")

plt.show()
Output:
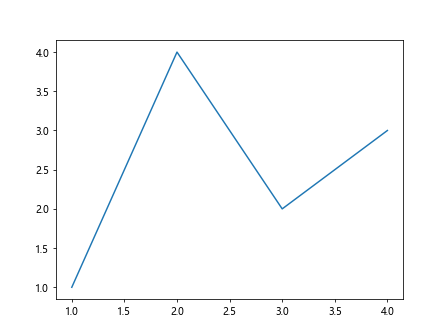
In this example, we create a simple line plot and set its label to ‘how2matplotlib.com’. We then use Matplotlib.artist.Artist.get_label() in Python to retrieve the label and print it.
The Importance of Labels in Matplotlib
Labels play a crucial role in data visualization using Matplotlib. They help viewers understand the meaning of different elements in a plot and provide context for the data being displayed. Matplotlib.artist.Artist.get_label() in Python allows you to access these labels programmatically, which is particularly useful when you need to manipulate or update labels dynamically.
Here’s an example that demonstrates the importance of labels in a multi-line plot:
import matplotlib.pyplot as plt

# Create data for two lines
x = [1, 2, 3, 4, 5]
y1 = [1, 4, 2, 3, 5]
y2 = [5, 3, 4, 2, 1]

# Create a figure and axis
fig, ax = plt.subplots()

# Plot two lines with labels
line1, = ax.plot(x, y1, label='how2matplotlib.com Line 1')
line2, = ax.plot(x, y2, label='how2matplotlib.com Line 2')

# Get and print the labels
print(f"Label of line1: {line1.get_label()}")
print(f"Label of line2: {line2.get_label()}")

# Add a legend to the plot
ax.legend()

plt.show()
Output:
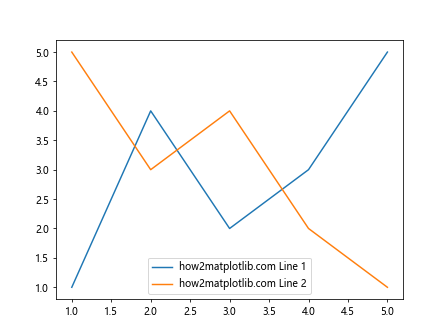
In this example, we create two lines with different labels. We use Matplotlib.artist.Artist.get_label() in Python to retrieve and print the labels for both lines. The legend is then added to the plot, which uses these labels to identify each line.
Using Matplotlib.artist.Artist.get_label() in Python with Different Plot Types
Matplotlib.artist.Artist.get_label() in Python can be used with various types of plots, not just line plots. Let’s explore how to use this method with different plot types.
Bar Plots
Bar plots are commonly used to compare quantities across different categories. Here’s an example of using Matplotlib.artist.Artist.get_label() in Python with a bar plot:
import matplotlib.pyplot as plt
import numpy as np

# Create data for the bar plot
categories = ['A', 'B', 'C', 'D']
values = [3, 7, 2, 5]

# Create a figure and axis
fig, ax = plt.subplots()

# Create the bar plot
bars = ax.bar(categories, values, label='how2matplotlib.com Bars')

# Get and print the label of the bar container
print(f"Label of the bar container: {bars.get_label()}")

# Add a legend to the plot
ax.legend()

plt.show()
Output:
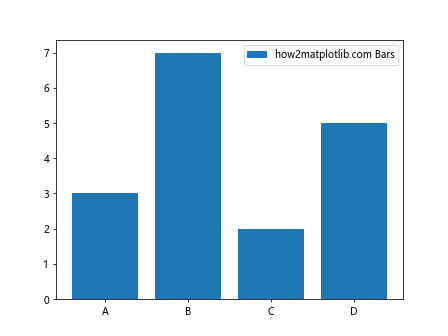
In this example, we create a bar plot and set a label for the entire bar container. We then use Matplotlib.artist.Artist.get_label() in Python to retrieve and print this label.
Scatter Plots
Scatter plots are useful for visualizing the relationship between two variables. Here’s how to use Matplotlib.artist.Artist.get_label() in Python with a scatter plot:
import matplotlib.pyplot as plt
import numpy as np

# Create data for the scatter plot
x = np.random.rand(50)
y = np.random.rand(50)

# Create a figure and axis
fig, ax = plt.subplots()

# Create the scatter plot
scatter = ax.scatter(x, y, label='how2matplotlib.com Scatter')

# Get and print the label of the scatter plot
print(f"Label of the scatter plot: {scatter.get_label()}")

# Add a legend to the plot
ax.legend()

plt.show()
Output:
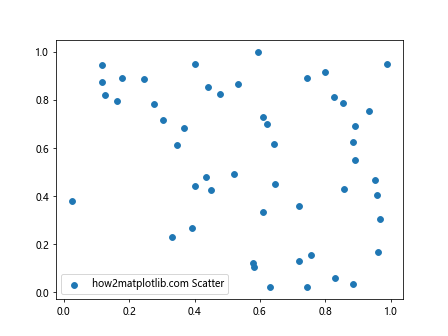
In this example, we create a scatter plot with random data points and set a label for it. We then use Matplotlib.artist.Artist.get_label() in Python to retrieve and print the label of the scatter plot.
Advanced Usage of Matplotlib.artist.Artist.get_label() in Python
Now that we’ve covered the basics, let’s explore some more advanced uses of Matplotlib.artist.Artist.get_label() in Python.
Using get_label() with Subplots
When working with multiple subplots, Matplotlib.artist.Artist.get_label() in Python can be used to manage labels for each subplot individually. Here’s an example:
import matplotlib.pyplot as plt

# Create a figure with two subplots
fig, (ax1, ax2) = plt.subplots(1, 2, figsize=(10, 4))

# Plot data in the first subplot
line1, = ax1.plot([1, 2, 3, 4], [1, 4, 2, 3], label='how2matplotlib.com Subplot 1')

# Plot data in the second subplot
line2, = ax2.plot([1, 2, 3, 4], [3, 1, 4, 2], label='how2matplotlib.com Subplot 2')

# Get and print labels for both subplots
print(f"Label in subplot 1: {line1.get_label()}")
print(f"Label in subplot 2: {line2.get_label()}")

# Add legends to both subplots
ax1.legend()
ax2.legend()

plt.tight_layout()
plt.show()
Output:
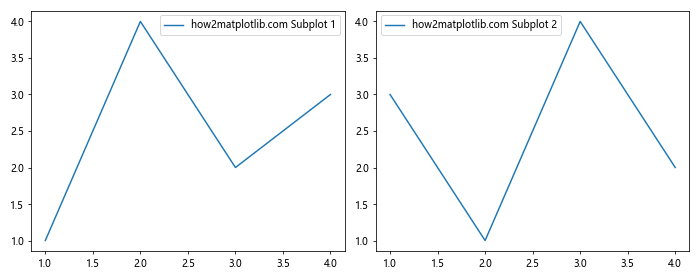
In this example, we create two subplots and use Matplotlib.artist.Artist.get_label() in Python to retrieve the labels for the lines in each subplot.
Using get_label() with Custom Artists
Matplotlib.artist.Artist.get_label() in Python can also be used with custom artists. Here’s an example using a custom text artist:
import matplotlib.pyplot as plt

# Create a figure and axis
fig, ax = plt.subplots()

# Create a custom text artist
text = ax.text(0.5, 0.5, 'how2matplotlib.com Custom Text', ha='center', va='center')

# Set a label for the text artist
text.set_label('Custom Text Label')

# Get and print the label of the text artist
print(f"Label of the text artist: {text.get_label()}")

# Plot some data to make the figure more interesting
ax.plot([0, 1], [0, 1], 'r-')

plt.show()
Output:
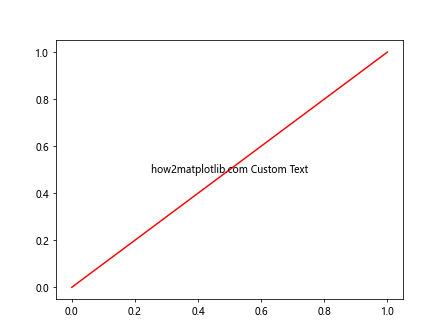
In this example, we create a custom text artist, set a label for it, and then use Matplotlib.artist.Artist.get_label() in Python to retrieve and print the label.
Practical Applications of Matplotlib.artist.Artist.get_label() in Python
Let’s explore some practical applications of Matplotlib.artist.Artist.get_label() in Python for real-world data visualization scenarios.
Dynamic Legend Management
One practical use of Matplotlib.artist.Artist.get_label() in Python is for dynamic legend management. Here’s an example that demonstrates how to update legend entries based on user interaction:
import matplotlib.pyplot as plt
import numpy as np

# Create data for multiple lines
x = np.linspace(0, 10, 100)
y1 = np.sin(x)
y2 = np.cos(x)
y3 = np.tan(x)

# Create a figure and axis
fig, ax = plt.subplots()

# Plot the lines with initial labels
line1, = ax.plot(x, y1, label='how2matplotlib.com Sin')
line2, = ax.plot(x, y2, label='how2matplotlib.com Cos')
line3, = ax.plot(x, y3, label='how2matplotlib.com Tan')

# Create a legend
legend = ax.legend()

# Function to toggle line visibility and update legend
def toggle_line(line):
    line.set_visible(not line.get_visible())
    label = line.get_label()
    if line.get_visible():
        label = label.replace('(hidden)', '')
    else:
        label += ' (hidden)'
    line.set_label(label)
    legend.get_texts()[lines.index(line)].set_text(label)
    plt.draw()

# Create buttons to toggle line visibility
ax_button1 = plt.axes([0.7, 0.05, 0.1, 0.075])
ax_button2 = plt.axes([0.81, 0.05, 0.1, 0.075])
ax_button3 = plt.axes([0.92, 0.05, 0.1, 0.075])

button1 = plt.Button(ax_button1, 'Toggle Sin')
button2 = plt.Button(ax_button2, 'Toggle Cos')
button3 = plt.Button(ax_button3, 'Toggle Tan')

lines = [line1, line2, line3]
button1.on_clicked(lambda event: toggle_line(line1))
button2.on_clicked(lambda event: toggle_line(line2))
button3.on_clicked(lambda event: toggle_line(line3))

plt.show()
Output:
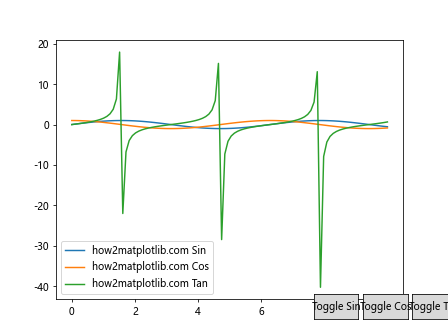
In this example, we create a plot with three lines and buttons to toggle their visibility. We use Matplotlib.artist.Artist.get_label() in Python to retrieve the current label of each line and update it dynamically when the line is hidden or shown.
Automated Plot Annotation
Another practical application of Matplotlib.artist.Artist.get_label() in Python is for automated plot annotation. Here’s an example that demonstrates how to automatically add annotations to the highest and lowest points of multiple lines:
import matplotlib.pyplot as plt
import numpy as np

# Create data for multiple lines
x = np.linspace(0, 10, 100)
y1 = np.sin(x)
y2 = np.cos(x)

# Create a figure and axis
fig, ax = plt.subplots()

# Plot the lines with labels
line1, = ax.plot(x, y1, label='how2matplotlib.com Sin')
line2, = ax.plot(x, y2, label='how2matplotlib.com Cos')

# Function to add annotations for max and min points
def annotate_extrema(line):
    y = line.get_ydata()
    max_idx = np.argmax(y)
    min_idx = np.argmin(y)

    label = line.get_label()
    ax.annotate(f'{label} Max', xy=(x[max_idx], y[max_idx]), xytext=(0, 10),
                textcoords='offset points', ha='center', va='bottom',
                bbox=dict(boxstyle='round,pad=0.5', fc='yellow', alpha=0.5),
                arrowprops=dict(arrowstyle='->', connectionstyle='arc3,rad=0'))

    ax.annotate(f'{label} Min', xy=(x[min_idx], y[min_idx]), xytext=(0, -10),
                textcoords='offset points', ha='center', va='top',
                bbox=dict(boxstyle='round,pad=0.5', fc='yellow', alpha=0.5),
                arrowprops=dict(arrowstyle='->', connectionstyle='arc3,rad=0'))

# Add annotations for both lines
annotate_extrema(line1)
annotate_extrema(line2)

# Add a legend
ax.legend()

plt.show()
Output:
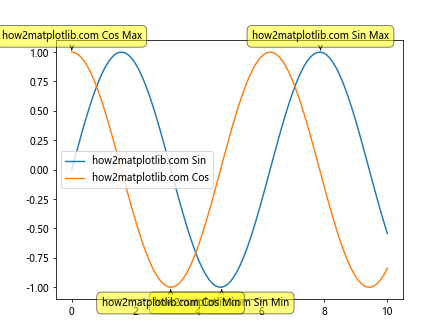
In this example, we use Matplotlib.artist.Artist.get_label() in Python to retrieve the label of each line and use it in the annotations for the maximum and minimum points of the lines.
Best Practices for Using Matplotlib.artist.Artist.get_label() in Python
When working with Matplotlib.artist.Artist.get_label() in Python, it’s important to follow some best practices to ensure your code is efficient, readable, and maintainable. Here are some tips:
- Always set meaningful labels: When creating artists (like lines, bars, or scatter plots), always set meaningful labels that describe the data they represent. This makes it easier to understand your plots and use Matplotlib.artist.Artist.get_label() in Python effectively.
Use get_label() for dynamic updates: Matplotlib.artist.Artist.get_label() in Python is particularly useful when you need to update labels dynamically. Instead of hardcoding label strings, use get_label() to retrieve the current label and modify it as needed.
Combine with set_label(): Often, you’ll want to use Matplotlib.artist.Artist.get_label() in Python in conjunction with set_label() to update labels. This allows you to modify existing labels without losing their original content.
Be aware of default labels: If you haven’t explicitly set a label for an artist, Matplotlib.artist.Artist.get_label() in Python will return a default label (usually a string representation of the artist object). Always check if the returned label is meaningful before using it.
Use with legend(): When working with legends, Matplotlib.artist.Artist.get_label() in Python can be very helpful. You can use it to dynamically update legend entries or create custom legend handlers.
Here’s an example that demonstrates these best practices: