Matplotlib Imshow
Matplotlib is a popular Python library for creating visualizations. One of the functionalities it offers is the imshow function, which can be used to display images in a plot.
In this article, we will explore how to use the imshow function in Matplotlib, and provide several examples to demonstrate its usage.
Basic Usage
The imshow function in Matplotlib is used to display images. It takes a 2D array (representing the image) as input and displays it in a plot. Let’s start with a basic example:
import numpy as np
import matplotlib.pyplot as plt

# Create a 2D array representing an image
image = np.random.random((10,10))

# Display the image using imshow
plt.imshow(image)
plt.show()
Output:
In this example, we first create a 10×10 random array using NumPy. Then we use the imshow function to display this array as an image. When we run this code, a plot will pop up displaying the random image.
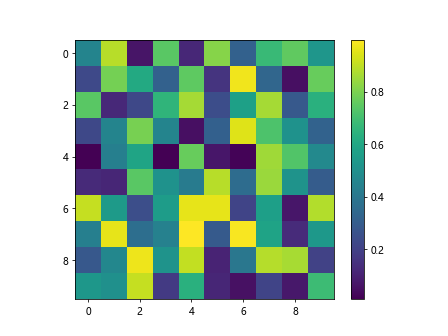
Image with Colormap
We can specify a colormap to use when displaying the image. Matplotlib provides a variety of colormaps that can be used to customize the look of the image. Let’s see an example:
import numpy as np
import matplotlib.pyplot as plt

# Create a 2D array representing an image
image = np.random.random((10,10))

# Display the image using imshow with a specific colormap
plt.imshow(image, cmap='viridis')
plt.colorbar()
plt.show()
Output:
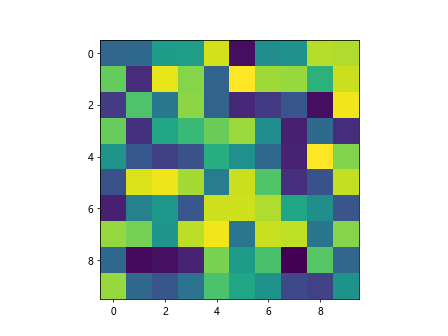
In this example, we have specified the viridis colormap when displaying the image. We have also added a colorbar to the plot, which shows how the colormap maps scalar values to colors.
Image with Interpolation
Matplotlib provides different interpolation methods to display images. Interpolation affects the smoothness of the image when it is displayed. Let’s look at an example:
import numpy as np
import matplotlib.pyplot as plt

# Create a 2D array representing an image
image = np.random.random((10,10))

# Display the image using imshow with interpolation
plt.imshow(image, interpolation='nearest')
plt.show()
Output:
In this example, we have used the nearest interpolation method to display the image. This method does not perform any interpolation and shows the pixels as they are.
Image with Aspect Ratio
We can control the aspect ratio of the image using the aspect parameter in the imshow function. This allows us to adjust the width-to-height ratio of the image. Let’s see an example:
import numpy as np
import matplotlib.pyplot as plt

# Create a 2D array representing an image
image = np.random.random((10,5))

# Display the image with a specific aspect ratio
plt.imshow(image, aspect=2)
plt.show()
Output:
In this example, we have set the aspect ratio to 2, which means the image will be displayed with twice the width compared to the height.
Image with Annotations
We can add annotations to the image using the text function in Matplotlib. This allows us to highlight specific points or regions in the image. Let’s look at an example:
import numpy as np
import matplotlib.pyplot as plt

# Create a 2D array representing an image
image = np.random.random((10,10))

# Display the image with annotations
plt.imshow(image)

# Add text annotation at a specific point
plt.text(5, 5, 'Center', color='red', fontsize=12)
plt.show()
Output:
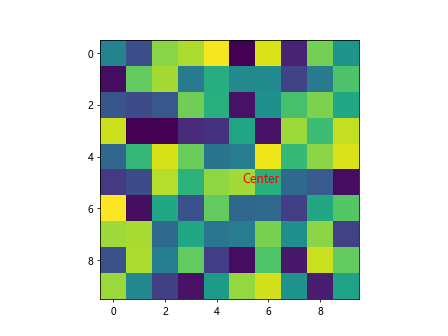
In this example, we have added a text annotation at the center of the image to highlight a specific point.
Image with Grid
We can display a grid on top of the image using the grid function in Matplotlib. This can be useful for visualizing the structure of the image. Let’s see an example:
import numpy as np
import matplotlib.pyplot as plt

# Create a 2D array representing an image
image = np.random.random((10,10))

# Display the image with a grid
plt.imshow(image)
plt.grid(True)
plt.show()
Output:
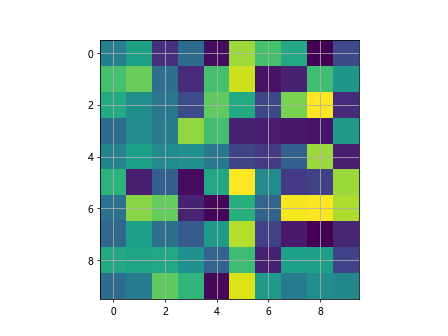
In this example, we have enabled the grid on top of the image, which helps in visualizing the pixel boundaries.
Image with Alpha Channel
We can control the transparency of the image using the alpha parameter in the imshow function. This allows us to overlay multiple images with varying levels of transparency. Let’s look at an example:
import numpy as np
import matplotlib.pyplot as plt

# Create a 2D array representing an image
image1 = np.random.random((10,10))
image2 = np.random.random((10,10))

# Display the images with alpha channel
plt.imshow(image1, alpha=0.5)
plt.imshow(image2, alpha=0.5)
plt.show()
Output:
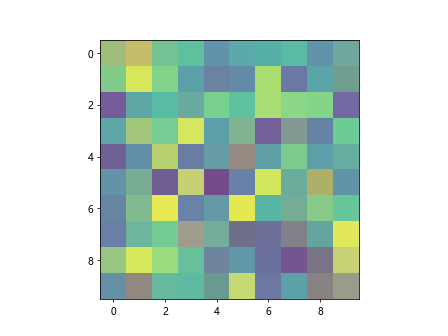
In this example, we have displayed two images with an alpha channel of 0.5 each, making them partially transparent.
Image with Colorbar
We can add a colorbar to the plot when displaying the image. The colorbar provides a visual representation of the colormap used in the image. Let’s see an example:
import numpy as np
import matplotlib.pyplot as plt

# Create a 2D array representing an image
image = np.random.random((10,10))

# Display the image with a colorbar
plt.imshow(image)
plt.colorbar()
plt.show()
Output:
In this example, we have added a colorbar to the plot, which provides a scale of colors used in the image.
Image with Custom Bounds
We can restrict the color mapping of the image to a specific range using the vmin and vmax parameters in the imshow function. This allows us to customize the color range displayed. Let’s look at an example:
import numpy as np
import matplotlib.pyplot as plt

# Create a 2D array representing an image
image = np.random.random((10,10))

# Display the image with custom bounds
plt.imshow(image, vmin=0.2, vmax=0.8)
plt.colorbar()
plt.show()
Output:
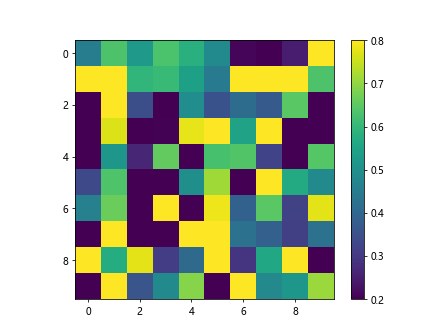
In this example, we have set custom bounds of 0.2 and 0.8 for the image, which restricts the color range to the specified values.
Image with Transposed Axes
We can transpose the axes of the image using the origin parameter in the imshow function. This allows us to change the orientation of the image. Let’s see an example:
import numpy as np
import matplotlib.pyplot as plt

# Create a 2D array representing an image
image = np.random.random((10,10))

# Display the image with transposed axes
plt.imshow(image, origin='upper')
plt.show()
Output:
In this example, we have transposed the axes of the image by setting the origin parameter to upper, which changes the orientation of the image.
Image with Zoom
We can zoom in or zoom out of the image using the extent parameter in the imshow function. This allows us to focus on specific regions of the image. Let’s look at an example:
import numpy as np
import matplotlib.pyplot as plt

# Create a 2D array representing an image
image = np.random.random((10,10))

# Display the zoomed image
plt.imshow(image, extent=[2, 7, 3, 8])
plt.show()
Output:
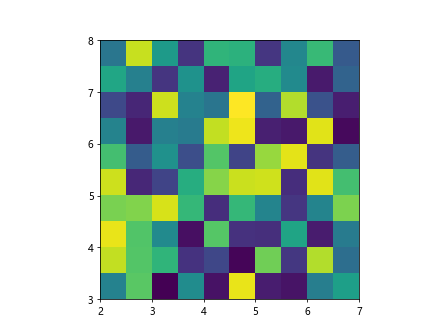
In this example, we have zoomed in on a specific region of the image by setting the extent parameter to [2, 7, 3, 8].
Image with Log Scale
We can display the image with a logarithmic scale using the norm parameter in the imshow function. This allows us to visualize the image with a logarithmic color scale. Let’s see an example:
import numpy as np
import matplotlib.pyplot as plt
import matplotlib.colors as colors

# Create a 2D array representing an image
image = np.random.random((10,10))

# Display the image with a log scale
plt.imshow(image, norm=colors.LogNorm())
plt.colorbar()
plt.show()
Output:
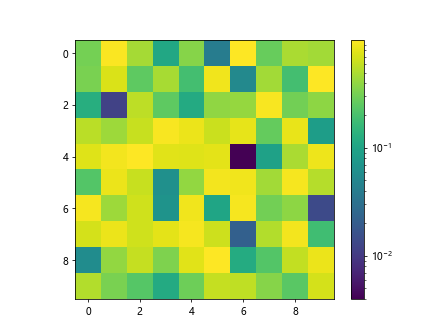
In this example, we have displayed the image with a logarithmic scale using the LogNorm normalization.
Image with Subplots
We can display multiple images in subplots using the subplot function in Matplotlib. This allows us to compare different images side by side. Let’s look at an example:
import numpy as np
import matplotlib.pyplot as plt

# Create two 2D arrays representing images
image1 = np.random.random((10,10))
image2 = np.random.random((10,10))

# Display the images in subplots
plt.subplot(1, 2, 1)
plt.imshow(image1)
plt.title('Image 1')

plt.subplot(1, 2, 2)
plt.imshow(image2)
plt.title('Image 2')

plt.show()
Output:
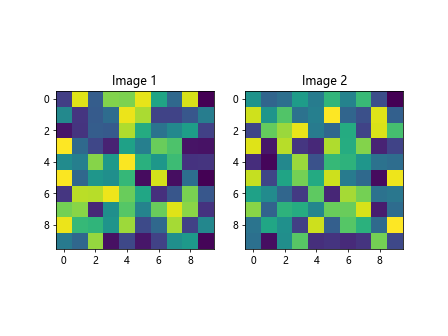
In this example, we have displayed two images side by side in subplots for comparison.
Image with Annotations using Axes Coordinates
We can add annotations to the image using axes coordinates instead of data coordinates. This allows the annotations to stay in the same position relative to the axes even when the image is zoomed or panned. Let’s see an example:
import numpy as np
import matplotlib.pyplot as plt

# Create a 2D array representing an image
image = np.random.random((10,10))

# Display the image with axes coordinates
plt.imshow(image)

# Add text annotation at a specific point using axes coordinates
plt.annotate('Center', xy=(0.5, 0.5), xycoords='axes fraction', color='red', fontsize=12)
plt.show()
Output:
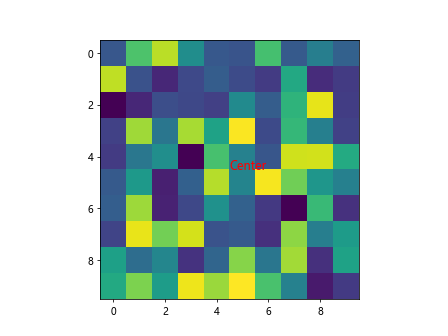
In this example, we have added a text annotation at the center of the image using axes coordinates.
Image with Masking
We can apply a mask to the image to highlight or hide specific regions. This can be useful for focusing on important areas of the image. Let’s look at an example:
import numpy as np
import matplotlib.pyplot as plt

# Create a 2D array representing an image
image = np.random.random((10,10))

# Apply a mask to the image
mask = np.zeros_like(image)
mask[2:8, 2:8] = 1

plt.imshow(np.ma.array(image, mask=~mask))
plt.show()
In this example, we have applied a mask to the image to highlight a specific region while hiding the rest.
Image with Annotations in Polar Coordinates
We can add annotations to the image using polar coordinates. This allows us to place annotations in circular plots or images. Let’s see an example:
import numpy as np
import matplotlib.pyplot as plt

# Create a 2D array representing an image
image = np.random.random((10,10))

# Display the image with polar coordinates
plt.imshow(image)

# Add text annotation at a specific point in polar coordinates
plt.annotate('Center', xy=(0, 0), xycoords='polar', color='red', fontsize=12)
plt.show()
Output:
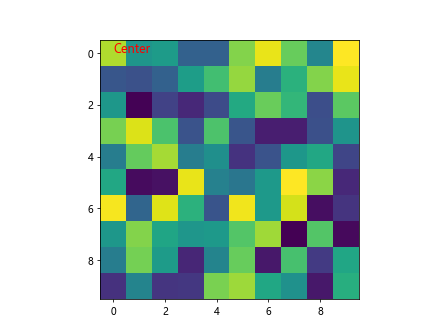
In this example, we have added a text annotation at the center of the image using polar coordinates.
These examples demonstrate various ways to use the imshow function in Matplotlib to display images with different customization options. Experiment with these examples and explore the capabilities of Matplotlib for creating compelling visualizations.
Matplotlib’s imshow function is a powerful tool for displaying images in plots, providing a wide range of customization options to visualize and analyze image data effectively.