Matplotlib Legend
Matplotlib is a popular Python library for creating static, animated, and interactive visualizations in Python. One useful feature of matplotlib is the ability to add legends to plots, which help to identify the different elements in a plot. In this article, we will explore how to create and customize legends in matplotlib with detailed examples.
Basic Usage
To add a legend to a matplotlib plot, you can use the legend function. Here is a simple example of how to add a legend to a plot:
import matplotlib.pyplot as plt

x = [1, 2, 3, 4, 5]
y1 = [2, 3, 5, 7, 11]
y2 = [1, 4, 9, 16, 25]

plt.plot(x, y1, label='Prime numbers')
plt.plot(x, y2, label='Square numbers')
plt.legend()
plt.show()
Output:
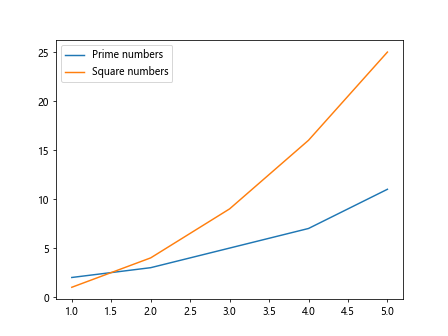
In the above code snippet, we have two sets of data, y1 representing prime numbers and y2 representing square numbers. We use the label parameter in the plot function to assign labels to each line. The legend function is then called to display the legend on the plot.
Customizing Legends
Placement and Position
By default, matplotlib places the legend at the best location in the plot to avoid overlapping with data. However, you can also specify the position of the legend using the loc parameter. Here are some common locations for the legend:
- ‘upper right’
- ‘upper left’
- ‘lower right’
- ‘lower left’
- ‘center’
- ‘best’
plt.legend(loc='upper right')
Title and Labels
You can add a title to the legend using the title parameter. You can also customize the font size and style of the legend labels using the fontsize and fontstyle parameters.
plt.legend(title='Legend Title', fontsize='large', title_fontstyle='italic')
Background Color and Border
You can change the background color of the legend using the facecolor parameter. Additionally, you can add a border to the legend using the edgecolor and linewidth parameters.
plt.legend(facecolor='lightgray', edgecolor='black', linewidth=1)
Shadow and Transparency
You can add a shadow effect to the legend using the shadow parameter. You can also adjust the transparency of the legend using the alpha parameter.
plt.legend(shadow=True, alpha=0.8)
Adding Multiple Legends
You can add multiple legends to a plot by calling the legend function multiple times with different labels.
import matplotlib.pyplot as plt
x = [1, 2, 3, 4, 5]
y1 = [2, 3, 5, 7, 11]
y2 = [1, 4, 9, 16, 25]
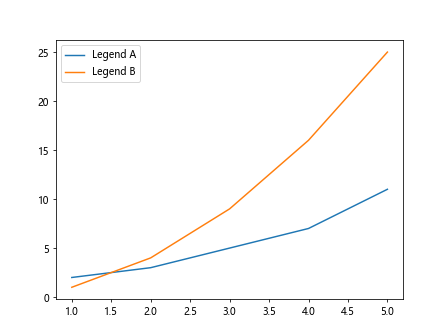
plt.plot(x, y1)
plt.plot(x, y2)
plt.legend(['Legend A', 'Legend B'])
plt.show()
Output:
Custom Legend Markers
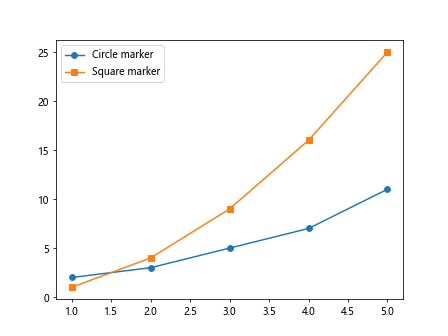
You can customize the markers used in the legend by specifying the marker parameter. Here is an example of using different markers for each legend entry:
import matplotlib.pyplot as plt

x = [1, 2, 3, 4, 5]
y1 = [2, 3, 5, 7, 11]
y2 = [1, 4, 9, 16, 25]

plt.plot(x, y1, marker='o', label='Circle marker')
plt.plot(x, y2, marker='s', label='Square marker')
plt.legend()
plt.show()
Output:
Advanced Legend Customization
Legend Title
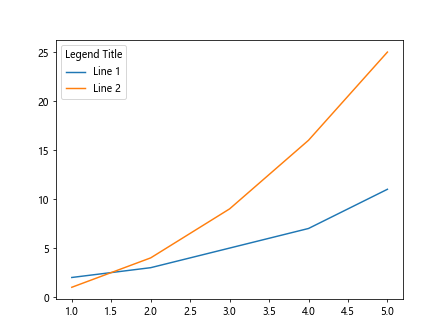
You can add a title to the legend using the title parameter. Here is an example of how to add a title to the legend:
import matplotlib.pyplot as plt
x = [1, 2, 3, 4, 5]
y1 = [2, 3, 5, 7, 11]
y2 = [1, 4, 9, 16, 25]
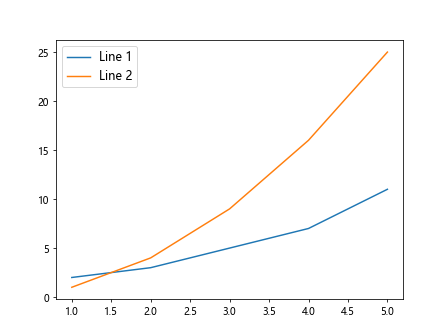
plt.plot(x, y1, label='Line 1')
plt.plot(x, y2, label='Line 2')
plt.legend(title='Legend Title')
plt.show()
Output:
Legend Font Properties
You can customize the font properties of the legend using the prop parameter. Here is an example of how to change the font size and style of the legend:
import matplotlib.pyplot as plt

x = [1, 2, 3, 4, 5]
y1 = [2, 3, 5, 7, 11]
y2 = [1, 4, 9, 16, 25]

plt.plot(x, y1, label='Line 1')
plt.plot(x, y2, label='Line 2')
plt.legend(prop={'size': 12, 'style': 'italic'})
plt.show()
Output:
Custom Legend Labels
You can customize the labels of the legend using the labels parameter. Here is an example of how to change the labels of the legend entries:
import matplotlib.pyplot as plt
x = [1, 2, 3, 4, 5]
y1 = [2, 3, 5, 7, 11]
y2 = [1, 4, 9, 16, 25]
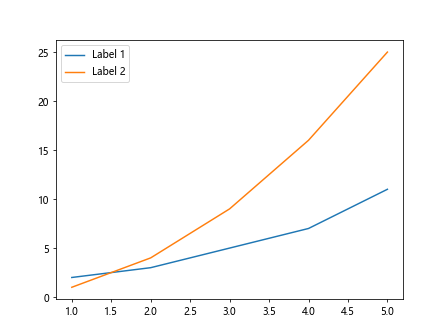
plt.plot(x, y1)
plt.plot(x, y2)
plt.legend(labels=['Label 1', 'Label 2'])
plt.show()
Output:
Legend Border Properties
You can customize the border properties of the legend using the borderpad, borderaxespad, and labelspacing parameters. Here is an example of how to adjust the border properties of the legend:
import matplotlib.pyplot as plt

x = [1, 2, 3, 4, 5]
y1 = [2, 3, 5, 7, 11]
y2 = [1, 4, 9, 16, 25]

plt.plot(x, y1)
plt.plot(x, y2)
plt.legend(borderpad=1, borderaxespad=1, labelspacing=2)
plt.show()
Legend Background Properties
You can customize the background color and transparency of the legend using the facecolor and alpha parameters. Here is an example of how to change the background color and transparency of the legend:
import matplotlib.pyplot as plt

x = [1, 2, 3, 4, 5]
y1 = [2, 3, 5, 7, 11]
y2 = [1, 4, 9, 16, 25]

plt.plot(x, y1)
plt.plot(x, y2)
plt.legend(facecolor='lightgray', alpha=0.8)
plt.show()
Legend Title Properties
You can customize the font properties of the legend title using the title_fontsize, title_fontweight, and title_color parameters. Here is an example of how to change the title properties of the legend:
import matplotlib.pyplot as plt

x = [1, 2, 3, 4, 5]
y1 = [2, 3, 5, 7, 11]
y2 = [1, 4, 9, 16, 25]

plt.plot(x, y1)
plt.plot(x, y2)
plt.legend(title='Legend Title', title_fontsize='medium', title_fontweight='bold', title_color='blue')
plt.show()
Matplotlib Legend Conclusion
In this article, we explored how to create and customize legends in matplotlib. We learned how to add basic legends, customize the placement, position, font properties, background properties, and title properties of legends. We also covered advanced techniques for customizing legends, such as adding multiple legends, customizing legend markers, and adjusting border properties. With these examples, you should now have a good understanding of how to create beautiful and informative legends in your matplotlib plots.