Annotate in Matplotlib
Matplotlib is a powerful Python library for creating visualizations. One important feature of Matplotlib is the ability to annotate plots with text, arrows, shapes, and more. In this article, we will explore different ways to annotate plots in Matplotlib.
Basic Text Annotation
The most common way to annotate plots in Matplotlib is by adding text to specific points on the plot. Let’s start with a simple example:
import matplotlib.pyplot as plt

x = [1, 2, 3, 4, 5]
y = [10, 20, 25, 30, 35]

plt.plot(x, y)
plt.annotate('Point 1', (1, 10))
plt.annotate('Point 2', (2, 20))

plt.show()
Output:
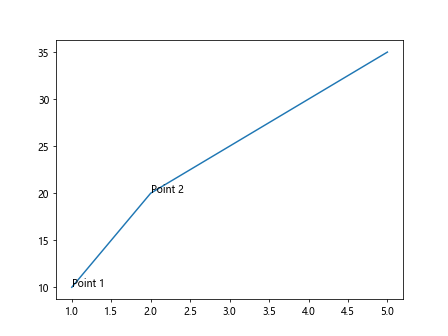
In this example, we use the annotate function to add text annotations to the points (1, 10) and (2, 20) on the plot.
Arrow Annotation
Sometimes it’s useful to use arrows to point to specific points on a plot. Matplotlib allows us to easily add arrow annotations as well. Here is an example:
import matplotlib.pyplot as plt

x = [1, 2, 3, 4, 5]
y = [10, 20, 25, 30, 35]

plt.plot(x, y)
plt.annotate('Point 1', (1, 10), xytext=(2.5, 15), arrowprops=dict(arrowstyle='->'))
plt.annotate('Point 2', (2, 20), xytext=(3.5, 25), arrowprops=dict(arrowstyle='->'))

plt.show()
Output:
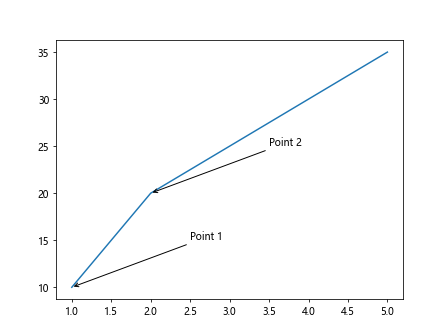
In this example, we use the arrowprops argument of the annotate function to add arrows to the text annotations.
Customizing Annotations
Matplotlib provides many options for customizing the appearance of annotations, such as the font size, color, and style. Let’s see how we can customize annotations:
import matplotlib.pyplot as plt

x = [1, 2, 3, 4, 5]
y = [10, 20, 25, 30, 35]

plt.plot(x, y)
plt.annotate('Point 1', (1, 10), fontsize=12, color='red', style='italic')
plt.annotate('Point 2', (2, 20), fontsize=14, color='blue', style='normal')

plt.show()
Output:
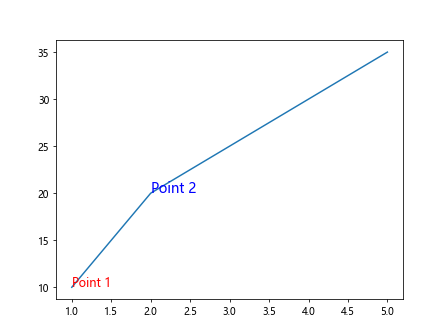
In this example, we use the fontsize, color, and style arguments of the annotate function to customize the appearance of text annotations.
Annotation with Boxes
In addition to text and arrows, Matplotlib also allows us to annotate plots with shapes such as rectangles and ellipses. Let’s see how we can add annotated boxes to a plot:
import matplotlib.pyplot as plt

x = [1, 2, 3, 4, 5]
y = [10, 20, 25, 30, 35]

plt.plot(x, y)
plt.annotate('Box 1', (1, 10), xytext=(1.5, 15), bbox=dict(boxstyle='round,pad=0.5', fc='yellow', ec='black'))
plt.annotate('Box 2', (2, 20), xytext=(2.5, 25), bbox=dict(boxstyle='round,pad=0.5', fc='green', ec='black'))

plt.show()
Output:
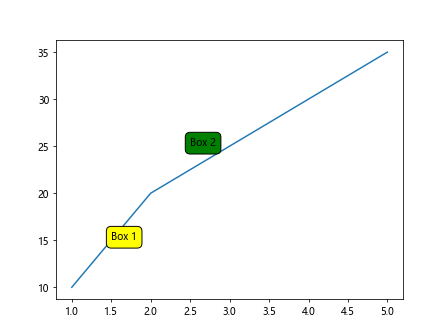
In this example, we use the bbox argument of the annotate function to add annotated boxes to the text annotations.
Annotation on Subplots
It is also possible to add annotations to individual subplots within a larger figure. Let’s create a figure with multiple subplots and add annotations to each subplot:
import matplotlib.pyplot as plt

fig, axs = plt.subplots(2, 2)

x = [1, 2, 3, 4, 5]
y1 = [10, 20, 25, 30, 35]
y2 = [5, 15, 20, 25, 30]

axs[0, 0].plot(x, y1)
axs[0, 0].annotate('Subplot 1', (1, 10))

axs[0, 1].plot(x, y2)
axs[0, 1].annotate('Subplot 2', (2, 15))

plt.show()
Output:
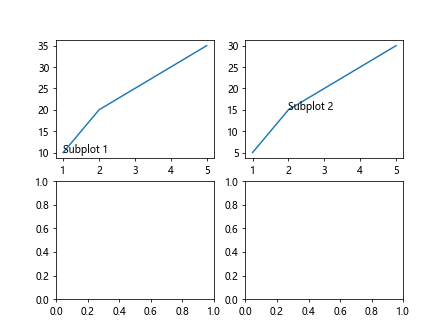
In this example, we use the annotate function on each subplot to add annotations to individual subplots within the figure.
Annotation with Annotations
Matplotlib also provides an Annotation class that can be used to create more complex annotations with custom arrows, annotations, and text. Let’s see how we can use the Annotation class to create custom annotations:
import matplotlib.pyplot as plt
from matplotlib.patches import Arrow, FancyArrowPatch

x = [1, 2, 3, 4, 5]
y = [10, 20, 25, 30, 35]

fig, ax = plt.subplots()
ax.plot(x, y)

arrow1 = Arrow(1, 10, 0.5, 5, color='red', width=0.5)
ax.add_patch(arrow1)

arrow2 = FancyArrowPatch((2, 20), (3, 25), arrowstyle='->', color='blue')
ax.add_patch(arrow2)

plt.show()
Output:
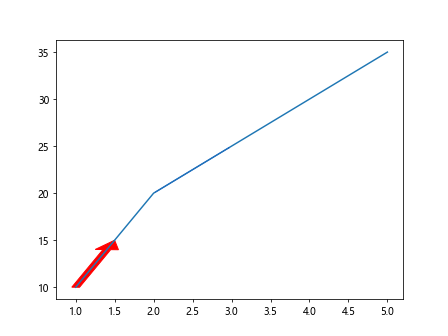
In this example, we use the Arrow and FancyArrowPatch classes to create custom arrow annotations on the plot.
Annotation with Connection
Sometimes we may want to annotate a point on a plot with a line connecting it to another point. Matplotlib provides the ConnectionPatch class for creating such annotations. Let’s see how we can use ConnectionPatch for annotations:
import matplotlib.pyplot as plt
from matplotlib.patches import ConnectionPatch

x = [1, 2, 3, 4, 5]
y = [10, 20, 25, 30, 35]

fig, ax = plt.subplots()
ax.plot(x, y)

con = ConnectionPatch(xyA=(2, 20), xyB=(4, 30), coordsA='data', coordsB='data', color='green', arrowstyle='-|>')
ax.add_artist(con)

plt.show()
Output:
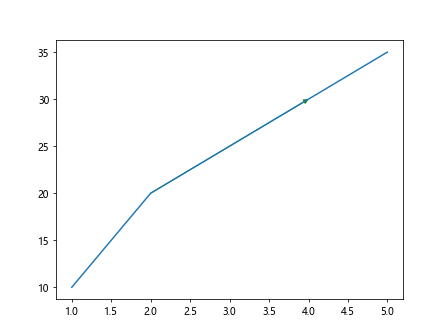
In this example, we use the ConnectionPatch class to create an annotation with a line connecting two points on the plot.
Annotations with Textbox
Another way to annotate plots in Matplotlib is by using the TextBox class to create annotations with textboxes. Let’s see how we can add annotations with textboxes to a plot:
import matplotlib.pyplot as plt
from matplotlib.offsetbox import TextArea, DrawingArea, OffsetImage, AnnotationBbox, AnchoredOffsetbox, VPacker, HPacker

x = [1, 2, 3, 4, 5]
y = [10, 20, 25, 30, 35]

fig, ax = plt.subplots()
ax.plot(x, y)

textbox1 = TextArea("Annotation 1", textprops=dict(color="red"))
offsetbox1 = AnnotationBbox(textbox1, (1, 10), frameon=True, boxcoords="data")
ax.add_artist(offsetbox1)

plt.show()
Output:
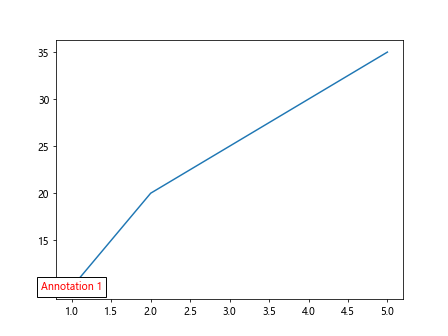
In this example, we use the TextArea and AnnotationBbox classes to create annotations with textboxes on the plot.
Annotation with Complex Arrow
Matplotlib provides a FancyArrow class that allows us to create complex arrows with custom shapes and styles. Let’s see how we can use the FancyArrow class to create annotations with complex arrows on a plot:
import matplotlib.pyplot as plt
from matplotlib.patches import FancyArrow

x = [1, 2, 3, 4, 5]
y = [10, 20, 25, 30, 35]

fig, ax = plt.subplots()
ax.plot(x, y)

arrow = FancyArrow(2, 20, 1, 5, head_width=0.5, head_length=1, fc='blue', ec='black')
ax.add_patch(arrow)

plt.show()
Output:
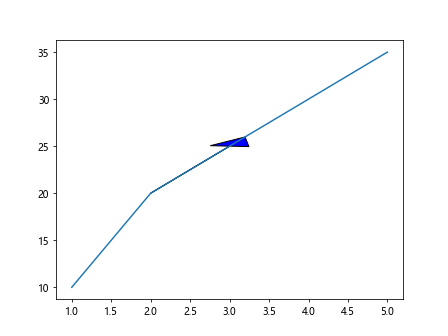
In this example, we use the FancyArrow class to create a complex arrow annotation with a custom shape and style on the plot.
Customizing Annotations with Fonts
Matplotlib allows us to customize annotations with different fonts and styles. Let’s see how we can use custom fonts and styles for annotations:
import matplotlib.pyplot as plt
from matplotlib.font_manager import FontProperties

x = [1, 2, 3, 4, 5]
y = [10, 20, 25, 30, 35]

font = FontProperties()
font.set_family('serif')
font.set_style('italic')
font.set_weight('bold')
font.set_size('large')

plt.plot(x, y)
plt.annotate('Custom Font', (1, 10), fontproperties=font)

plt.show()
Output:
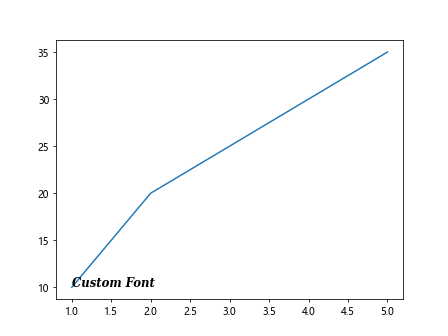
In this example, we use the FontProperties class to customize the font style, family, weight, and size of the annotation text.
Annotation with Multiple Arrows
Matplotlib also allows us to add multiple arrow annotations to a plot. Let’s see how we can add multiple arrow annotations to a plot:
import matplotlib.pyplot as plt

x = [1, 2, 3, 4, 5]
y = [10, 20, 25, 30, 35]

plt.plot(x, y)
plt.annotate('Arrow 1', (1, 10), xytext=(2, 15), arrowprops=dict(arrowstyle='->'))
plt.annotate('Arrow 2', (2, 20), xytext=(3, 25), arrowprops=dict(arrowstyle='-|>'))

plt.show()
Output:
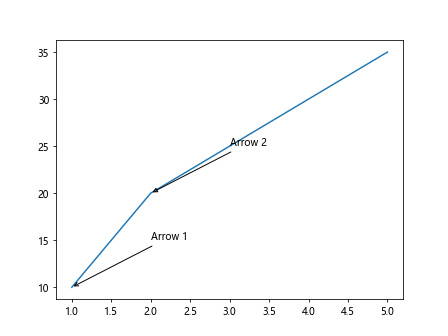
In this example, we use the annotate function to add multiple arrow annotations with different styles to the plot.
Annotation with ConnectionPatch
Another way to create annotations with connections in Matplotlib is by using the ConnectionPatch class. Let’s see how we can add annotations with ConnectionPatch:
import matplotlib.pyplot as plt
from matplotlib.patches import ConnectionPatch

x = [1, 2, 3, 4, 5]
y = [10, 20, 25, 30, 35]

fig, ax = plt.subplots()
ax.plot(x, y)

con = ConnectionPatch(xyA=(2, 20), xyB=(4, 30), coordsA='data', coordsB='data', color='green', arrowstyle='fancy')
ax.add_artist(con)

plt.show()
Output:
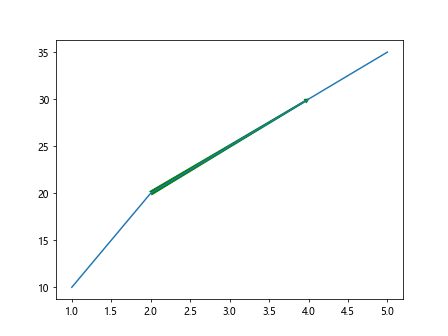
In this example, we use the ConnectionPatch class to add an annotation with a fancy arrow connection between two points on the plot.
Annotation with Textbox in Subplot
We can also add annotations with textboxes to individual subplots within a larger figure. Let’s see how we can add annotations with textboxes to subplots:
import matplotlib.pyplot as plt
from matplotlib.offsetbox import TextArea, AnnotationBbox

x = [1, 2, 3, 4, 5]
y = [10, 20, 25, 30, 35]

fig, axs = plt.subplots(2, 2)

textbox = TextArea("Annotation", textprops=dict(color="blue"))
offsetbox = AnnotationBbox(textbox, (1, 10), frameon=True, boxcoords="data")

axs[0, 0].plot(x, y)
axs[0, 0].add_artist(offsetbox)

plt.show()
Output:
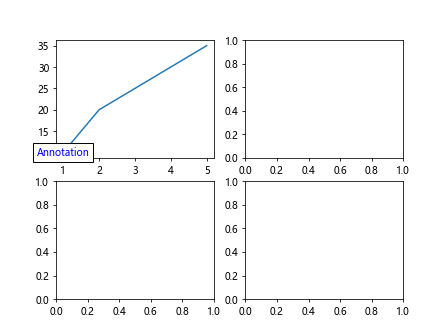
In this example, we use the TextArea and AnnotationBbox classes to create annotations with textboxes on an individual subplot within a figure.
Annotate in Matplotlib Conclusion
In this article, we have explored various ways to annotate plots in Matplotlib. We have seen how to add text annotations, arrow annotations, custom annotations with shapes and styles, annotations on subplots, annotations with connections, and annotations with textboxes. By using these annotation techniques, you can enhance the visual clarity and communication of your plots in Matplotlib. Experiment with different annotation styles and customization options to create informative and visually appealing plots in Matplotlib.