Matplotlib Font Size
Matplotlib is a popular data visualization library in Python that allows users to create high-quality plots and graphs for visual analysis. One important aspect of creating visually appealing plots is controlling the font size of the text elements in the plot. In this article, we will explore how to adjust the font size of different text elements in Matplotlib plots.
1. Setting Font Size for Title
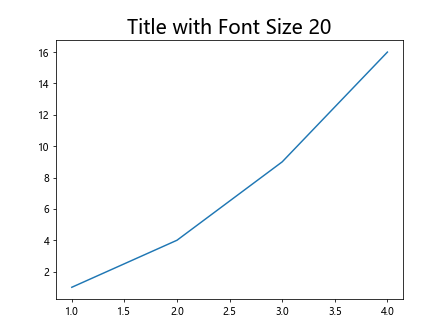
The title of a plot is an important piece of information that describes the content of the plot. We can set the font size for the title using the fontsize parameter in the title() function.
import matplotlib.pyplot as plt

plt.plot([1, 2, 3, 4], [1, 4, 9, 16])
plt.title('Title with Font Size 20', fontsize=20)
plt.show()
Output:
2. Setting Font Size for Axis Labels
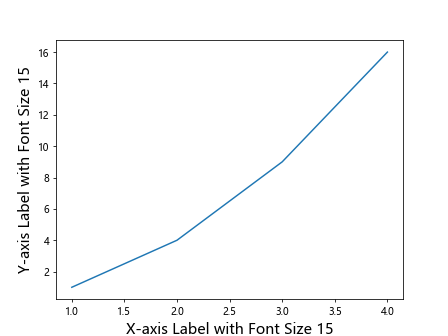
Axis labels help in understanding the relationship between the variables in a plot. We can set the font size for the axis labels using the fontsize parameter in the xlabel() and ylabel() functions.
import matplotlib.pyplot as plt

plt.plot([1, 2, 3, 4], [1, 4, 9, 16])
plt.xlabel('X-axis Label with Font Size 15', fontsize=15)
plt.ylabel('Y-axis Label with Font Size 15', fontsize=15)
plt.show()
Output:
3. Setting Font Size for Tick Labels
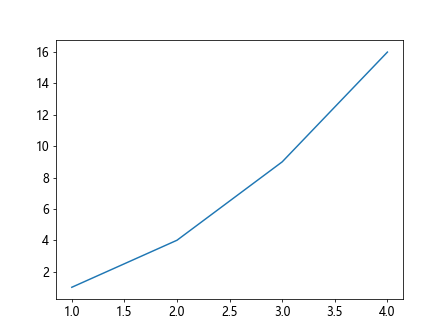
Tick labels represent the values on the axes in a plot. We can set the font size for the tick labels using the fontsize parameter in the xticks() and yticks() functions.
import matplotlib.pyplot as plt

plt.plot([1, 2, 3, 4], [1, 4, 9, 16])
plt.xticks(fontsize=12)
plt.yticks(fontsize=12)
plt.show()
Output:
4. Setting Font Size for Legend
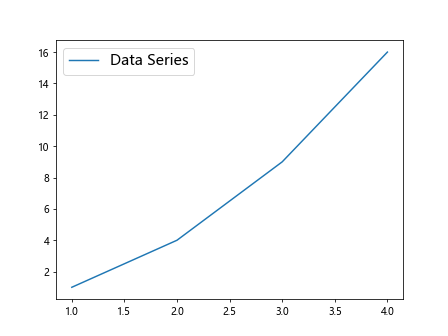
Legends help in identifying the different data series in a plot. We can set the font size for the legend using the fontsize parameter in the legend() function.
import matplotlib.pyplot as plt

plt.plot([1, 2, 3, 4], [1, 4, 9, 16], label='Data Series')
plt.legend(fontsize=15)
plt.show()
Output:
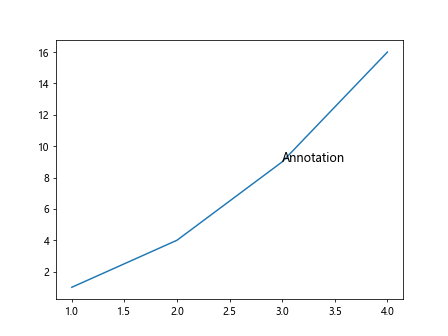
5. Setting Font Size for Text Annotations
Text annotations provide additional information on specific data points in a plot. We can set the font size for text annotations using the fontsize parameter in the annotate() function.
import matplotlib.pyplot as plt

plt.plot([1, 2, 3, 4], [1, 4, 9, 16])
plt.annotate('Annotation', (3, 9), fontsize=12)
plt.show()
Output:
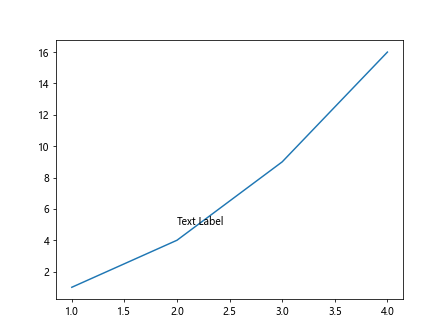
6. Setting Font Size for Text Labels
Text labels are used to provide additional information in a plot. We can set the font size for text labels using the fontsize parameter in the text() function.
import matplotlib.pyplot as plt

plt.plot([1, 2, 3, 4], [1, 4, 9, 16])
plt.text(2, 5, 'Text Label', fontsize=10)
plt.show()
Output:
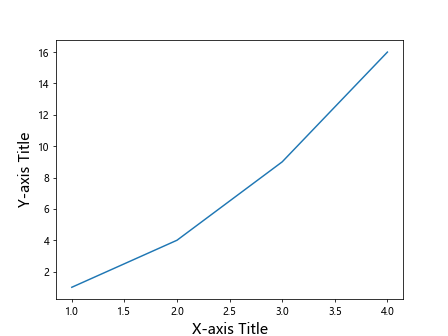
7. Setting Font Size for Axis Titles
Axis titles provide information about the variables represented on the axes. We can set the font size for the axis titles using the fontsize parameter in the set_xlabel() and set_ylabel() functions.
import matplotlib.pyplot as plt

plt.plot([1, 2, 3, 4], [1, 4, 9, 16])
plt.gca().set_xlabel('X-axis Title', fontsize=15)
plt.gca().set_ylabel('Y-axis Title', fontsize=15)
plt.show()
Output:
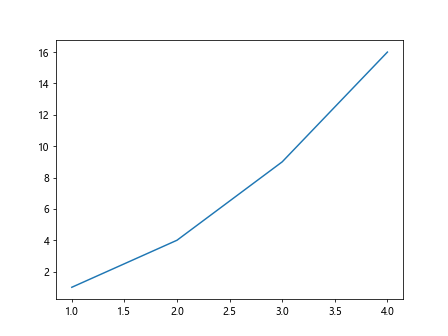
8. Setting Global Font Size for All Text Elements
We can set a global font size for all text elements in a plot by modifying the rcParams dictionary.
import matplotlib.pyplot as plt

plt.plot([1, 2, 3, 4], [1, 4, 9, 16])
plt.rcParams.update({'font.size': 14})
plt.show()
Output:
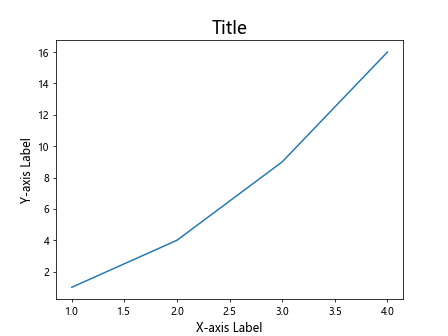
9. Setting Font Size for Specific Text Elements
If we want to set different font sizes for specific text elements in a plot, we can do so by accessing the individual text objects and setting their font sizes.
import matplotlib.pyplot as plt

plt.plot([1, 2, 3, 4], [1, 4, 9, 16])
title = plt.title('Title')
xlabel = plt.xlabel('X-axis Label')
ylabel = plt.ylabel('Y-axis Label')
title.set_fontsize(18)
xlabel.set_fontsize(12)
ylabel.set_fontsize(12)
plt.show()
Output:
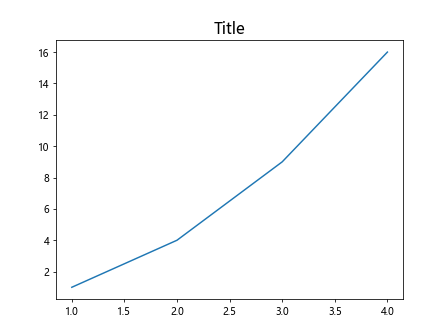
10. Setting Font Size using FontProperties
We can also set the font size using the FontProperties class to create a custom font object with the desired font size.
import matplotlib.pyplot as plt
from matplotlib.font_manager import FontProperties

plt.plot([1, 2, 3, 4], [1, 4, 9, 16])
font = FontProperties()
font.set_size(16)
plt.title('Title', fontproperties=font)
plt.show()
Output:
Matplotlib Font Size Conclusion
In this article, we have explored various ways to adjust the font size of text elements in Matplotlib plots. By setting the font size for titles, axis labels, tick labels, legends, text annotations, text labels, axis titles, and global text elements, we can create visually appealing plots with clear and readable text. Experiment with different font sizes in your plots to find the perfect balance between aesthetics and readability.