Matplotlib figsize
Matplotlib is a powerful visualization library in Python that allows users to create various types of plots and charts. One important aspect of creating visually appealing plots is to set the figure size, also known as figsize. In this article, we will explore how to set the figsize in Matplotlib and demonstrate various examples.
Setting Figsize in Matplotlib
To set the figsize in Matplotlib, you can use the plt.figure() function and specify the figsize parameter. The figsize parameter takes a tuple of two values, width and height in inches, representing the dimensions of the figure. Let’s take a look at some examples.
Example 1: Setting Figsize for a Simple Plot
import matplotlib.pyplot as plt

plt.figure(figsize=(8, 6))
plt.plot([1, 2, 3, 4], [1, 4, 9, 16])
plt.show()
Output:
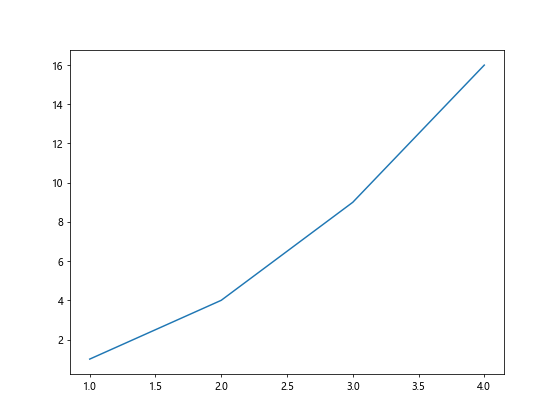
In this example, we set the figsize to (8, 6) inches. This will create a plot with a width of 8 inches and a height of 6 inches.
Example 2: Setting Different Figsize
import matplotlib.pyplot as plt

plt.figure(figsize=(10, 4))
plt.plot([1, 2, 3, 4], [1, 4, 9, 16])
plt.show()
Output:
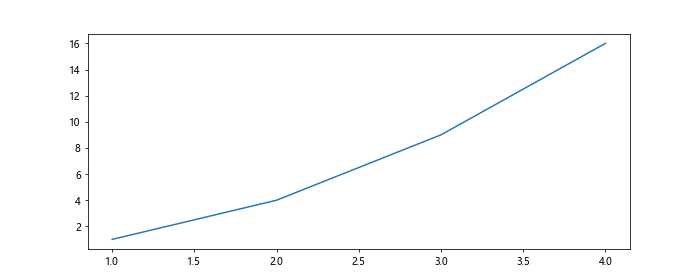
In this example, we set the figsize to (10, 4) inches. This will create a plot with a width of 10 inches and a height of 4 inches.
More Examples of Setting Figsize
Let’s explore more examples of setting figsize in Matplotlib for different types of plots.
Example 3: Bar Plot with Custom Figsize
import matplotlib.pyplot as plt

plt.figure(figsize=(12, 8))
plt.bar([1, 2, 3, 4], [10, 20, 15, 25])
plt.show()
Output:
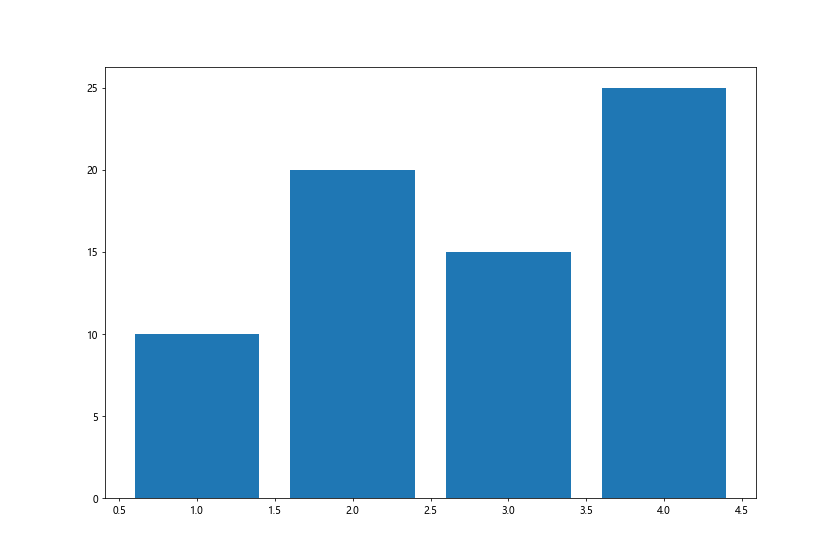
In this example, we create a bar plot with a custom figsize of (12, 8) inches. This will produce a wider and taller bar plot.
Example 4: Scatter Plot with Aspect Ratio
import matplotlib.pyplot as plt

plt.figure(figsize=(6, 12))
plt.scatter([1, 2, 3, 4], [1, 4, 9, 16])
plt.show()
Output:
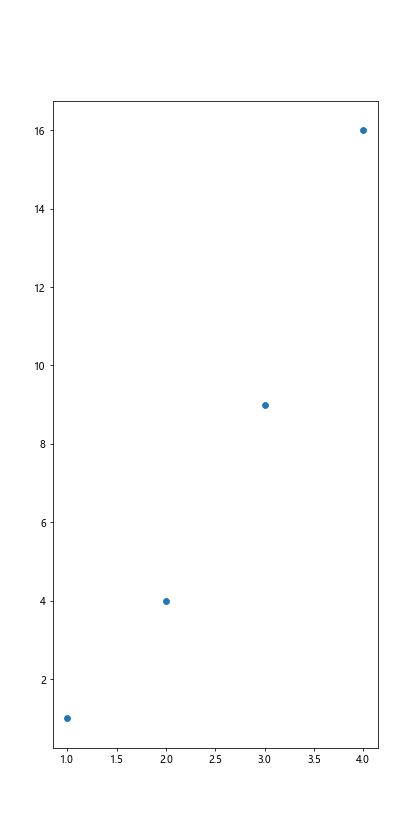
In this example, we create a scatter plot with a custom figsize of (6, 12) inches. This will produce a plot with a different aspect ratio.
Example 5: Subplots with Different Figsize
import matplotlib.pyplot as plt

fig, axs = plt.subplots(2, 1, figsize=(8, 10))
axs[0].plot([1, 2, 3, 4], [1, 4, 9, 16])
axs[1].plot([1, 2, 3, 4], [1, 8, 27, 64])
plt.show()
Output:
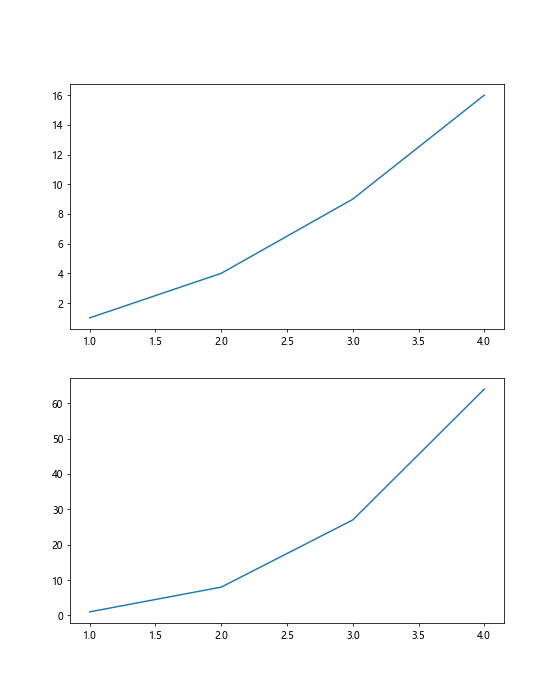
In this example, we create subplots with different figsize for each subplot. The overall figure size is (8, 10) inches, with two subplots arranged vertically.
Using Aspect Ratio in Figsize
Sometimes it might be necessary to set a specific aspect ratio for the plot. You can achieve this by setting different width and height values in the figsize tuple. Let’s explore examples of using aspect ratio in figsize.
Example 6: Aspect Ratio 16:9
import matplotlib.pyplot as plt

plt.figure(figsize=(12, 6.75))
plt.plot([1, 2, 3, 4], [1, 4, 9, 16])
plt.show()
Output:
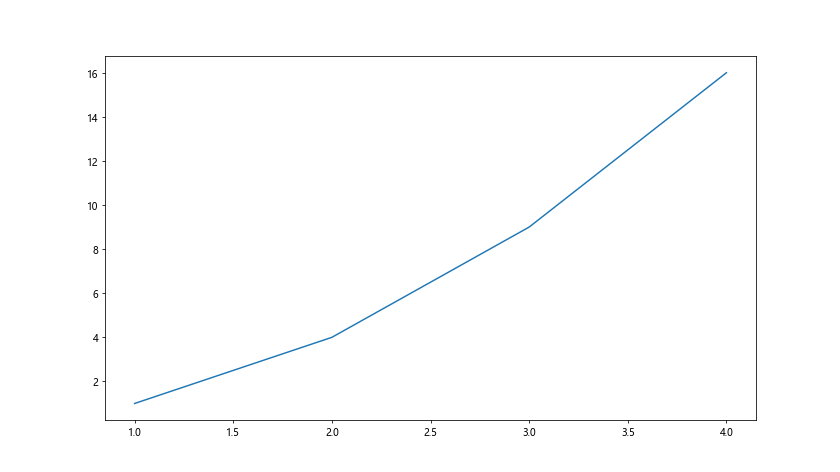
In this example, we set the width to 12 inches and calculate the height using the aspect ratio of 16:9. This will create a plot with a 16:9 aspect ratio.
Example 7: Aspect Ratio 4:3
import matplotlib.pyplot as plt

plt.figure(figsize=(12, 9))
plt.plot([1, 2, 3, 4], [1, 4, 9, 16])
plt.show()
Output:
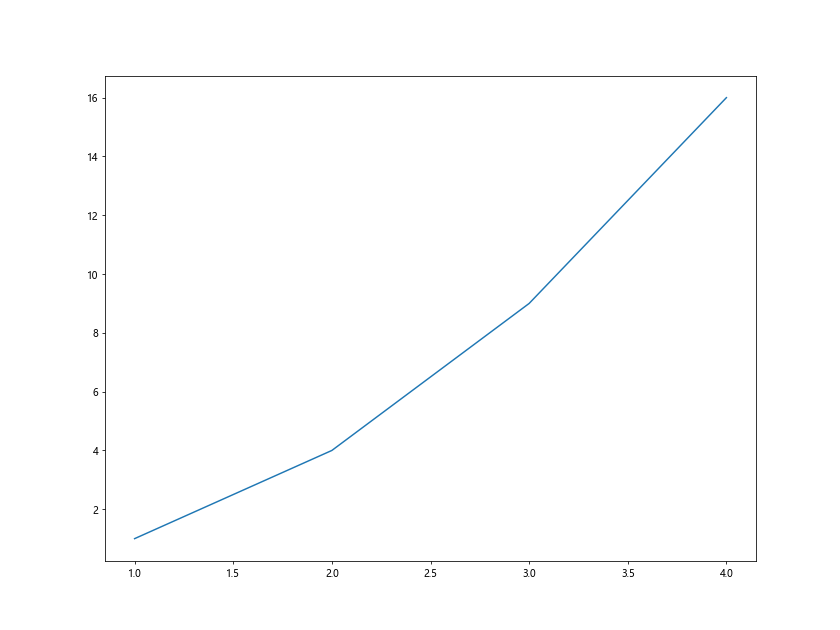
In this example, we set the width to 12 inches and the height to 9 inches, maintaining a 4:3 aspect ratio for the plot.
Using figsize in Different Types of Plots
Figsize can be used in various types of plots to customize the size and aspect ratio of the plots. Let’s explore more examples using figsize in different types of plots.
Example 8: Histogram with Custom Figsize
import matplotlib.pyplot as plt

plt.figure(figsize=(8, 8))
plt.hist([1, 1, 2, 2, 2, 3, 3, 3, 3, 4, 4, 4, 4, 4])
plt.show()
Output:
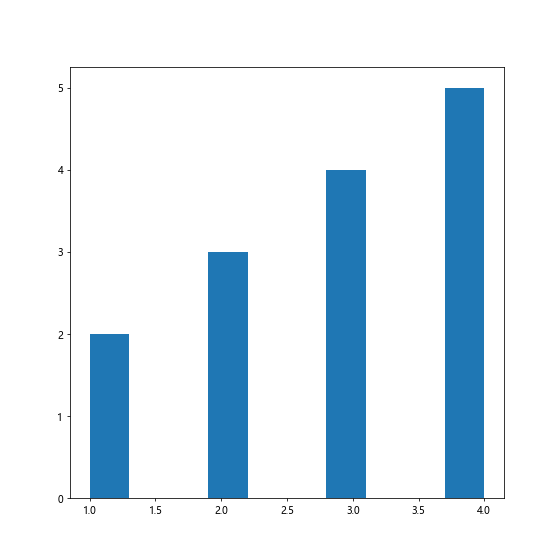
In this example, we create a histogram with a custom figsize of (8, 8) inches. This will produce a square-shaped histogram.
Example 9: Pie Chart with Aspect Ratio
import matplotlib.pyplot as plt

plt.figure(figsize=(6, 9))
sizes = [20, 30, 25, 25]
labels = ['A', 'B', 'C', 'D']
plt.pie(sizes, labels=labels, autopct='%1.1f%%')
plt.axis('equal')
plt.show()
Output:
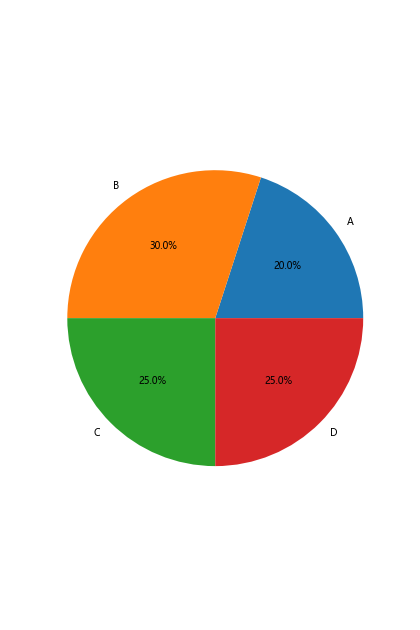
In this example, we create a pie chart with a custom figsize of (6, 9) inches. This will produce a plot with a specific aspect ratio.
Example 10: Boxplot with Different Figsize
import matplotlib.pyplot as plt

plt.figure(figsize=(10, 6))
plt.boxplot([[1, 2, 3, 4], [5, 6, 7, 8], [9, 10, 11, 12]])
plt.show()
Output:
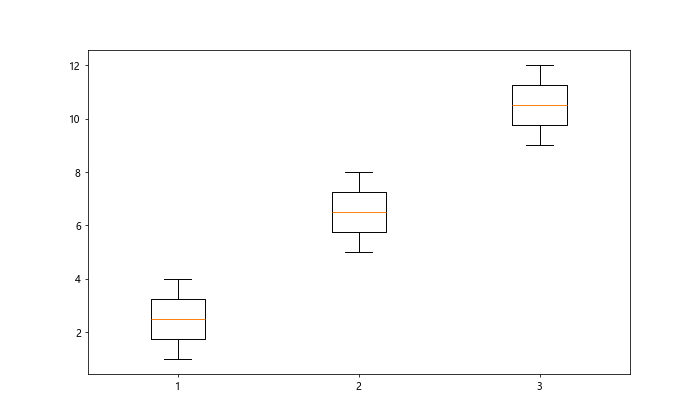
In this example, we create a boxplot with a custom figsize of (10, 6) inches. This will produce a wider and shorter boxplot.
Matplotlib figsize Conclusion
In this article, we have explored how to set the figsize in Matplotlib to customize the size and aspect ratio of plots. By using the plt.figure() function with the figsize parameter, you can create visually appealing plots with different dimensions. Experiment with different figsize values to create plots that best fit your visualization needs.