matplotlib figure
Matplotlib is a powerful visualization library in Python that allows users to create a wide range of graphs and plots. One of the key components of Matplotlib is the figure object, which represents the entire figure or window where plots are drawn. In this article, we will explore the various functionalities of the figure object in Matplotlib, including creating and customizing figures, adding subplots, and saving figures to files.
Creating a Figure
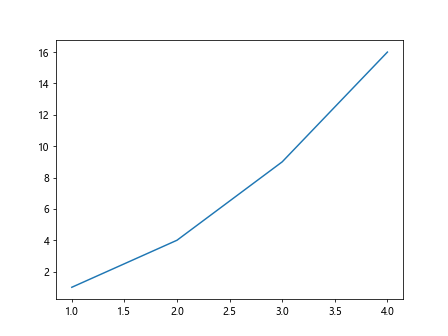
To create a basic figure in Matplotlib, you can use the plt.figure() function. Here is an example code snippet that demonstrates how to create a simple figure with a line plot.
import matplotlib.pyplot as plt

# Create a figure
fig = plt.figure()
plt.plot([1, 2, 3, 4], [1, 4, 9, 16])
plt.show()
Output:

In this code snippet, we create a figure using plt.figure() and then plot a simple line plot using the plot() function. The plt.show() function displays the figure on the screen.
Customizing a Figure
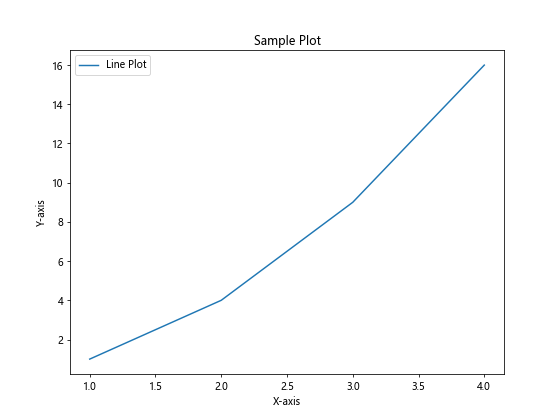
You can customize the appearance of a figure by setting various properties such as figure size, title, axis labels, and legends. Here is an example code snippet that demonstrates how to customize a figure.
import matplotlib.pyplot as plt

# Create a figure
fig = plt.figure(figsize=(8, 6))

# Plot a line
plt.plot([1, 2, 3, 4], [1, 4, 9, 16])

# Set title and axis labels
plt.title('Sample Plot')
plt.xlabel('X-axis')
plt.ylabel('Y-axis')

# Add a legend
plt.legend(['Line Plot'])

plt.show()
Output:

In this code snippet, we set the figure size using the figsize parameter of plt.figure(), and customize the plot by setting the title, axis labels, and legend.
Adding Subplots
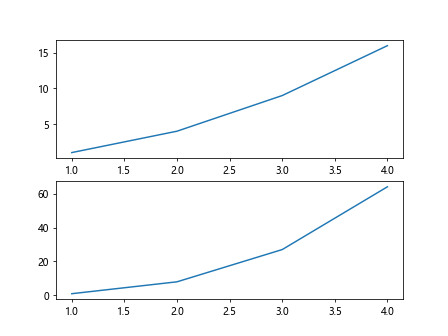
Subplots allow you to create multiple plots within the same figure. You can use the add_subplot() function to add subplots to a figure. Here is an example code snippet that demonstrates how to create a figure with multiple subplots.
import matplotlib.pyplot as plt

# Create a figure with two subplots
fig = plt.figure()

# Add the first subplot
ax1 = fig.add_subplot(2, 1, 1)
ax1.plot([1, 2, 3, 4], [1, 4, 9, 16])

# Add the second subplot
ax2 = fig.add_subplot(2, 1, 2)
ax2.plot([1, 2, 3, 4], [1, 8, 27, 64])

plt.show()
Output:

In this code snippet, we create a figure with two subplots using the add_subplot() function. Each subplot is plotted using the plot() function.
Saving a Figure
You can save a figure to a file in various formats such as PNG, PDF, or SVG using the savefig() function. Here is an example code snippet that demonstrates how to save a figure to a PNG file.
import matplotlib.pyplot as plt

# Create a figure
fig = plt.figure()
plt.plot([1, 2, 3, 4], [1, 4, 9, 16])

# Save the figure to a PNG file
fig.savefig('sample_plot.png')
In this code snippet, we create a figure and plot a line, then save the figure to a PNG file using the savefig() function.
Overall, the figure object in Matplotlib provides a flexible and powerful way to create and customize plots in Python. By understanding how to create and manipulate figures, you can create visually appealing and informative plots for your data analysis and visualization projects.