How to Use Multiple Columns in a Matplotlib Legend
Use multiple columns in a Matplotlib legend to create more organized and visually appealing plots. This article will explore various techniques and best practices for implementing multi-column legends in Matplotlib. We’ll cover everything from basic usage to advanced customization options, providing you with the knowledge and tools to effectively use multiple columns in a Matplotlib legend.
Introduction to Matplotlib Legends
Before diving into the specifics of using multiple columns in a Matplotlib legend, let’s briefly review what legends are and why they’re important in data visualization.
Legends in Matplotlib serve as a key to interpreting the various elements in a plot. They provide a visual reference that associates plot elements (like lines, markers, or colors) with their corresponding data series or categories. By default, Matplotlib creates single-column legends, but in many cases, using multiple columns can significantly improve the layout and readability of your plots.
Here’s a simple example of a plot with a single-column legend:
import matplotlib.pyplot as plt
import numpy as np

x = np.linspace(0, 10, 100)
plt.plot(x, np.sin(x), label='Sin')
plt.plot(x, np.cos(x), label='Cos')
plt.plot(x, np.tan(x), label='Tan')
plt.title('Trigonometric Functions - how2matplotlib.com')
plt.legend()
plt.show()
Output:
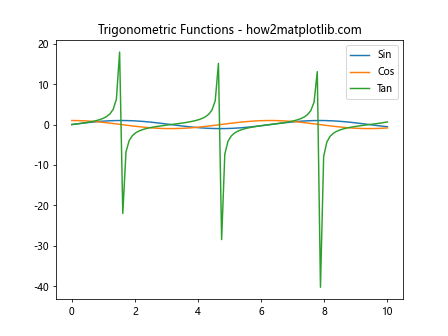
In this example, we’ve created a basic plot with three trigonometric functions and a single-column legend. Now, let’s explore how to use multiple columns in a Matplotlib legend to enhance our plots.
Basic Usage of Multiple Columns in a Matplotlib Legend
To use multiple columns in a Matplotlib legend, we can utilize the ncol parameter in the legend() function. This parameter allows us to specify the number of columns we want in our legend.
Here’s an example demonstrating how to create a two-column legend:
import matplotlib.pyplot as plt
import numpy as np

x = np.linspace(0, 10, 100)
plt.plot(x, np.sin(x), label='Sin')
plt.plot(x, np.cos(x), label='Cos')
plt.plot(x, np.tan(x), label='Tan')
plt.plot(x, np.sinh(x), label='Sinh')
plt.plot(x, np.cosh(x), label='Cosh')
plt.plot(x, np.tanh(x), label='Tanh')
plt.title('Trigonometric and Hyperbolic Functions - how2matplotlib.com')
plt.legend(ncol=2)
plt.show()
Output:
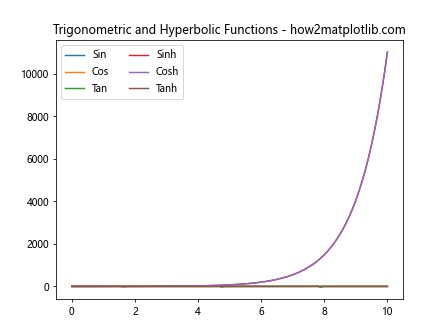
In this example, we’ve added three more functions to our plot and set ncol=2 in the legend() function. This creates a two-column legend, making it more compact and easier to read.
Adjusting Legend Position with Multiple Columns
When using multiple columns in a Matplotlib legend, you may need to adjust its position to ensure it doesn’t overlap with your plot data. Matplotlib provides several ways to control legend placement.
Using the loc Parameter
The loc parameter allows you to specify predefined positions for your legend. Here’s an example using a three-column legend positioned in the upper right corner:
import matplotlib.pyplot as plt
import numpy as np

x = np.linspace(0, 10, 100)
functions = [np.sin, np.cos, np.tan, np.sinh, np.cosh, np.tanh, np.exp, np.log, np.sqrt]

for func in functions:
    plt.plot(x, func(x), label=func.__name__)

plt.title('Various Mathematical Functions - how2matplotlib.com')
plt.legend(ncol=3, loc='upper right')
plt.show()
Output:
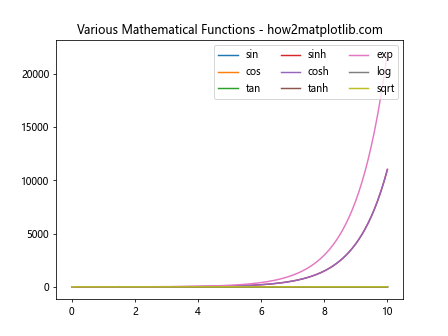
In this example, we’ve plotted nine different mathematical functions and created a three-column legend positioned in the upper right corner of the plot.
Using the bbox_to_anchor Parameter
For more precise control over legend placement, you can use the bbox_to_anchor parameter. This allows you to specify the exact coordinates where you want your legend to be anchored.
Here’s an example placing a four-column legend below the plot:
import matplotlib.pyplot as plt
import numpy as np

x = np.linspace(0, 10, 100)
functions = [np.sin, np.cos, np.tan, np.sinh, np.cosh, np.tanh, np.exp, np.log, np.sqrt, np.arcsin, np.arccos, np.arctan]

for func in functions:
    plt.plot(x, func(x), label=func.__name__)

plt.title('Extended Set of Mathematical Functions - how2matplotlib.com')
plt.legend(ncol=4, bbox_to_anchor=(0.5, -0.15), loc='upper center')
plt.tight_layout()
plt.show()
Output:
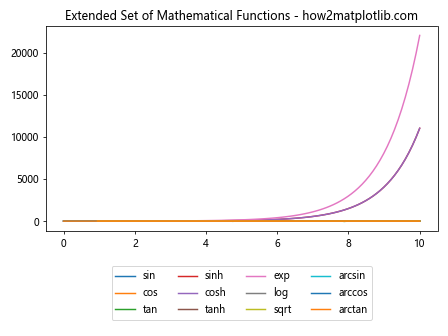
In this example, we’ve placed a four-column legend below the plot by setting bbox_to_anchor=(0.5, -0.15) and loc='upper center'. The tight_layout() function is used to adjust the plot layout and prevent the legend from being cut off.
Customizing Legend Appearance with Multiple Columns
When using multiple columns in a Matplotlib legend, you may want to customize its appearance to better suit your plot’s style or to emphasize certain information.
Adjusting Column Spacing
You can control the spacing between legend columns using the columnspacing parameter. Here’s an example:
import matplotlib.pyplot as plt
import numpy as np

x = np.linspace(0, 10, 100)
functions = [np.sin, np.cos, np.tan, np.sinh, np.cosh, np.tanh]

for func in functions:
    plt.plot(x, func(x), label=func.__name__)

plt.title('Trigonometric and Hyperbolic Functions - how2matplotlib.com')
plt.legend(ncol=3, columnspacing=1.5)
plt.show()
Output:
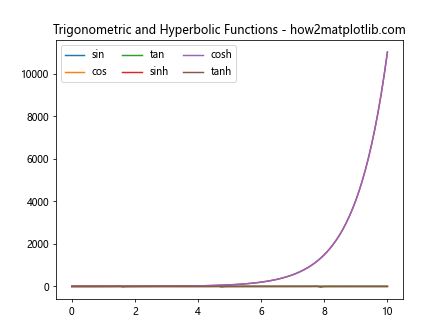
In this example, we’ve set columnspacing=1.5 to increase the space between legend columns.
Changing Legend Font Size
To adjust the font size of your legend labels when using multiple columns, you can use the fontsize parameter:
import matplotlib.pyplot as plt
import numpy as np

x = np.linspace(0, 10, 100)
functions = [np.sin, np.cos, np.tan, np.sinh, np.cosh, np.tanh, np.exp, np.log]

for func in functions:
    plt.plot(x, func(x), label=func.__name__)

plt.title('Various Mathematical Functions - how2matplotlib.com')
plt.legend(ncol=4, fontsize='small')
plt.show()
Output:
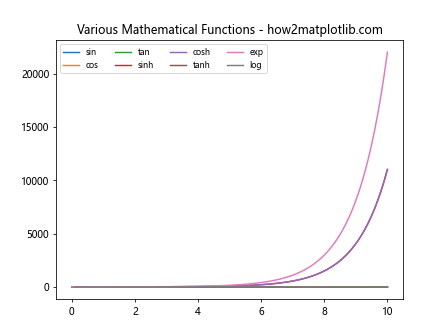
In this example, we’ve set fontsize='small' to reduce the size of the legend labels, making them fit better in a four-column layout.
Handling Long Labels in Multi-Column Legends
When using multiple columns in a Matplotlib legend, you may encounter situations where some labels are significantly longer than others. This can lead to uneven column widths and potentially overlapping text.
Using Line Breaks
One way to handle long labels is to introduce line breaks. Here’s an example:
import matplotlib.pyplot as plt
import numpy as np

x = np.linspace(0, 10, 100)
plt.plot(x, np.sin(x), label='Sine\nFunction')
plt.plot(x, np.cos(x), label='Cosine\nFunction')
plt.plot(x, np.tan(x), label='Tangent\nFunction')
plt.plot(x, x**2, label='Quadratic\nFunction')
plt.plot(x, x**3, label='Cubic\nFunction')
plt.plot(x, np.exp(x), label='Exponential\nFunction')

plt.title('Various Mathematical Functions - how2matplotlib.com')
plt.legend(ncol=3)
plt.show()
Output:
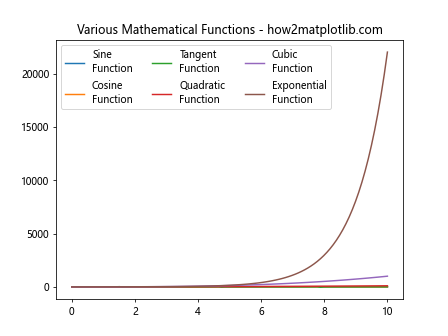
In this example, we’ve added line breaks to our labels using the \n character, creating a more compact and readable multi-column legend.
Adjusting Label Wrapping
Matplotlib also provides a way to automatically wrap long labels using the labelspacing parameter. Here’s an example:
import matplotlib.pyplot as plt
import numpy as np

x = np.linspace(0, 10, 100)
plt.plot(x, np.sin(x), label='Sine Function (Trigonometric)')
plt.plot(x, np.cos(x), label='Cosine Function (Trigonometric)')
plt.plot(x, np.tan(x), label='Tangent Function (Trigonometric)')
plt.plot(x, x**2, label='Quadratic Function (Polynomial)')
plt.plot(x, x**3, label='Cubic Function (Polynomial)')
plt.plot(x, np.exp(x), label='Exponential Function (Transcendental)')

plt.title('Various Mathematical Functions - how2matplotlib.com')
plt.legend(ncol=2, labelspacing=1.2)
plt.show()
Output:
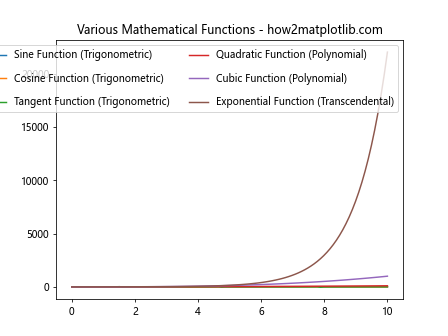
In this example, we’ve increased the labelspacing to allow more room for wrapped labels in our two-column legend.
Creating Legends with Multiple Columns for Subplots
When working with subplots in Matplotlib, you might want to create a single legend with multiple columns that applies to all subplots. Here’s how you can achieve this:
import matplotlib.pyplot as plt
import numpy as np

fig, (ax1, ax2) = plt.subplots(2, 1, figsize=(10, 8))

x = np.linspace(0, 10, 100)
functions = [np.sin, np.cos, np.tan, np.sinh, np.cosh, np.tanh]

for func in functions[:3]:
    ax1.plot(x, func(x), label=func.__name__)

for func in functions[3:]:
    ax2.plot(x, func(x), label=func.__name__)

ax1.set_title('Trigonometric Functions - how2matplotlib.com')
ax2.set_title('Hyperbolic Functions - how2matplotlib.com')

handles, labels = [], []
for ax in fig.axes:
    for h, l in zip(*ax.get_legend_handles_labels()):
        handles.append(h)
        labels.append(l)

fig.legend(handles, labels, ncol=3, loc='lower center', bbox_to_anchor=(0.5, -0.05))
plt.tight_layout()
plt.show()
Output:
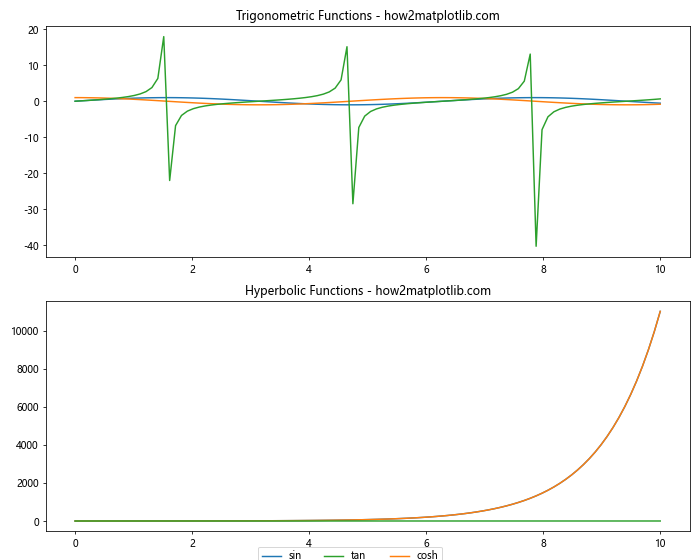
In this example, we’ve created two subplots and a single three-column legend that applies to both. We’ve collected the handles and labels from both subplots and used them to create a combined legend for the entire figure.
Using Multiple Columns in a Matplotlib Legend with Different Plot Types
Matplotlib allows you to create plots with various types of data representations, such as line plots, scatter plots, and bar plots. You can use multiple columns in a Matplotlib legend to effectively label these different plot types within the same figure.
Here’s an example that combines line plots, scatter plots, and a bar plot:
import matplotlib.pyplot as plt
import numpy as np

x = np.linspace(0, 10, 20)
y1 = np.sin(x)
y2 = np.cos(x)
y3 = np.random.rand(20)
y4 = np.random.randint(1, 10, 5)

plt.plot(x, y1, label='Sine Wave')
plt.plot(x, y2, label='Cosine Wave')
plt.scatter(x, y3, label='Random Points')
plt.bar(range(5), y4, label='Bar Data')

plt.title('Mixed Plot Types - how2matplotlib.com')
plt.legend(ncol=2)
plt.show()
Output:
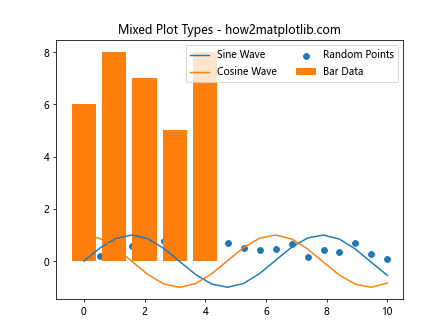
In this example, we’ve created a plot that includes two line plots, a scatter plot, and a bar plot. The two-column legend effectively labels all these different plot types.
Customizing Legend Markers in Multi-Column Legends
When using multiple columns in a Matplotlib legend, you might want to customize the appearance of the legend markers to make them more distinctive or to match your plot’s style.
Here’s an example that demonstrates how to customize legend markers:
import matplotlib.pyplot as plt
import numpy as np

x = np.linspace(0, 10, 100)

plt.plot(x, np.sin(x), 'r-', label='Sine')
plt.plot(x, np.cos(x), 'b--', label='Cosine')
plt.plot(x, np.tan(x), 'g:', label='Tangent')
plt.scatter(x[::10], np.sinh(x[::10]), c='m', marker='s', label='Sinh')
plt.scatter(x[::10], np.cosh(x[::10]), c='c', marker='^', label='Cosh')
plt.scatter(x[::10], np.tanh(x[::10]), c='y', marker='o', label='Tanh')

plt.title('Customized Legend Markers - how2matplotlib.com')
plt.legend(ncol=3, markerscale=1.5, markerfirst=False)
plt.show()
Output:
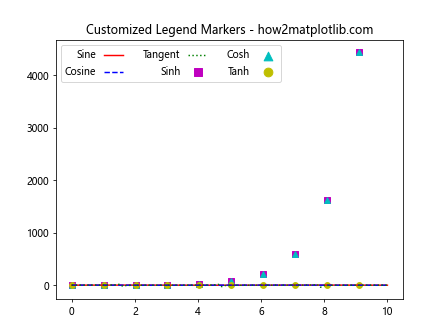
In this example, we’ve used different line styles and markers for each plot element. We’ve also used the markerscale parameter to increase the size of the markers in the legend, and markerfirst=False to place the labels before the markers.
Creating a Multi-Column Legend for a Stacked Area Plot
Stacked area plots are useful for showing how multiple data series contribute to a total over time. When creating a stacked area plot with many categories, using multiple columns in the Matplotlib legend can help keep the plot tidy and informative.
Here’s an example of a stacked area plot with a multi-column legend:
import matplotlib.pyplot as plt
import numpy as np

categories = ['Category A', 'Category B', 'Category C', 'Category D', 'Category E', 'Category F']
data = np.random.rand(6, 10)
x = range(10)

fig, ax = plt.subplots(figsize=(10, 6))
ax.stackplot(x, data, labels=categories)

ax.set_title('Stacked Area Plot with Multi-Column Legend - how2matplotlib.com')
ax.legend(ncol=3, loc='upper center', bbox_to_anchor=(0.5, -0.05))
plt.tight_layout()
plt.show()
Output:
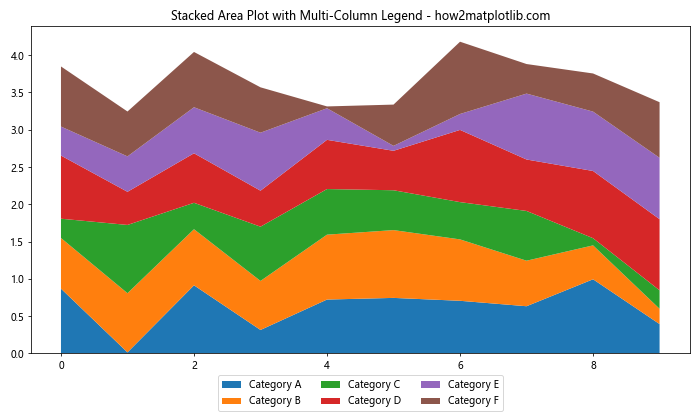
In this example, we’ve created a stacked area plot with six categories and used a three-column legend positioned below the plot for better readability.
Using Multiple Columns in a Matplotlib Legend for Grouped Bar Charts
Grouped bar charts are excellent for comparing values across different categories and groups. When you have many groups or categories, using multiple columns in your Matplotlib legend can help organize the information more effectively.
Here’s an example of a grouped bar chart with a multi-column legend:
import matplotlib.pyplot as plt
import numpy as np

categories = ['Category 1', 'Category 2', 'Category 3', 'Category 4']
groups = ['Group A', 'Group B', 'Group C']

data = np.random.randint(1, 10, size=(len(categories), len(groups)))

x = np.arange(len(categories))
width = 0.25

fig, ax = plt.subplots(figsize=(12, 6))

for i, group in enumerate(groups):
    ax.bar(x + i*width, data[:, i], width, label=group)

ax.set_xticks(x + width)
ax.set_xticklabels(categories)
ax.set_title('Grouped Bar Chart with Multi-Column Legend - how2matplotlib.com')
ax.legend(ncol=3, loc='upper center', bbox_to_anchor=(0.5, -0.05))

plt.tight_layout()
plt.show()
Output:
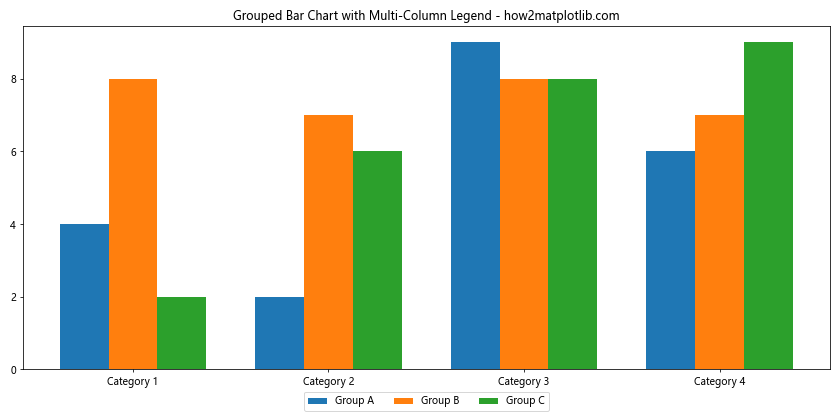
In this example, we’ve created a grouped bar chart with four categories and three groups. The three-column legend is positioned below the plot for better visibility.
Implementing a Multi-Column Legend for a Pie Chart
Pie charts are useful for showing the composition of a whole, but when you have many categories, the legend can become cluttered. Using multiple columns in aMatplotlib legend can help organize the information more effectively.
Here’s an example of a pie chart with a multi-column legend:
import matplotlib.pyplot as plt

categories = ['Category A', 'Category B', 'Category C', 'Category D', 'Category E', 'Category F', 'Category G', 'Category H']
sizes = [15, 12, 10, 8, 7, 6, 5, 37]
colors = plt.cm.Set3(np.linspace(0, 1, len(categories)))

fig, ax = plt.subplots(figsize=(10, 8))
ax.pie(sizes, colors=colors, autopct='%1.1f%%', startangle=90)
ax.axis('equal')

ax.set_title('Pie Chart with Multi-Column Legend - how2matplotlib.com')
ax.legend(categories, ncol=4, loc='upper center', bbox_to_anchor=(0.5, -0.05))

plt.tight_layout()
plt.show()
In this example, we’ve created a pie chart with eight categories and used a four-column legend positioned below the chart for better readability.
Creating a Multi-Column Legend for a Heatmap
Heatmaps are excellent for visualizing matrix data, but they often require a color bar legend to interpret the values. You can combine a color bar with a multi-column legend to provide additional information about the data.
Here’s an example of a heatmap with both a color bar and a multi-column legend:
import matplotlib.pyplot as plt
import numpy as np

data = np.random.rand(10, 10)
categories = ['Cat A', 'Cat B', 'Cat C', 'Cat D', 'Cat E']

fig, ax = plt.subplots(figsize=(10, 8))
im = ax.imshow(data, cmap='viridis')

cbar = ax.figure.colorbar(im, ax=ax)
cbar.ax.set_ylabel('Value', rotation=-90, va="bottom")

for i in range(5):
    ax.plot([], [], label=f'{categories[i]}: {np.mean(data[i*2:(i+1)*2]):.2f}')

ax.set_title('Heatmap with Multi-Column Legend - how2matplotlib.com')
ax.legend(ncol=3, loc='upper center', bbox_to_anchor=(0.5, -0.05))

plt.tight_layout()
plt.show()
Output:

In this example, we’ve created a heatmap with a color bar and added a three-column legend below the plot to provide additional information about category averages.
Implementing a Multi-Column Legend for a 3D Plot
When working with 3D plots in Matplotlib, you can still use multiple columns in your legend to organize information effectively. Here’s an example of a 3D scatter plot with a multi-column legend:
import matplotlib.pyplot as plt
from mpl_toolkits.mplot3d import Axes3D
import numpy as np

fig = plt.figure(figsize=(10, 8))
ax = fig.add_subplot(111, projection='3d')

n = 100
for c, m, zlow, zhigh in [('r', 'o', -50, -25), ('b', '^', -30, -5), ('g', 's', -20, 15), ('y', 'p', 0, 25), ('m', '*', 10, 40), ('c', 'D', 20, 50)]:
    xs = np.random.rand(n)
    ys = np.random.rand(n)
    zs = np.random.randint(zlow, zhigh, n)
    ax.scatter(xs, ys, zs, c=c, marker=m, label=f'Group {c}')

ax.set_xlabel('X Label')
ax.set_ylabel('Y Label')
ax.set_zlabel('Z Label')
ax.set_title('3D Scatter Plot with Multi-Column Legend - how2matplotlib.com')

ax.legend(ncol=3, loc='upper center', bbox_to_anchor=(0.5, -0.05))
plt.tight_layout()
plt.show()
Output:
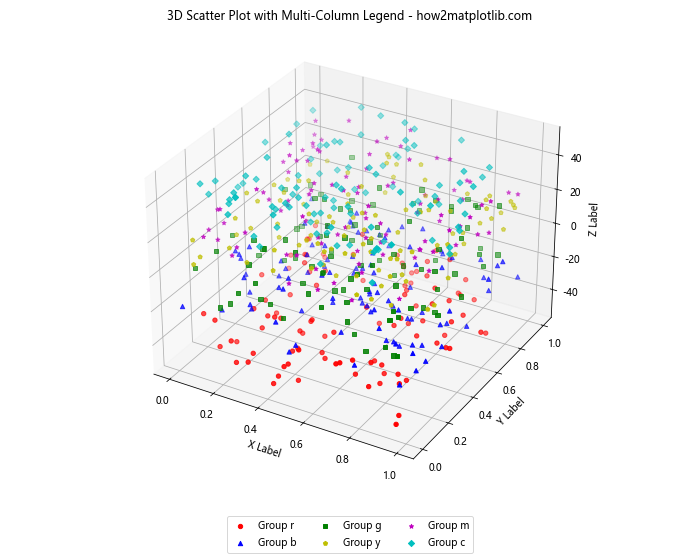
In this example, we’ve created a 3D scatter plot with six different groups and used a three-column legend positioned below the plot for better organization.
Using Multiple Columns in a Matplotlib Legend for Time Series Data
When working with time series data, especially when comparing multiple series, using multiple columns in your Matplotlib legend can help keep your plot organized and easy to read.
Here’s an example of a time series plot with a multi-column legend:
import matplotlib.pyplot as plt
import pandas as pd
import numpy as np

# Create sample time series data
dates = pd.date_range(start='2023-01-01', end='2023-12-31', freq='D')
series = ['Series A', 'Series B', 'Series C', 'Series D', 'Series E', 'Series F']
data = {series: np.random.randn(len(dates)).cumsum() for series in series}
df = pd.DataFrame(data, index=dates)

# Plot the data
fig, ax = plt.subplots(figsize=(12, 6))
df.plot(ax=ax)

ax.set_title('Time Series Plot with Multi-Column Legend - how2matplotlib.com')
ax.legend(ncol=3, loc='upper center', bbox_to_anchor=(0.5, -0.05))

plt.tight_layout()
plt.show()
Output:
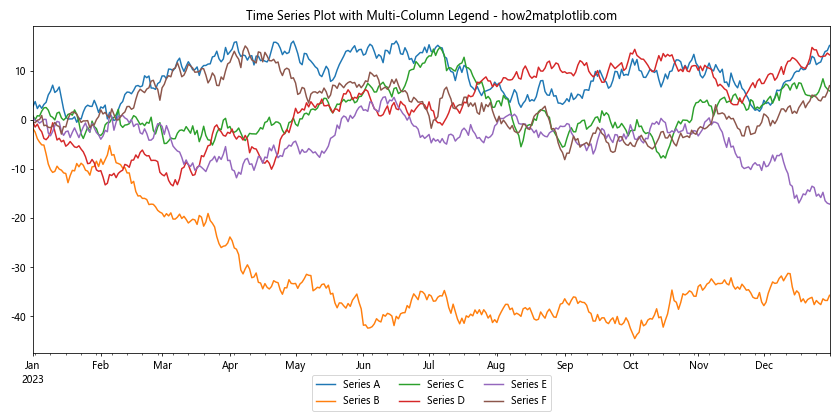
In this example, we’ve created a time series plot with six different series and used a three-column legend positioned below the plot for better organization.
Conclusion
Using multiple columns in a Matplotlib legend is a powerful technique for improving the readability and organization of your plots. Throughout this article, we’ve explored various ways to implement and customize multi-column legends in different types of plots.
We’ve covered:
- Basic usage of multiple columns in Matplotlib legends
- Adjusting legend position and appearance
- Handling long labels and different plot types
- Customizing legend markers
- Implementing multi-column legends for various plot types, including subplots, stacked area plots, grouped bar charts, pie charts, heatmaps, 3D plots, and time series data
By mastering these techniques, you can create more professional and informative visualizations that effectively communicate your data insights. Remember to experiment with different column numbers, positions, and customization options to find the best layout for your specific plot and data.