Comprehensive Guide to Matplotlib.pyplot.xscale() Function in Python
Matplotlib.pyplot.xscale() function in Python is a powerful tool for customizing the scale of the x-axis in your plots. This function allows you to transform the x-axis scale to better represent your data, whether it’s linear, logarithmic, symlog, or logit. In this comprehensive guide, we’ll explore the Matplotlib.pyplot.xscale() function in depth, covering its syntax, parameters, and various use cases with practical examples.
Understanding the Basics of Matplotlib.pyplot.xscale()
The Matplotlib.pyplot.xscale() function is part of the pyplot module in Matplotlib, a popular plotting library for Python. This function is specifically designed to set the scaling of the x-axis. By default, Matplotlib uses a linear scale for both x and y axes, but there are scenarios where other scales might be more appropriate for visualizing your data.
Let’s start with a basic example to illustrate how to use the Matplotlib.pyplot.xscale() function:
import matplotlib.pyplot as plt
import numpy as np

x = np.linspace(1, 100, 100)
y = x**2

plt.plot(x, y, label='how2matplotlib.com')
plt.xscale('log')
plt.xlabel('X-axis (log scale)')
plt.ylabel('Y-axis')
plt.title('Using Matplotlib.pyplot.xscale() for Logarithmic X-axis')
plt.legend()
plt.show()
Output:

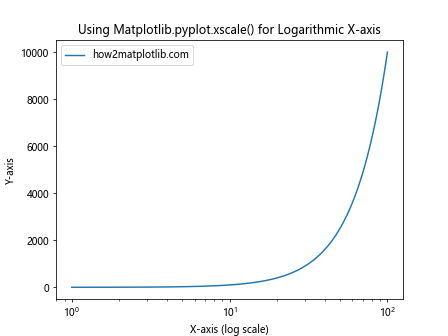
In this example, we’re plotting a quadratic function (y = x^2) and using Matplotlib.pyplot.xscale() to set the x-axis to a logarithmic scale. This is particularly useful when dealing with data that spans several orders of magnitude.
Exploring the Parameters of Matplotlib.pyplot.xscale()
The Matplotlib.pyplot.xscale() function has several parameters that allow you to customize the scaling behavior. Let’s examine each of these parameters:
- scale: This is the primary parameter that determines the type of scaling to apply to the x-axis. The available options are:
- ‘linear’: The default linear scaling.
- ‘log’: Logarithmic scaling.
- ‘symlog’: Symmetric log scaling.
- ‘logit’: Logit scaling.
- basex: This parameter is used with ‘log’ and ‘symlog’ scales to specify the base of the logarithm. The default is 10.
nonposx: This parameter determines how to handle non-positive values when using a logarithmic scale. Options include ‘mask’ (default) and ‘clip’.
subsx: This parameter allows you to specify the location of minor ticks on a logarithmic scale.
linthreshx: Used with ‘symlog’ scale to specify the range within which the plot is linear.
linscalex: Used with ‘symlog’ scale to specify the relative scaling for the linear portion of the plot.
Let’s look at an example that demonstrates the use of some of these parameters: