Comprehensive Guide to Matplotlib.pyplot.suptitle() Function in Python
Matplotlib.pyplot.suptitle() function in Python is a powerful tool for adding super titles to your plots. This function is an essential part of the Matplotlib library, which is widely used for creating static, animated, and interactive visualizations in Python. The suptitle() function specifically allows you to add an overarching title to a figure, which can contain multiple subplots. In this comprehensive guide, we’ll explore the Matplotlib.pyplot.suptitle() function in depth, covering its syntax, parameters, and various use cases.
Understanding the Basics of Matplotlib.pyplot.suptitle()
The Matplotlib.pyplot.suptitle() function is used to add a centered title to the figure. This title appears above all subplots in the figure. It’s particularly useful when you have multiple subplots and want to provide an overall description or title for the entire figure.
Let’s start with a basic example to illustrate how to use the suptitle() function:
import matplotlib.pyplot as plt
import numpy as np

# Create a figure with two subplots
fig, (ax1, ax2) = plt.subplots(1, 2, figsize=(10, 4))

# Plot some data
x = np.linspace(0, 10, 100)
ax1.plot(x, np.sin(x))
ax2.plot(x, np.cos(x))

# Add titles to subplots
ax1.set_title('Sine Wave')
ax2.set_title('Cosine Wave')

# Add a super title
plt.suptitle('Trigonometric Functions - how2matplotlib.com', fontsize=16)

plt.show()
Output:
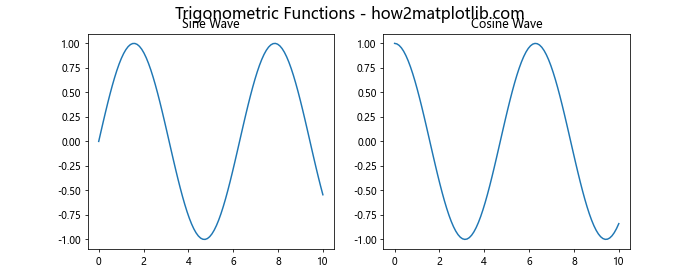
In this example, we create a figure with two subplots, plot sine and cosine waves, and then use plt.suptitle() to add an overarching title to the entire figure. The fontsize parameter is used to set the size of the super title.
Exploring the Parameters of Matplotlib.pyplot.suptitle()
The Matplotlib.pyplot.suptitle() function comes with several parameters that allow you to customize the appearance and position of the super title. Let’s explore these parameters in detail:
- t (str): This is the text of the super title.
- x (float): The x location of the text in figure coordinates (0 to 1).
- y (float): The y location of the text in figure coordinates (0 to 1).
- ha (str): Horizontal alignment (‘center’, ‘left’, ‘right’).
- va (str): Vertical alignment (‘top’, ‘center’, ‘bottom’, ‘baseline’).
- fontsize (int or float): Size of the font.
- fontweight (str or int): Weight of the font (‘normal’, ‘bold’, etc.).
- color (str): Color of the text.
Let’s see an example that demonstrates the use of these parameters:
import matplotlib.pyplot as plt
import numpy as np

fig, ax = plt.subplots(figsize=(8, 6))

x = np.linspace(0, 10, 100)
ax.plot(x, np.sin(x))

plt.suptitle('Sine Wave - how2matplotlib.com',
             x=0.5, y=0.95,
             ha='center', va='top',
             fontsize=18, fontweight='bold',
             color='navy')

plt.show()
Output:
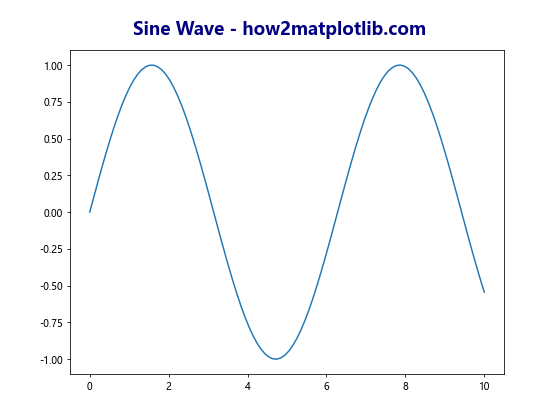
In this example, we’ve used several parameters of the suptitle() function to customize the appearance and position of the super title. The title is positioned at the top center of the figure, with a bold navy font.
Using Matplotlib.pyplot.suptitle() with Multiple Subplots
One of the most common use cases for the suptitle() function is when working with multiple subplots. Let’s see how we can use it effectively in such scenarios:
import matplotlib.pyplot as plt
import numpy as np

fig, axs = plt.subplots(2, 2, figsize=(10, 8))

x = np.linspace(0, 10, 100)

axs[0, 0].plot(x, np.sin(x))
axs[0, 0].set_title('Sine')

axs[0, 1].plot(x, np.cos(x))
axs[0, 1].set_title('Cosine')

axs[1, 0].plot(x, np.tan(x))
axs[1, 0].set_title('Tangent')

axs[1, 1].plot(x, np.exp(x))
axs[1, 1].set_title('Exponential')

plt.suptitle('Mathematical Functions - how2matplotlib.com', fontsize=16)

plt.tight_layout()
plt.show()
Output:
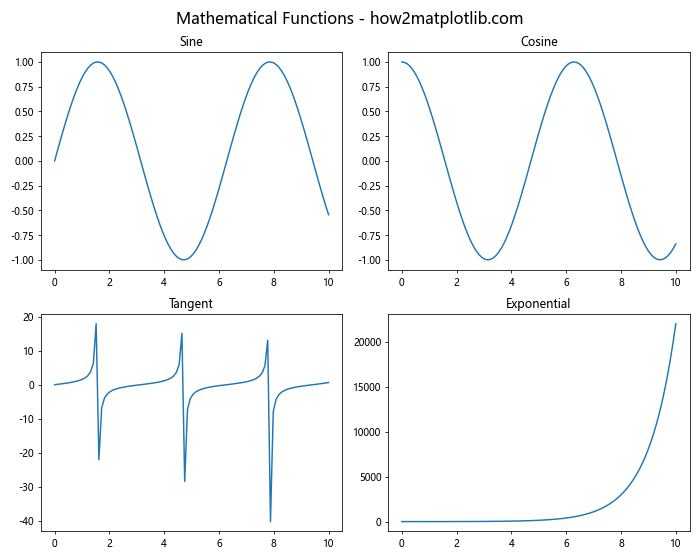
In this example, we create a 2×2 grid of subplots, each displaying a different mathematical function. The suptitle() function is used to add an overarching title that describes all the subplots. The tight_layout() function is used to adjust the spacing between subplots and prevent overlap with the super title.
Adjusting the Position of the Super Title
Sometimes, you might need to adjust the position of the super title to better fit your figure layout. The x and y parameters of the suptitle() function allow you to do this:
import matplotlib.pyplot as plt
import numpy as np

fig, axs = plt.subplots(2, 1, figsize=(8, 10))

x = np.linspace(0, 10, 100)

axs[0].plot(x, np.sin(x))
axs[0].set_title('Sine Wave')

axs[1].plot(x, np.cos(x))
axs[1].set_title('Cosine Wave')

plt.suptitle('Trigonometric Functions - how2matplotlib.com',
             x=0.5, y=0.98,
             fontsize=16)

plt.tight_layout()
plt.show()
Output:
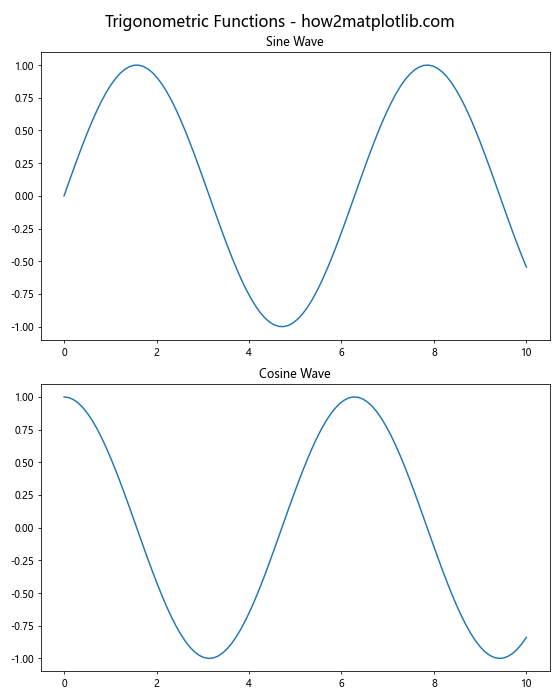
In this example, we’ve adjusted the y-coordinate of the super title to 0.98, which moves it slightly higher in the figure. This can be useful when you need to fine-tune the position of the title to avoid overlap with other elements.
Combining Matplotlib.pyplot.suptitle() with Figure Titles
While suptitle() adds a title to the entire figure, you can also use the fig.suptitle() method to achieve the same result. This can be particularly useful when you want to combine a super title with individual figure titles:
import matplotlib.pyplot as plt
import numpy as np

fig, axs = plt.subplots(2, 2, figsize=(10, 8))

x = np.linspace(0, 10, 100)

axs[0, 0].plot(x, np.sin(x))
axs[0, 0].set_title('Sine')

axs[0, 1].plot(x, np.cos(x))
axs[0, 1].set_title('Cosine')

axs[1, 0].plot(x, np.tan(x))
axs[1, 0].set_title('Tangent')

axs[1, 1].plot(x, np.exp(x))
axs[1, 1].set_title('Exponential')

fig.suptitle('Mathematical Functions - how2matplotlib.com', fontsize=16)
fig.text(0.5, 0.04, 'x-axis', ha='center')
fig.text(0.04, 0.5, 'y-axis', va='center', rotation='vertical')

plt.tight_layout()
plt.show()
Output:
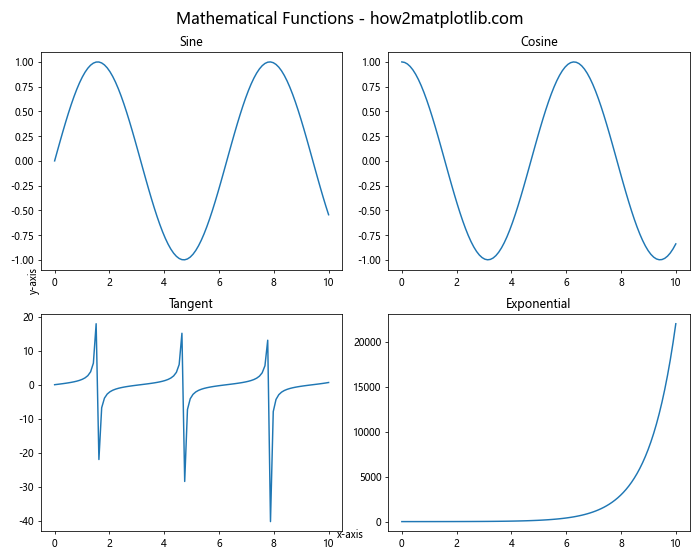
In this example, we use fig.suptitle() to add the super title, and fig.text() to add labels to the x and y axes of the entire figure. This combination allows for a more comprehensive labeling of your plots.
Customizing the Font of the Super Title
The Matplotlib.pyplot.suptitle() function allows for extensive customization of the font used in the super title. Let’s explore some of these options:
import matplotlib.pyplot as plt
import numpy as np

fig, ax = plt.subplots(figsize=(8, 6))

x = np.linspace(0, 10, 100)
ax.plot(x, np.sin(x))

plt.suptitle('Sine Wave - how2matplotlib.com',
             fontsize=18,
             fontweight='bold',
             fontfamily='serif',
             fontstyle='italic',
             color='darkred')

plt.show()
Output:
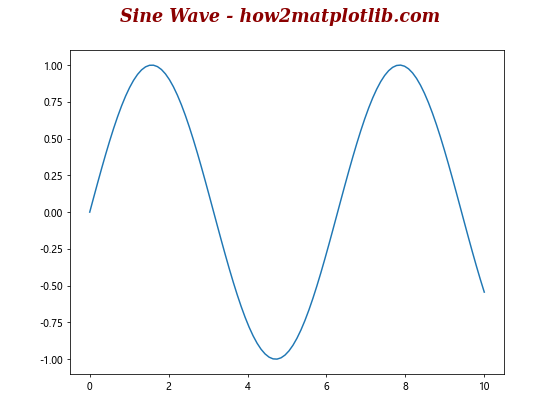
In this example, we’ve customized the font of the super title by setting its size, weight, family, style, and color. This level of customization allows you to create super titles that perfectly match the style of your plots.
Using Matplotlib.pyplot.suptitle() with Subplots of Different Sizes
When working with subplots of different sizes, the positioning of the super title can become tricky. Here’s how you can handle such situations:
import matplotlib.pyplot as plt
import numpy as np

fig = plt.figure(figsize=(12, 8))

gs = fig.add_gridspec(2, 2)

ax1 = fig.add_subplot(gs[0, 0])
ax2 = fig.add_subplot(gs[0, 1])
ax3 = fig.add_subplot(gs[1, :])

x = np.linspace(0, 10, 100)

ax1.plot(x, np.sin(x))
ax1.set_title('Sine')

ax2.plot(x, np.cos(x))
ax2.set_title('Cosine')

ax3.plot(x, np.tan(x))
ax3.set_title('Tangent')

plt.suptitle('Trigonometric Functions - how2matplotlib.com',
             fontsize=16, y=0.95)

plt.tight_layout()
plt.show()
Output:
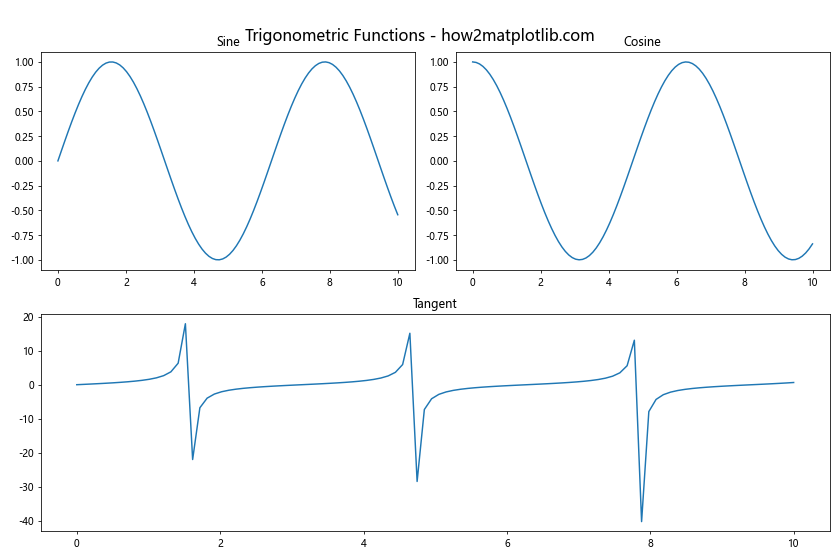
In this example, we create a figure with subplots of different sizes using gridspec. The super title is positioned slightly higher (y=0.95) to avoid overlap with the subplots.
Adding Multiple Lines to the Super Title
Sometimes, you might want to add multiple lines to your super title. While the suptitle() function doesn’t directly support this, you can achieve this effect using multiple calls to the text() function:
import matplotlib.pyplot as plt
import numpy as np

fig, ax = plt.subplots(figsize=(8, 6))

x = np.linspace(0, 10, 100)
ax.plot(x, np.sin(x))

fig.text(0.5, 0.95, 'Sine Wave', ha='center', va='bottom', fontsize=16)
fig.text(0.5, 0.91, 'how2matplotlib.com', ha='center', va='top', fontsize=12, style='italic')

plt.show()
Output:
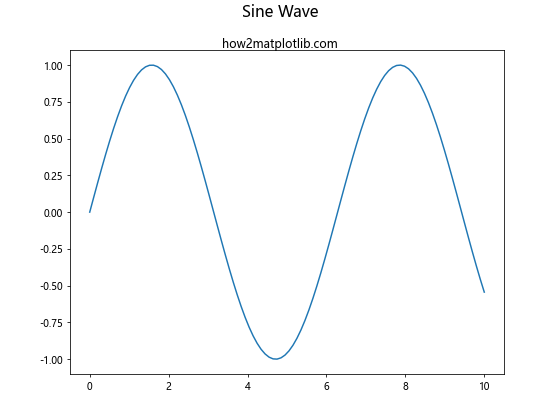
In this example, we use two separate text() calls to create a two-line super title. The first line is the main title, while the second line acts as a subtitle.
Using Matplotlib.pyplot.suptitle() with Time Series Data
When working with time series data, you might want to include date information in your super title. Here’s how you can do that:
import matplotlib.pyplot as plt
import numpy as np
from datetime import datetime, timedelta

fig, ax = plt.subplots(figsize=(10, 6))

start_date = datetime(2023, 1, 1)
dates = [start_date + timedelta(days=i) for i in range(100)]
values = np.cumsum(np.random.randn(100))

ax.plot(dates, values)
ax.set_title('Daily Random Walk')

current_date = datetime.now().strftime('%Y-%m-%d')
plt.suptitle(f'Stock Price Simulation - how2matplotlib.com\nGenerated on {current_date}',
             fontsize=14)

plt.tight_layout()
plt.show()
Output:
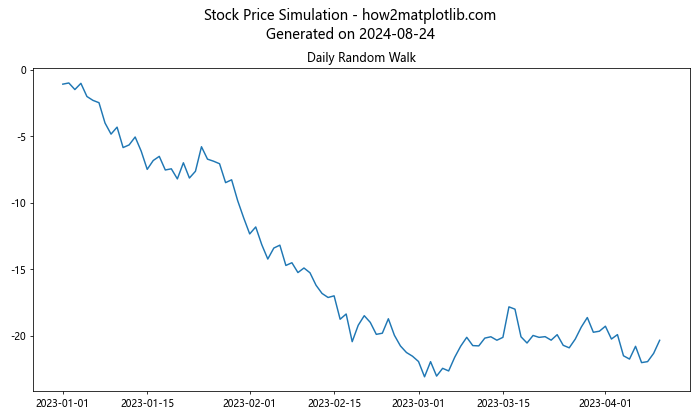
In this example, we create a simple time series plot and include the current date in the super title. This can be useful for reports or dashboards where you want to show when the plot was generated.
Animating the Super Title
For dynamic visualizations, you might want to animate the super title. While suptitle() itself doesn’t support animation, you can achieve this effect by updating the title in an animation loop:
import matplotlib.pyplot as plt
import numpy as np
from matplotlib.animation import FuncAnimation

fig, ax = plt.subplots(figsize=(8, 6))

x = np.linspace(0, 2 * np.pi, 100)
line, = ax.plot(x, np.sin(x))

title = fig.suptitle('', fontsize=16)

def update(frame):
    line.set_ydata(np.sin(x + frame / 10))
    title.set_text(f'Sine Wave - Frame {frame} - how2matplotlib.com')
    return line, title

ani = FuncAnimation(fig, update, frames=100, blit=True)

plt.show()
Output:
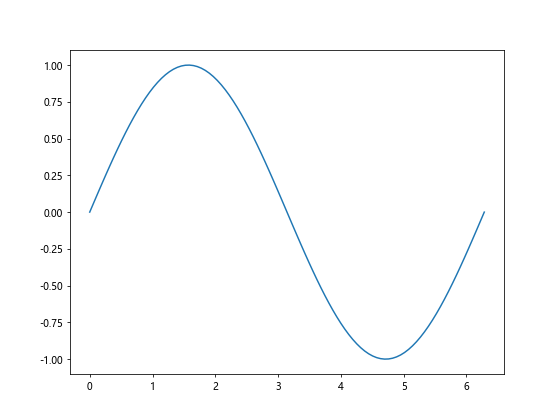
In this example, we create an animation of a sine wave and update the super title in each frame to show the current frame number.
Using Matplotlib.pyplot.suptitle() with 3D Plots
The suptitle() function can also be used with 3D plots. Here’s an example:
import matplotlib.pyplot as plt
import numpy as np
from mpl_toolkits.mplot3d import Axes3D

fig = plt.figure(figsize=(10, 8))
ax = fig.add_subplot(111, projection='3d')

x = np.linspace(-5, 5, 100)
y = np.linspace(-5, 5, 100)
X, Y = np.meshgrid(x, y)
Z = np.sin(np.sqrt(X**2 + Y**2))

surf = ax.plot_surface(X, Y, Z, cmap='viridis')

ax.set_xlabel('X')
ax.set_ylabel('Y')
ax.set_zlabel('Z')

plt.suptitle('3D Sinc Function - how2matplotlib.com', fontsize=16)

plt.colorbar(surf)
plt.show()
Output:
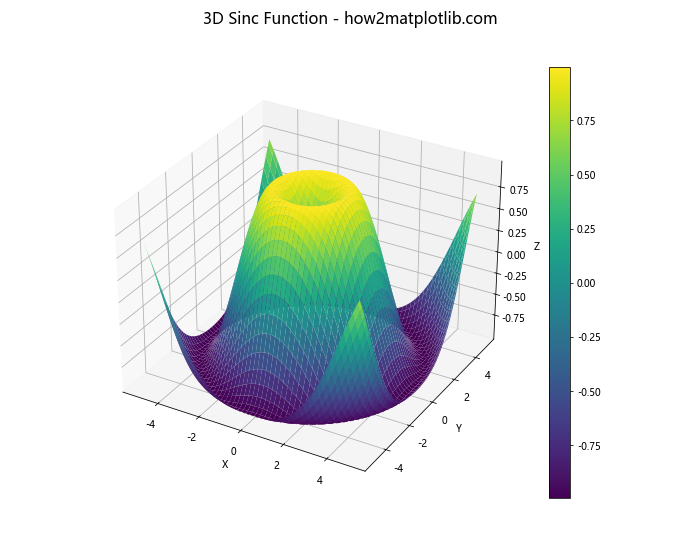
In this example, we create a 3D surface plot of a sinc function and add a super title to the figure.
Combining Matplotlib.pyplot.suptitle() with Colorbars
When working with plots that include colorbars, you might need to adjust the layout to accommodate both the super title and the colorbar:
import matplotlib.pyplot as plt
import numpy as np

fig, ax = plt.subplots(figsize=(10, 8))

data = np.random.rand(10, 10)
im = ax.imshow(data, cmap='viridis')

cbar = fig.colorbar(im)
cbar.set_label('Values')

ax.set_title('Random Data')

plt.suptitle('Heatmap with Colorbar - how2matplotlib.com', fontsize=16, y=0.95)

plt.tight_layout()
plt.show()
Output:

In this example, we create a heatmap with a colorbar and add a super title. The y parameter of suptitle() is adjusted to prevent overlap with the colorbar.
Using Matplotlib.pyplot.suptitle() with Subplots and Shared Axes
When creating subplots with shared axes, the suptitle() function can help provide context for the entire figure:
import matplotlib.pyplot as plt
import numpy as np

fig, (ax1, ax2) = plt.subplots(2, 1, figsize=(8, 10), sharex=True)

x = np.linspace(0, 10, 100)

ax1.plot(x, np.sin(x))
ax1.set_title('Sine Wave')

ax2.plot(x, np.cos(x))
ax2.set_title('Cosine Wave')

ax2.set_xlabel('X-axis')
fig.text(0.04, 0.5, 'Y-axis', va='center', rotation='vertical')

plt.suptitle('Trigonometric Functions with Shared X-axis - how2matplotlib.com',
             fontsize=16)

plt.tight_layout()
plt.show()
Output:
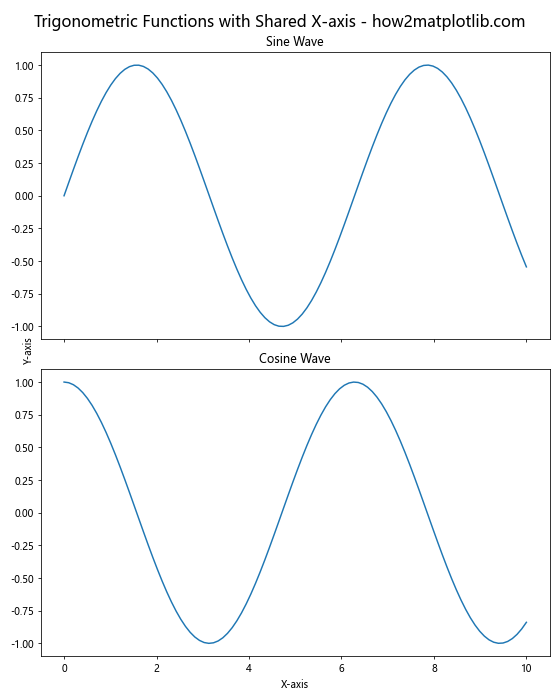
In this example, we create two subplots with a shared x-axis. The suptitle() function is used to provide an overall description of the figure, explaining that the x-axis is shared between the subplots.
Adjusting Matplotlib.pyplot.suptitle() for Different Figure Sizes
When working with figures of different sizes, you might need to adjust the position and size of the super title accordingly:
import matplotlib.pyplot as plt
import numpy as np

def plot_with_suptitle(figsize):
    fig, ax = plt.subplots(figsize=figsize)

    x = np.linspace(0, 10, 100)
    ax.plot(x, np.sin(x))

    fontsize = figsize[0] * 1.5  # Adjust fontsize based on figure width
    y_pos = 0.95 if figsize[1] > figsize[0] else 0.98  # Adjust y position based on aspect ratio

    plt.suptitle(f'Sine Wave - {figsize[0]}x{figsize[1]} - how2matplotlib.com',
                 fontsize=fontsize, y=y_pos)

    plt.tight_layout()
    plt.show()

plot_with_suptitle((8, 6))
plot_with_suptitle((12, 4))
plot_with_suptitle((6, 10))
In this example, we define a function that creates a plot with a super title, adjusting the font size and position based on the figure size. We then call this function with different figure sizes to demonstrate how the super title adapts.
Using Matplotlib.pyplot.suptitle() with Logarithmic Scales
When working with logarithmic scales, the suptitle() function can be used to clarify the nature of the plot:
import matplotlib.pyplot as plt
import numpy as np

fig, (ax1, ax2) = plt.subplots(1, 2, figsize=(12, 6))

x = np.logspace(0, 5, 100)
y = x**2

ax1.plot(x, y)
ax1.set_xscale('log')
ax1.set_yscale('log')
ax1.set_title('Log-Log Scale')

ax2.plot(x, y)
ax2.set_xscale('log')
ax2.set_title('Semi-Log Scale')

plt.suptitle('Comparison of Logarithmic Scales - how2matplotlib.com', fontsize=16)

plt.tight_layout()
plt.show()
Output:
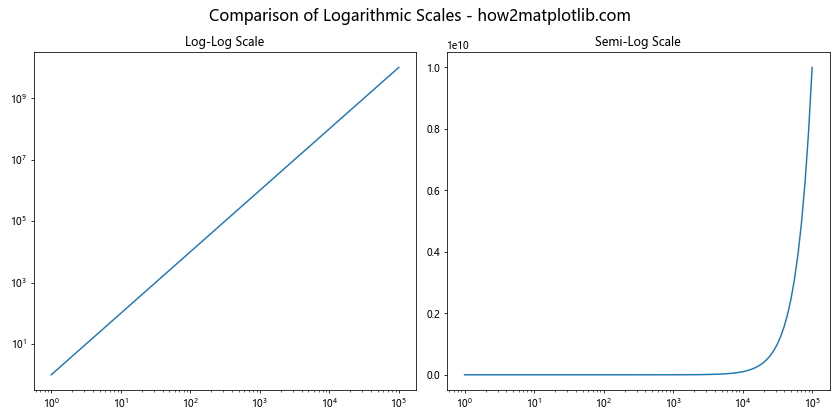
In this example, we create two subplots: one with both axes in log scale, and another with only the x-axis in log scale. The suptitle() function is used to provide an overall description of the comparison being made.
Combining Matplotlib.pyplot.suptitle() with Text Annotations
You can combine the use of suptitle() with text annotations to provide more detailed information about your plots:
import matplotlib.pyplot as plt
import numpy as np

fig, ax = plt.subplots(figsize=(10, 6))

x = np.linspace(0, 10, 100)
y = np.sin(x)

ax.plot(x, y)
ax.set_title('Sine Wave')

plt.suptitle('Trigonometric Function - how2matplotlib.com', fontsize=16)

ax.annotate('Peak', xy=(np.pi/2, 1), xytext=(np.pi/2, 0.5),
            arrowprops=dict(facecolor='black', shrink=0.05))

ax.text(0.5, 0.95, 'Period = 2π', transform=ax.transAxes,
        ha='center', va='top')

plt.tight_layout()
plt.show()
Output:
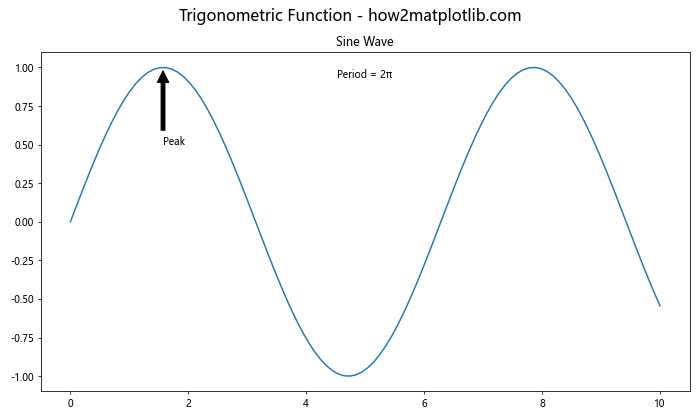
In this example, we use suptitle() to provide an overall title, while using annotations and text to add specific details to the plot itself.
Using Matplotlib.pyplot.suptitle() with Subplots of Different Types
When creating a figure with different types of plots, suptitle() can help tie them together:
import matplotlib.pyplot as plt
import numpy as np

fig = plt.figure(figsize=(12, 8))

# Line plot
ax1 = fig.add_subplot(221)
x = np.linspace(0, 10, 100)
ax1.plot(x, np.sin(x))
ax1.set_title('Sine Wave')

# Scatter plot
ax2 = fig.add_subplot(222)
x = np.random.rand(50)
y = np.random.rand(50)
ax2.scatter(x, y)
ax2.set_title('Random Scatter')

# Bar plot
ax3 = fig.add_subplot(223)
x = ['A', 'B', 'C', 'D']
y = [3, 7, 2, 5]
ax3.bar(x, y)
ax3.set_title('Bar Chart')

# Pie chart
ax4 = fig.add_subplot(224)
sizes = [15, 30, 45, 10]
ax4.pie(sizes, labels=['A', 'B', 'C', 'D'], autopct='%1.1f%%')
ax4.set_title('Pie Chart')

plt.suptitle('Various Plot Types - how2matplotlib.com', fontsize=16)

plt.tight_layout()
plt.show()
Output:
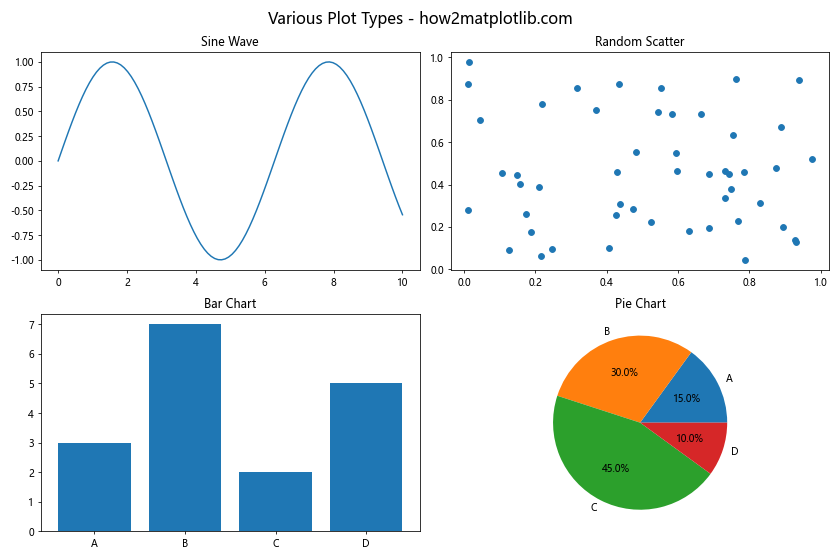
In this example, we create four different types of plots in a single figure. The suptitle() function is used to provide an overarching description of the figure’s contents.
Conclusion
The Matplotlib.pyplot.suptitle() function is a powerful tool for adding super titles to your plots. It allows you to provide context and description for your entire figure, especially when working with multiple subplots. By understanding its parameters and how to combine it with other Matplotlib functions, you can create more informative and visually appealing visualizations.
Throughout this guide, we’ve explored various aspects of the suptitle() function, including:
- Basic usage and syntax
- Customizing the appearance of the super title
- Positioning the super title
- Using suptitle() with different types of plots and subplots
- Combining suptitle() with other Matplotlib features like annotations and colorbars
- Adapting suptitle() for different figure sizes and layouts