Comprehensive Guide to Matplotlib.axis.Axis.draw() Function in Python
Matplotlib.axis.Axis.draw() function in Python is a crucial component of the Matplotlib library, specifically designed for rendering axis objects in data visualizations. This powerful function plays a vital role in creating and customizing plots, charts, and graphs. In this comprehensive guide, we’ll explore the Matplotlib.axis.Axis.draw() function in depth, covering its usage, parameters, and various applications in data visualization.
Understanding the Basics of Matplotlib.axis.Axis.draw() Function
The Matplotlib.axis.Axis.draw() function is responsible for drawing the axis, including tick marks, tick labels, axis labels, and other associated elements. It is typically called automatically when a figure is rendered, but can also be invoked manually for more fine-grained control over the rendering process.
Let’s start with a simple example to demonstrate the basic usage of Matplotlib.axis.Axis.draw():
import matplotlib.pyplot as plt
import numpy as np

# Create a figure and axis
fig, ax = plt.subplots()

# Plot some data
x = np.linspace(0, 10, 100)
y = np.sin(x)
ax.plot(x, y, label='Sine wave')

# Customize the axis
ax.set_title('How to use Matplotlib.axis.Axis.draw()')
ax.set_xlabel('X-axis (how2matplotlib.com)')
ax.set_ylabel('Y-axis (how2matplotlib.com)')

# Draw the axis
ax.xaxis.draw(renderer=fig.canvas.get_renderer())
ax.yaxis.draw(renderer=fig.canvas.get_renderer())

plt.legend()
plt.show()
Output:
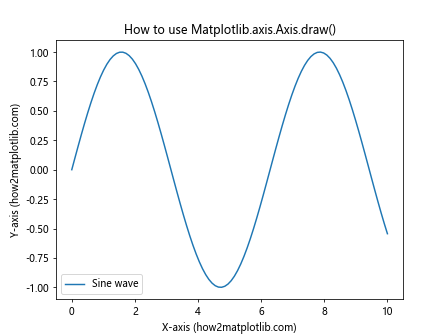
In this example, we create a simple sine wave plot and explicitly call the draw() function on both the x-axis and y-axis. The renderer parameter is obtained from the figure’s canvas, which is necessary for the drawing process.
Customizing Axis Appearance with Matplotlib.axis.Axis.draw() Function
One of the key advantages of using the Matplotlib.axis.Axis.draw() function is the ability to customize the appearance of your axis. Let’s explore some ways to achieve this:
Changing Tick Locations and Labels
import matplotlib.pyplot as plt
import numpy as np

fig, ax = plt.subplots()

x = np.linspace(0, 10, 100)
y = np.exp(x)
ax.plot(x, y, label='Exponential')

ax.set_title('Custom Ticks with Matplotlib.axis.Axis.draw()')
ax.set_xlabel('X-axis (how2matplotlib.com)')
ax.set_ylabel('Y-axis (how2matplotlib.com)')

# Customize tick locations and labels
ax.set_xticks([0, 2, 4, 6, 8, 10])
ax.set_xticklabels(['Zero', 'Two', 'Four', 'Six', 'Eight', 'Ten'])

renderer = fig.canvas.get_renderer()
ax.xaxis.draw(renderer=renderer)
ax.yaxis.draw(renderer=renderer)

plt.legend()
plt.show()
Output:
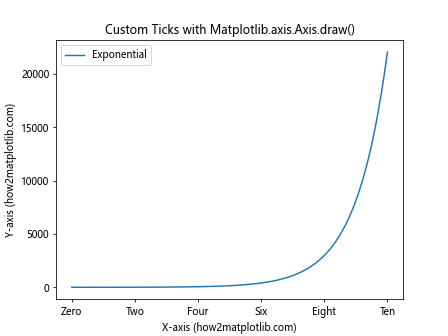
In this example, we customize the x-axis tick locations and labels using set_xticks() and set_xticklabels() methods before calling the draw() function.
Rotating Tick Labels
import matplotlib.pyplot as plt
import numpy as np

fig, ax = plt.subplots()

x = np.arange(10)
y = np.random.rand(10)
ax.bar(x, y, label='Random Data')

ax.set_title('Rotated Tick Labels with Matplotlib.axis.Axis.draw()')
ax.set_xlabel('Categories (how2matplotlib.com)')
ax.set_ylabel('Values (how2matplotlib.com)')

# Rotate x-axis tick labels
plt.setp(ax.get_xticklabels(), rotation=45, ha='right')

renderer = fig.canvas.get_renderer()
ax.xaxis.draw(renderer=renderer)
ax.yaxis.draw(renderer=renderer)

plt.legend()
plt.tight_layout()
plt.show()
Output:
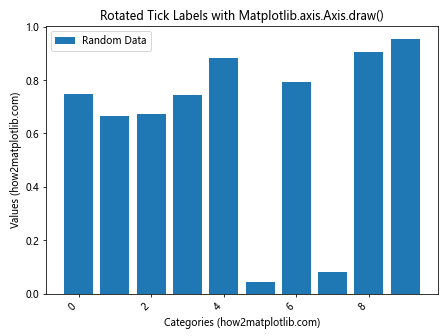
This example demonstrates how to rotate x-axis tick labels for better readability, especially useful when dealing with long category names.
Advanced Techniques with Matplotlib.axis.Axis.draw() Function
Now that we’ve covered the basics, let’s dive into some advanced techniques using the Matplotlib.axis.Axis.draw() function:
Creating Multiple Axes
import matplotlib.pyplot as plt
import numpy as np

fig, (ax1, ax2) = plt.subplots(2, 1, figsize=(8, 8))

x = np.linspace(0, 10, 100)
y1 = np.sin(x)
y2 = np.cos(x)

ax1.plot(x, y1, label='Sine')
ax2.plot(x, y2, label='Cosine')

ax1.set_title('Multiple Axes with Matplotlib.axis.Axis.draw()')
ax1.set_xlabel('X-axis (how2matplotlib.com)')
ax1.set_ylabel('Y-axis (how2matplotlib.com)')

ax2.set_xlabel('X-axis (how2matplotlib.com)')
ax2.set_ylabel('Y-axis (how2matplotlib.com)')

renderer = fig.canvas.get_renderer()

# Draw axes for both subplots
ax1.xaxis.draw(renderer=renderer)
ax1.yaxis.draw(renderer=renderer)
ax2.xaxis.draw(renderer=renderer)
ax2.yaxis.draw(renderer=renderer)

ax1.legend()
ax2.legend()
plt.tight_layout()
plt.show()
Output:
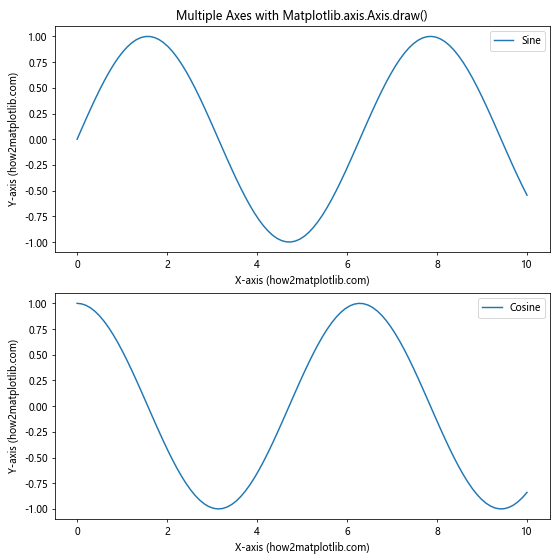
This example showcases how to create and draw multiple axes using the Matplotlib.axis.Axis.draw() function.
Customizing Axis Scales
import matplotlib.pyplot as plt
import numpy as np

fig, (ax1, ax2) = plt.subplots(1, 2, figsize=(12, 5))

x = np.linspace(0, 10, 100)
y = np.exp(x)

ax1.plot(x, y, label='Linear Scale')
ax2.semilogy(x, y, label='Log Scale')

ax1.set_title('Linear vs Log Scale with Matplotlib.axis.Axis.draw()')
ax1.set_xlabel('X-axis (how2matplotlib.com)')
ax1.set_ylabel('Y-axis (how2matplotlib.com)')

ax2.set_title('Log Scale')
ax2.set_xlabel('X-axis (how2matplotlib.com)')
ax2.set_ylabel('Y-axis (how2matplotlib.com)')

renderer = fig.canvas.get_renderer()

# Draw axes for both subplots
ax1.xaxis.draw(renderer=renderer)
ax1.yaxis.draw(renderer=renderer)
ax2.xaxis.draw(renderer=renderer)
ax2.yaxis.draw(renderer=renderer)

ax1.legend()
ax2.legend()
plt.tight_layout()
plt.show()
Output:
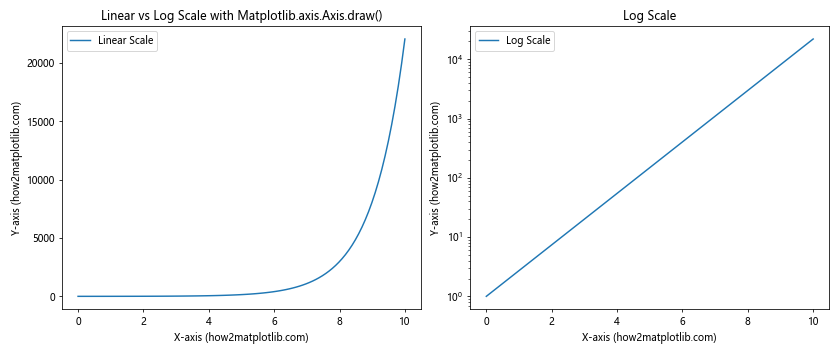
This example demonstrates how to use different axis scales (linear and logarithmic) and draw them using the Matplotlib.axis.Axis.draw() function.
Creating Custom Axis Artists with Matplotlib.axis.Axis.draw() Function
The Matplotlib.axis.Axis.draw() function allows you to create and draw custom axis artists. This can be particularly useful when you need to add specialized elements to your plots:
import matplotlib.pyplot as plt
import numpy as np
from matplotlib.patches import Rectangle

fig, ax = plt.subplots(figsize=(10, 6))

x = np.linspace(0, 10, 100)
y = np.sin(x)
ax.plot(x, y, label='Sine wave')

ax.set_title('Custom Axis Artists with Matplotlib.axis.Axis.draw()')
ax.set_xlabel('X-axis (how2matplotlib.com)')
ax.set_ylabel('Y-axis (how2matplotlib.com)')

# Create a custom axis artist (rectangle)
rect = Rectangle((2, -0.5), 3, 1, fill=False, edgecolor='red')
ax.add_patch(rect)

renderer = fig.canvas.get_renderer()
ax.xaxis.draw(renderer=renderer)
ax.yaxis.draw(renderer=renderer)

plt.legend()
plt.show()
Output:
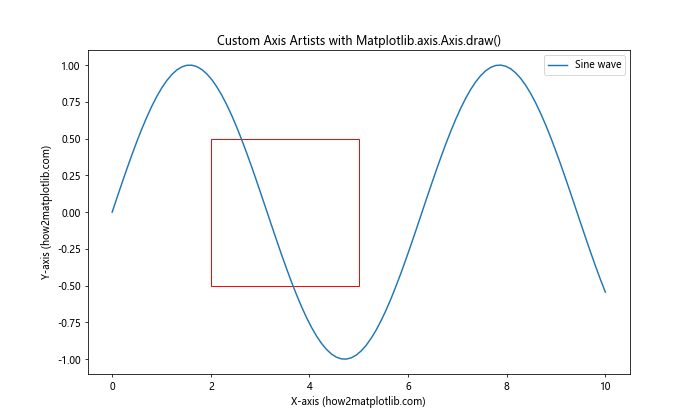
In this example, we add a custom rectangle to highlight a specific region of the plot and use the Matplotlib.axis.Axis.draw() function to render both the standard axes and the custom artist.
Animating Plots with Matplotlib.axis.Axis.draw() Function
The Matplotlib.axis.Axis.draw() function can be particularly useful when creating animated plots. Here’s an example of how to create a simple animation using this function:
import matplotlib.pyplot as plt
import numpy as np
from matplotlib.animation import FuncAnimation

fig, ax = plt.subplots()
x = np.linspace(0, 2*np.pi, 100)
line, = ax.plot(x, np.sin(x))

ax.set_title('Animated Plot with Matplotlib.axis.Axis.draw()')
ax.set_xlabel('X-axis (how2matplotlib.com)')
ax.set_ylabel('Y-axis (how2matplotlib.com)')

def animate(frame):
    line.set_ydata(np.sin(x + frame/10))
    ax.xaxis.draw(renderer=fig.canvas.get_renderer())
    ax.yaxis.draw(renderer=fig.canvas.get_renderer())
    return line,

ani = FuncAnimation(fig, animate, frames=100, interval=50, blit=True)
plt.show()
Output:
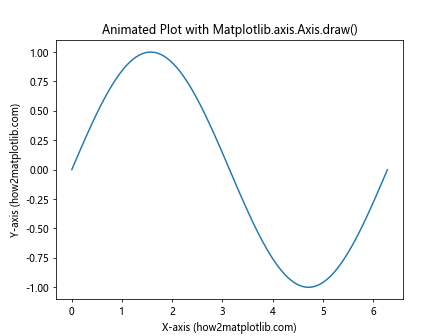
In this animation example, we use the Matplotlib.axis.Axis.draw() function within the animation loop to ensure that the axes are properly updated with each frame.
Customizing Axis Colors and Styles with Matplotlib.axis.Axis.draw() Function
The Matplotlib.axis.Axis.draw() function allows for extensive customization of axis colors and styles. Here’s an example demonstrating various customization options:
import matplotlib.pyplot as plt
import numpy as np

fig, ax = plt.subplots(figsize=(10, 6))

x = np.linspace(0, 10, 100)
y = np.sin(x)
ax.plot(x, y, label='Sine wave')

ax.set_title('Customized Axis Styles with Matplotlib.axis.Axis.draw()')
ax.set_xlabel('X-axis (how2matplotlib.com)')
ax.set_ylabel('Y-axis (how2matplotlib.com)')

# Customize axis colors and styles
ax.spines['top'].set_color('none')
ax.spines['right'].set_color('none')
ax.spines['left'].set_color('blue')
ax.spines['bottom'].set_color('blue')
ax.tick_params(axis='x', colors='red')
ax.tick_params(axis='y', colors='green')
ax.xaxis.label.set_color('purple')
ax.yaxis.label.set_color('orange')

renderer = fig.canvas.get_renderer()
ax.xaxis.draw(renderer=renderer)
ax.yaxis.draw(renderer=renderer)

plt.legend()
plt.show()
Output:
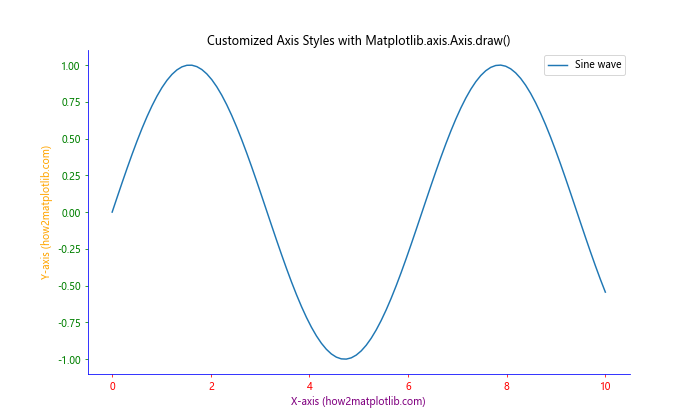
In this example, we customize the color and style of various axis components before calling the Matplotlib.axis.Axis.draw() function to render the customized axes.
Handling Multiple Y-axes with Matplotlib.axis.Axis.draw() Function
Creating plots with multiple y-axes can be challenging, but the Matplotlib.axis.Axis.draw() function can help manage this complexity. Here’san example demonstrating how to create and draw multiple y-axes:
import matplotlib.pyplot as plt
import numpy as np

fig, ax1 = plt.subplots(figsize=(10, 6))

x = np.linspace(0, 10, 100)
y1 = np.sin(x)
y2 = np.exp(x)

ax1.set_xlabel('X-axis (how2matplotlib.com)')
ax1.set_ylabel('Sine', color='tab:blue')
ax1.plot(x, y1, color='tab:blue', label='Sine')
ax1.tick_params(axis='y', labelcolor='tab:blue')

ax2 = ax1.twinx()  # instantiate a second axes that shares the same x-axis
ax2.set_ylabel('Exponential', color='tab:orange')
ax2.plot(x, y2, color='tab:orange', label='Exponential')
ax2.tick_params(axis='y', labelcolor='tab:orange')

plt.title('Multiple Y-axes with Matplotlib.axis.Axis.draw()')

renderer = fig.canvas.get_renderer()
ax1.xaxis.draw(renderer=renderer)
ax1.yaxis.draw(renderer=renderer)
ax2.yaxis.draw(renderer=renderer)

fig.tight_layout()
plt.show()
Output:
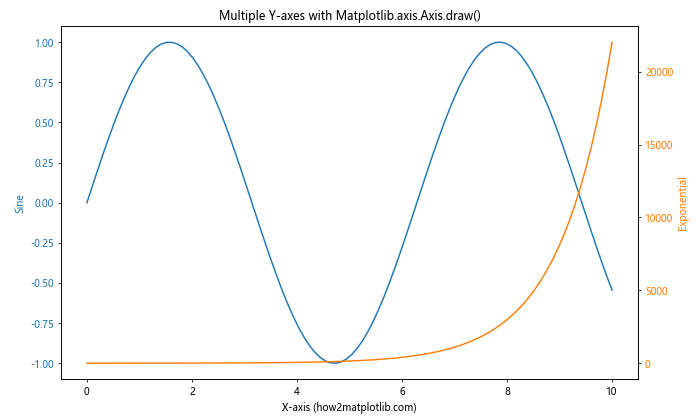
In this example, we create two y-axes on the same plot and use the Matplotlib.axis.Axis.draw() function to render both y-axes separately.
Handling Polar Plots with Matplotlib.axis.Axis.draw() Function
The Matplotlib.axis.Axis.draw() function can also be used with polar plots. Here’s an example demonstrating its usage in a polar context:
import matplotlib.pyplot as plt
import numpy as np

fig, ax = plt.subplots(subplot_kw=dict(projection='polar'))

r = np.linspace(0, 2, 100)
theta = 2 * np.pi * r

ax.plot(theta, r)
ax.set_rticks([0.5, 1, 1.5, 2])
ax.set_rlabel_position(45)

plt.title('Polar Plot with Matplotlib.axis.Axis.draw()')

renderer = fig.canvas.get_renderer()
ax.xaxis.draw(renderer=renderer)
ax.yaxis.draw(renderer=renderer)

plt.show()
Output:
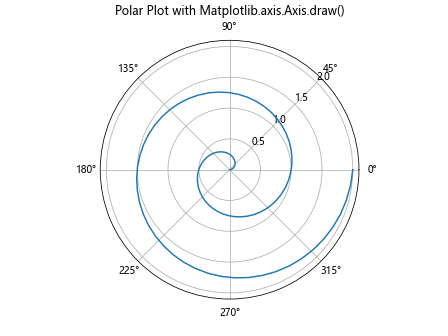
This example creates a simple spiral in a polar coordinate system and uses the Matplotlib.axis.Axis.draw() function to render the radial and angular axes.
Creating Custom Tick Formatters with Matplotlib.axis.Axis.draw() Function
The Matplotlib.axis.Axis.draw() function can be particularly useful when implementing custom tick formatters. Here’s an example:
import matplotlib.pyplot as plt
import numpy as np
from matplotlib.ticker import FuncFormatter

def currency_formatter(x, p):
    return f'${x:1.2f}'

fig, ax = plt.subplots(figsize=(10, 6))

x = np.linspace(0, 10, 11)
y = x ** 2

ax.plot(x, y)
ax.set_title('Custom Tick Formatter with Matplotlib.axis.Axis.draw()')
ax.set_xlabel('X-axis (how2matplotlib.com)')
ax.set_ylabel('Y-axis (USD) (how2matplotlib.com)')

ax.yaxis.set_major_formatter(FuncFormatter(currency_formatter))

renderer = fig.canvas.get_renderer()
ax.xaxis.draw(renderer=renderer)
ax.yaxis.draw(renderer=renderer)

plt.show()
Output:
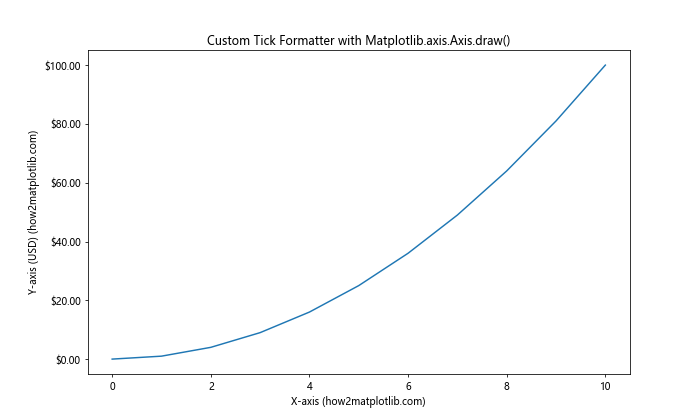
In this example, we create a custom formatter to display y-axis values as currency and use the Matplotlib.axis.Axis.draw() function to render the axes with the custom formatting.
Handling Logarithmic Scales with Matplotlib.axis.Axis.draw() Function
The Matplotlib.axis.Axis.draw() function can be particularly useful when working with logarithmic scales. Here’s an example:
import matplotlib.pyplot as plt
import numpy as np

fig, (ax1, ax2) = plt.subplots(1, 2, figsize=(12, 5))

x = np.logspace(0, 5, 100)
y = x ** 2

ax1.plot(x, y)
ax1.set_xscale('log')
ax1.set_yscale('log')
ax1.set_title('Log-Log Plot')
ax1.set_xlabel('X-axis (log scale) (how2matplotlib.com)')
ax1.set_ylabel('Y-axis (log scale) (how2matplotlib.com)')

ax2.semilogx(x, y)
ax2.set_title('Semilog Plot')
ax2.set_xlabel('X-axis (log scale) (how2matplotlib.com)')
ax2.set_ylabel('Y-axis (linear scale) (how2matplotlib.com)')

renderer = fig.canvas.get_renderer()
ax1.xaxis.draw(renderer=renderer)
ax1.yaxis.draw(renderer=renderer)
ax2.xaxis.draw(renderer=renderer)
ax2.yaxis.draw(renderer=renderer)

plt.tight_layout()
plt.show()
Output:
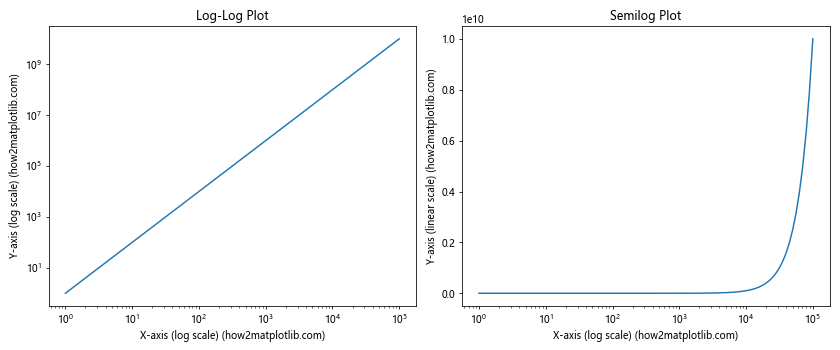
This example demonstrates how to create log-log and semilog plots using the Matplotlib.axis.Axis.draw() function to render the axes with logarithmic scales.
Creating Broken Axis Plots with Matplotlib.axis.Axis.draw() Function
The Matplotlib.axis.Axis.draw() function can be used to create broken axis plots, which are useful when you need to display data with significantly different scales. Here’s an example:
import matplotlib.pyplot as plt
import numpy as np

fig, (ax1, ax2) = plt.subplots(2, 1, sharex=True, figsize=(8, 6))
fig.subplots_adjust(hspace=0.05)  # adjust space between axes

# plot the same data on both axes
x = np.linspace(0, 10, 100)
y = np.sin(x) + 1000

ax1.plot(x, y)
ax2.plot(x, y)

# zoom-in / limit the view to different portions of the data
ax1.set_ylim(1000.5, 1001.5)  # outliers only
ax2.set_ylim(998, 1000)  # most of the data

# hide the spines between ax and ax2
ax1.spines['bottom'].set_visible(False)
ax2.spines['top'].set_visible(False)
ax1.xaxis.tick_top()
ax1.tick_params(labeltop=False)  # don't put tick labels at the top
ax2.xaxis.tick_bottom()

# Now, let's add the break symbol in axes coordinates
d = .015  # how big to make the diagonal lines in axes coordinates
kwargs = dict(transform=ax1.transAxes, color='k', clip_on=False)
ax1.plot((-d, +d), (-d, +d), **kwargs)        # top-left diagonal
ax1.plot((1 - d, 1 + d), (-d, +d), **kwargs)  # top-right diagonal

kwargs.update(transform=ax2.transAxes)  # switch to the bottom axes
ax2.plot((-d, +d), (1 - d, 1 + d), **kwargs)  # bottom-left diagonal
ax2.plot((1 - d, 1 + d), (1 - d, 1 + d), **kwargs)  # bottom-right diagonal

ax2.set_xlabel('X-axis (how2matplotlib.com)')
ax1.set_ylabel('Y-axis (how2matplotlib.com)')
ax2.set_ylabel('Y-axis (how2matplotlib.com)')
fig.suptitle('Broken Axis Plot with Matplotlib.axis.Axis.draw()')

renderer = fig.canvas.get_renderer()
ax1.xaxis.draw(renderer=renderer)
ax1.yaxis.draw(renderer=renderer)
ax2.xaxis.draw(renderer=renderer)
ax2.yaxis.draw(renderer=renderer)

plt.show()
Output:
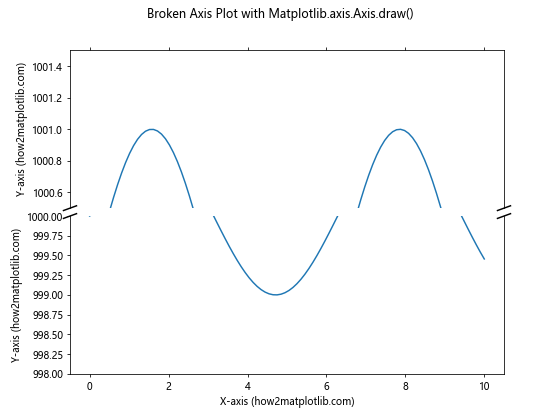
This example creates a broken axis plot to display data with significantly different scales, using the Matplotlib.axis.Axis.draw() function to render the axes for both parts of the plot.
Conclusion
The Matplotlib.axis.Axis.draw() function is a powerful tool in the Matplotlib library that allows for fine-grained control over axis rendering in data visualizations. Throughout this comprehensive guide, we’ve explored various aspects and applications of this function, from basic usage to advanced techniques.
We’ve covered topics such as customizing axis appearance, handling multiple axes, working with date and time data, creating animations, dealing with 3D plots, and implementing custom tick formatters. We’ve also explored how the Matplotlib.axis.Axis.draw() function can be used in specialized plot types like polar plots and broken axis plots.
By leveraging the capabilities of the Matplotlib.axis.Axis.draw() function, you can create more sophisticated and customized data visualizations that effectively communicate your data insights. Whether you’re working on simple line plots or complex multi-axis visualizations, understanding and utilizing this function can significantly enhance your data visualization toolkit.