How to Master Formatting Axes in Matplotlib
Formatting axes in Matplotlib is a crucial skill for creating effective and visually appealing data visualizations. This comprehensive guide will explore various techniques and best practices for formatting axes in Matplotlib, providing you with the knowledge and tools to enhance your plots and charts. We’ll cover everything from basic axis formatting to advanced customization options, ensuring you have a thorough understanding of how to format axes in Matplotlib.
Understanding the Importance of Formatting Axes in Matplotlib
Formatting axes in Matplotlib is essential for creating clear and informative visualizations. Properly formatted axes can help convey information more effectively, improve readability, and enhance the overall aesthetics of your plots. By mastering the art of formatting axes in Matplotlib, you’ll be able to create professional-looking charts and graphs that effectively communicate your data.
When formatting axes in Matplotlib, you have control over various elements, including:
- Axis labels
- Tick marks and tick labels
- Axis limits and scales
- Grid lines
- Axis spines
- Axis titles
Let’s dive into each of these aspects and explore how to format axes in Matplotlib to create stunning visualizations.
Getting Started with Basic Axis Formatting in Matplotlib
Before we delve into more advanced techniques for formatting axes in Matplotlib, let’s start with some basic formatting options. These fundamental techniques will serve as a foundation for more complex customizations.
Setting Axis Labels
One of the most basic yet essential aspects of formatting axes in Matplotlib is setting appropriate axis labels. Axis labels help viewers understand what each axis represents. Here’s an example of how to set axis labels:
import matplotlib.pyplot as plt
import numpy as np

x = np.linspace(0, 10, 100)
y = np.sin(x)

plt.figure(figsize=(8, 6))
plt.plot(x, y)
plt.xlabel('X-axis (how2matplotlib.com)')
plt.ylabel('Y-axis (how2matplotlib.com)')
plt.title('Formatting Axes in Matplotlib: Basic Example')
plt.show()
Output:
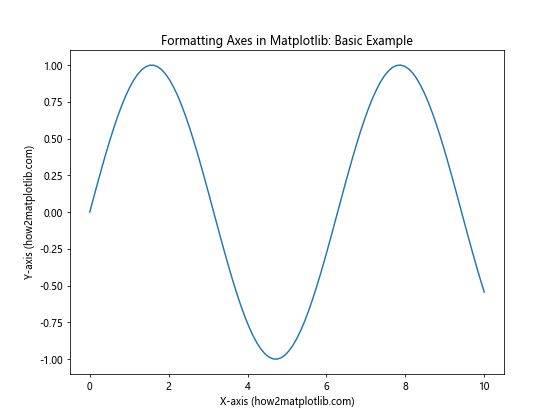
In this example, we use the plt.xlabel() and plt.ylabel() functions to set labels for the x and y axes, respectively. The plt.title() function is used to add a title to the plot.
Adjusting Tick Marks and Labels
Formatting axes in Matplotlib also involves customizing tick marks and labels. You can control the position, frequency, and appearance of tick marks to improve the readability of your plot. Here’s an example:
import matplotlib.pyplot as plt
import numpy as np

x = np.linspace(0, 10, 100)
y = np.exp(x)

plt.figure(figsize=(8, 6))
plt.plot(x, y)
plt.xlabel('X-axis (how2matplotlib.com)')
plt.ylabel('Y-axis (how2matplotlib.com)')
plt.title('Formatting Axes in Matplotlib: Custom Ticks')

plt.xticks(np.arange(0, 11, 2))
plt.yticks(np.logspace(0, 4, 5))

plt.show()
Output:
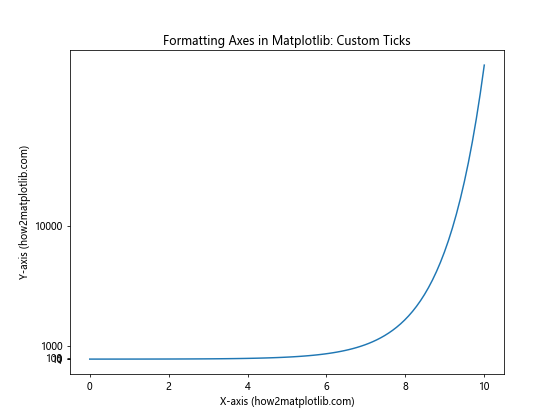
In this example, we use plt.xticks() to set custom x-axis tick positions and plt.yticks() to set custom y-axis tick positions using logarithmic spacing. This demonstrates how formatting axes in Matplotlib can be used to create more informative tick marks.
Advanced Techniques for Formatting Axes in Matplotlib
Now that we’ve covered the basics, let’s explore some advanced techniques for formatting axes in Matplotlib. These methods will allow you to create more sophisticated and customized visualizations.
Customizing Axis Limits and Scales
When formatting axes in Matplotlib, you may want to adjust the axis limits or change the scale of an axis. This can be particularly useful when dealing with data that spans a wide range of values. Here’s an example:
import matplotlib.pyplot as plt
import numpy as np

x = np.linspace(0, 10, 100)
y = np.exp(x)

plt.figure(figsize=(8, 6))
plt.plot(x, y)
plt.xlabel('X-axis (how2matplotlib.com)')
plt.ylabel('Y-axis (how2matplotlib.com)')
plt.title('Formatting Axes in Matplotlib: Custom Limits and Scale')

plt.xlim(0, 8)
plt.ylim(1, 1000)
plt.yscale('log')

plt.show()
Output:
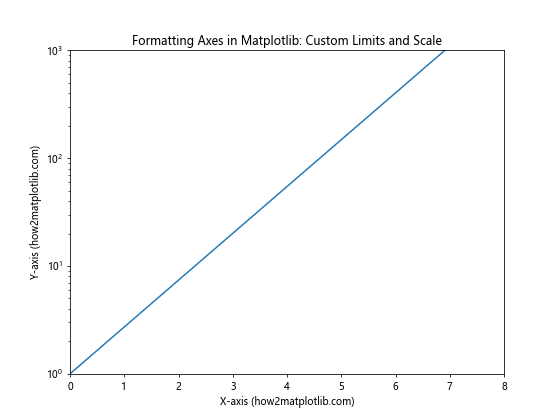
In this example, we use plt.xlim() and plt.ylim() to set custom axis limits, and plt.yscale('log') to change the y-axis to a logarithmic scale. This demonstrates how formatting axes in Matplotlib can help visualize data with large variations.
Adding Grid Lines
Grid lines can improve the readability of your plots when formatting axes in Matplotlib. Here’s an example of how to add grid lines to your plot:
import matplotlib.pyplot as plt
import numpy as np

x = np.linspace(0, 10, 100)
y = np.sin(x)

plt.figure(figsize=(8, 6))
plt.plot(x, y)
plt.xlabel('X-axis (how2matplotlib.com)')
plt.ylabel('Y-axis (how2matplotlib.com)')
plt.title('Formatting Axes in Matplotlib: Grid Lines')

plt.grid(True, linestyle='--', alpha=0.7)

plt.show()
Output:
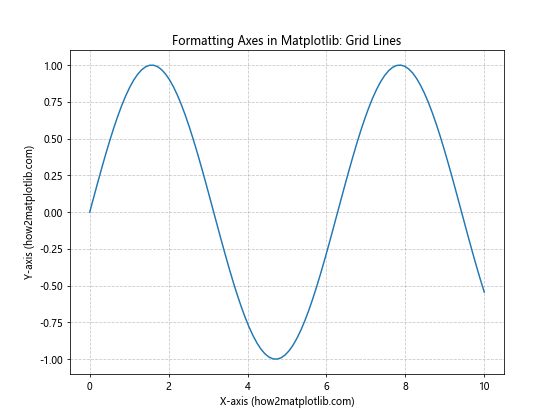
In this example, we use plt.grid() to add grid lines to the plot. The linestyle parameter sets the line style to dashed, and alpha controls the transparency of the grid lines.
Customizing Axis Spines
Axis spines are the lines that border the plot area. When formatting axes in Matplotlib, you can customize these spines to create unique visual effects. Here’s an example:
import matplotlib.pyplot as plt
import numpy as np

x = np.linspace(-5, 5, 100)
y = x**2

fig, ax = plt.subplots(figsize=(8, 6))
ax.plot(x, y)
ax.set_xlabel('X-axis (how2matplotlib.com)')
ax.set_ylabel('Y-axis (how2matplotlib.com)')
ax.set_title('Formatting Axes in Matplotlib: Custom Spines')

# Move the left and bottom spines to x=0 and y=0
ax.spines['left'].set_position('zero')
ax.spines['bottom'].set_position('zero')

# Hide the top and right spines
ax.spines['top'].set_visible(False)
ax.spines['right'].set_visible(False)

plt.show()
Output:
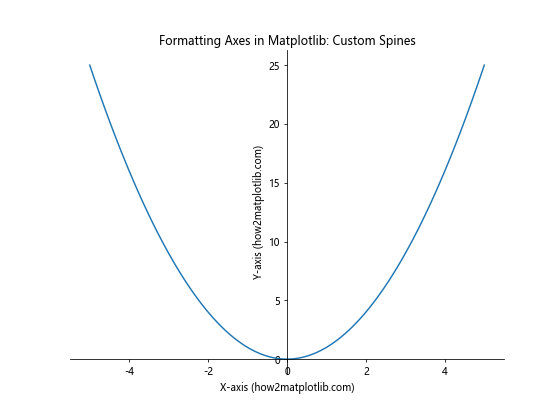
In this example, we move the left and bottom spines to the origin (x=0, y=0) and hide the top and right spines. This creates a coordinate system-like appearance, demonstrating the flexibility of formatting axes in Matplotlib.
Formatting Multiple Axes in Matplotlib
When working with more complex visualizations, you may need to format multiple axes in Matplotlib. This section will cover techniques for creating and formatting subplots and twin axes.
Creating and Formatting Subplots
Subplots allow you to display multiple plots in a single figure. When formatting axes in Matplotlib for subplots, you need to consider the layout and individual axis properties. Here’s an example:
import matplotlib.pyplot as plt
import numpy as np

x = np.linspace(0, 10, 100)
y1 = np.sin(x)
y2 = np.cos(x)

fig, (ax1, ax2) = plt.subplots(2, 1, figsize=(8, 8))
fig.suptitle('Formatting Axes in Matplotlib: Subplots')

ax1.plot(x, y1)
ax1.set_xlabel('X-axis (how2matplotlib.com)')
ax1.set_ylabel('Sin(x)')
ax1.set_title('Sine Function')

ax2.plot(x, y2)
ax2.set_xlabel('X-axis (how2matplotlib.com)')
ax2.set_ylabel('Cos(x)')
ax2.set_title('Cosine Function')

plt.tight_layout()
plt.show()
Output:
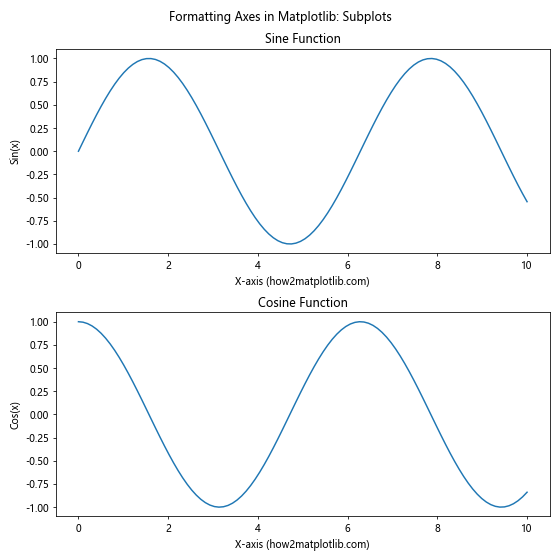
In this example, we create two subplots using plt.subplots(). We then format each axis individually using methods like set_xlabel(), set_ylabel(), and set_title(). The tight_layout() function is used to automatically adjust the spacing between subplots.
Working with Twin Axes
Twin axes are useful when you want to display two different scales on the same plot. Formatting axes in Matplotlib for twin axes requires careful consideration to ensure clarity. Here’s an example:
import matplotlib.pyplot as plt
import numpy as np

x = np.linspace(0, 10, 100)
y1 = np.sin(x)
y2 = np.exp(x)

fig, ax1 = plt.subplots(figsize=(8, 6))

ax1.set_xlabel('X-axis (how2matplotlib.com)')
ax1.set_ylabel('Sin(x)', color='blue')
ax1.plot(x, y1, color='blue')
ax1.tick_params(axis='y', labelcolor='blue')

ax2 = ax1.twinx()
ax2.set_ylabel('Exp(x)', color='red')
ax2.plot(x, y2, color='red')
ax2.tick_params(axis='y', labelcolor='red')

plt.title('Formatting Axes in Matplotlib: Twin Axes')
plt.show()
Output:
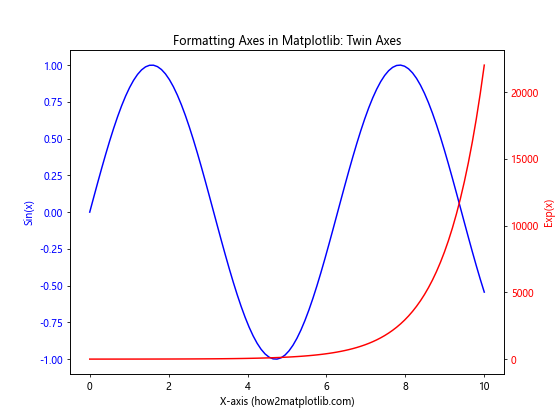
In this example, we create a primary axis (ax1) and a twin axis (ax2) using ax1.twinx(). We then format each axis separately, using different colors for the labels and tick marks to distinguish between the two scales.
Fine-tuning Axis Formatting in Matplotlib
To achieve professional-looking visualizations, it’s important to pay attention to the finer details when formatting axes in Matplotlib. This section will cover techniques for customizing tick labels, adding minor ticks, and rotating axis labels.
Customizing Tick Labels
You can customize the appearance and format of tick labels when formatting axes in Matplotlib. This is particularly useful for displaying dates, currencies, or scientific notation. Here’s an example:
import matplotlib.pyplot as plt
import numpy as np

x = np.linspace(0, 1e6, 10)
y = x**2

fig, ax = plt.subplots(figsize=(8, 6))
ax.plot(x, y)

ax.set_xlabel('X-axis (how2matplotlib.com)')
ax.set_ylabel('Y-axis (how2matplotlib.com)')
ax.set_title('Formatting Axes in Matplotlib: Custom Tick Labels')

# Format x-axis labels as millions
ax.xaxis.set_major_formatter(plt.FuncFormatter(lambda x, p: f'{x/1e6:.1f}M'))

# Format y-axis labels in scientific notation
ax.yaxis.set_major_formatter(plt.ScalarFormatter(useMathText=True))
ax.ticklabel_format(style='sci', axis='y', scilimits=(0,0))

plt.show()
Output:
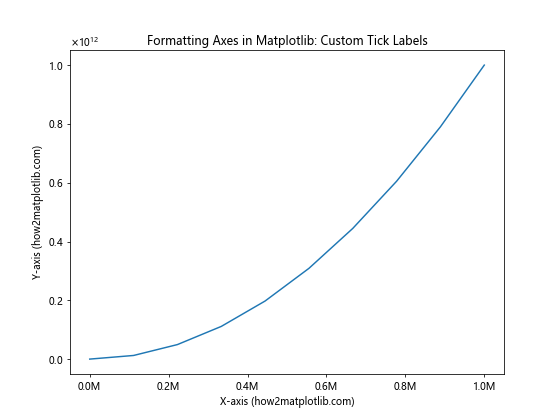
In this example, we use FuncFormatter to format x-axis labels as millions and ScalarFormatter with ticklabel_format to display y-axis labels in scientific notation.
Adding Minor Ticks
Minor ticks can provide additional precision to your plots. Here’s how to add and format minor ticks when formatting axes in Matplotlib:
import matplotlib.pyplot as plt
import numpy as np

x = np.linspace(0, 10, 100)
y = np.sin(x)

fig, ax = plt.subplots(figsize=(8, 6))
ax.plot(x, y)

ax.set_xlabel('X-axis (how2matplotlib.com)')
ax.set_ylabel('Y-axis (how2matplotlib.com)')
ax.set_title('Formatting Axes in Matplotlib: Minor Ticks')

ax.xaxis.set_minor_locator(plt.MultipleLocator(0.5))
ax.yaxis.set_minor_locator(plt.MultipleLocator(0.1))

ax.grid(which='major', linestyle='-', linewidth='0.5', color='red')
ax.grid(which='minor', linestyle=':', linewidth='0.5', color='black')

plt.show()
Output:
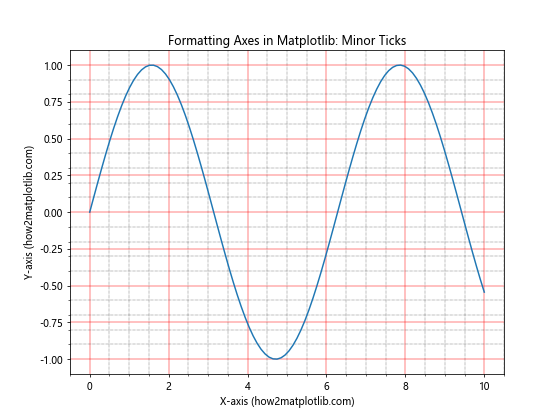
In this example, we use MultipleLocator to set the frequency of minor ticks on both axes. We also add grid lines for both major and minor ticks to demonstrate the difference.
Rotating Axis Labels
When dealing with long labels or dates, rotating axis labels can improve readability. Here’s how to rotate labels when formatting axes in Matplotlib:
import matplotlib.pyplot as plt
import numpy as np

categories = ['Category A (how2matplotlib.com)', 'Category B (how2matplotlib.com)',
              'Category C (how2matplotlib.com)', 'Category D (how2matplotlib.com)']
values = [15, 30, 45, 10]

fig, ax = plt.subplots(figsize=(8, 6))
ax.bar(categories, values)

ax.set_xlabel('Categories')
ax.set_ylabel('Values')
ax.set_title('Formatting Axes in Matplotlib: Rotated Labels')

plt.xticks(rotation=45, ha='right')
plt.tight_layout()
plt.show()
Output:
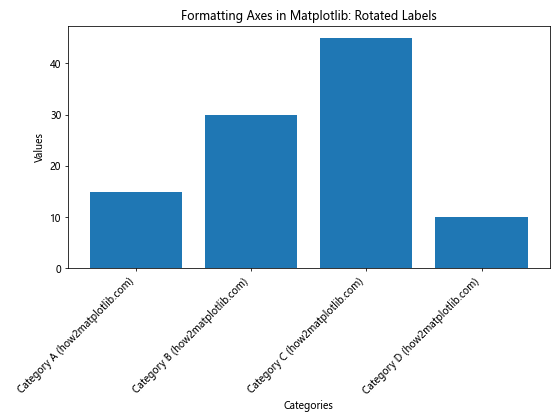
In this example, we use plt.xticks(rotation=45, ha='right') to rotate the x-axis labels by 45 degrees and align them to the right.
Advanced Axis Formatting Techniques in Matplotlib
For more complex visualizations, you may need to employ advanced techniques when formatting axes in Matplotlib. This section will cover creating broken axes, using logarithmic scales, and customizing 3D axes.
Creating Broken Axes
Broken axes can be useful when you want to display data with significantly different scales or ranges. Here’s an example of how to create broken axes when formatting axes in Matplotlib:
import matplotlib.pyplot as plt
import numpy as np

fig, (ax1, ax2) = plt.subplots(2, 1, figsize=(8, 6), sharex=True)
fig.subplots_adjust(hspace=0.05)

x = np.linspace(0, 10, 100)
y = np.exp(x)

ax1.plot(x, y)
ax2.plot(x, y)

ax1.set_ylim(50000, 220000)
ax2.set_ylim(0, 1000)

ax1.spines['bottom'].set_visible(False)
ax2.spines['top'].set_visible(False)
ax1.xaxis.tick_top()
ax1.tick_params(labeltop=False)
ax2.xaxis.tick_bottom()

d = .015
kwargs = dict(transform=ax1.transAxes, color='k', clip_on=False)
ax1.plot((-d, +d), (-d, +d), **kwargs)
ax1.plot((1-d, 1+d), (-d, +d), **kwargs)

kwargs.update(transform=ax2.transAxes)
ax2.plot((-d, +d), (1-d, 1+d), **kwargs)
ax2.plot((1-d, 1+d), (1-d, 1+d), **kwargs)

ax2.set_xlabel('X-axis (how2matplotlib.com)')
ax1.set_ylabel('Y-axis (how2matplotlib.com)')
ax2.set_ylabel('Y-axis (how2matplotlib.com)')
fig.suptitle('Formatting Axes in Matplotlib: Broken Axes')

plt.show()
Output:
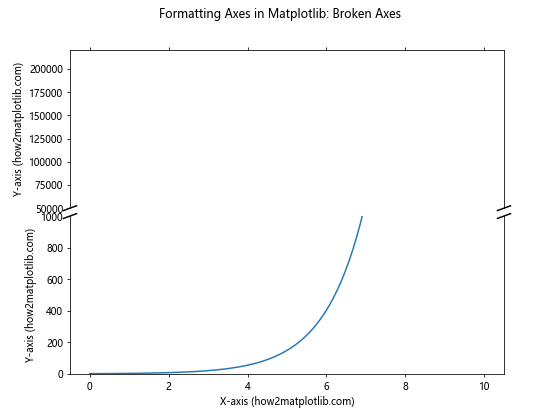
In this example, we create two axes with different y-axis limits and connect them with diagonal lines to indicate a break in the axis.
Using Logarithmic Scales
Logarithmic scales are useful for displaying data that spans multiple orders of magnitude. Here’s how to use logarithmic scales when formatting axes in Matplotlib:
import matplotlib.pyplot as plt
import numpy as np

x = np.logspace(0, 5, 100)
y1 = x**2
y2 = x**3

fig, ax = plt.subplots(figsize=(8, 6))

ax.loglog(x, y1, label='y = x^2')
ax.loglog(x, y2, label='y = x^3')

ax.set_xlabel('X-axis (how2matplotlib.com)')
ax.set_ylabel('Y-axis (how2matplotlib.com)')
ax.set_title('Formatting Axes in Matplotlib: Logarithmic Scales')
ax.legend()

ax.grid(True, which="both", ls="-", alpha=0.5)

plt.show()
Output:
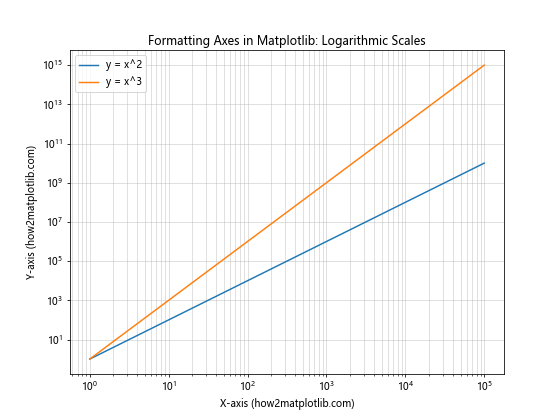
In this example, we use ax.loglog() to create a plot with logarithmic scales on both axes. We also add a grid for both major and minor ticks to improve readability.
Customizing 3D Axes
When working with 3D plots, formatting axes in Matplotlib requires special consideration. Here’s an example of how to customize 3D axes:
import matplotlib.pyplot as plt
import numpy as np
from mpl_toolkits.mplot3d import Axes3D

fig = plt.figure(figsize=(8, 6))
ax = fig.add_subplot(111, projection='3d')

x = np.linspace(-5, 5, 100)
y = np.linspace(-5, 5, 100)
X, Y = np.meshgrid(x, y)
Z = np.sin(np.sqrt(X**2 + Y**2))

surf = ax.plot_surface(X, Y, Z, cmap='viridis')

ax.set_xlabel('X-axis (how2matplotlib.com)')
ax.set_ylabel('Y-axis (how2matplotlib.com)')
ax.set_zlabel('Z-axis (how2matplotlib.com)')
ax.set_title('Formatting Axes in Matplotlib: 3D Axes')

fig.colorbar(surf, shrink=0.5, aspect=5)

plt.show()
Output:
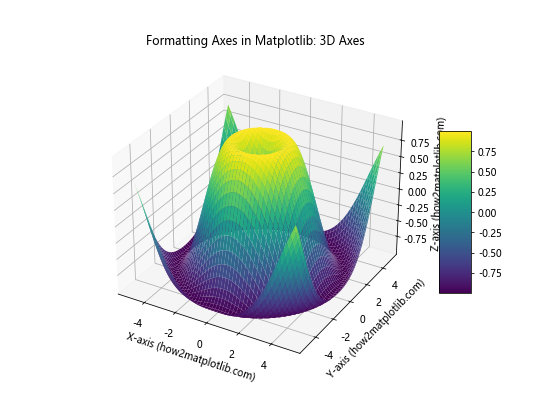
In this example, we create a 3D surface plot and customize the axes labels and title. We also add a color bar to show the mapping between colors and z-values.
Best Practices for Formatting Axes in Matplotlib
When formatting axes in Matplotlib, it’s important to follow best practices to ensure your visualizations are clear, informative, and visually appealing. Here are some tips to keep in mind:
- Consistency: Maintain a consistent style across all axes in your visualization.
- Readability: Ensure that axis labels, tick marks, and other elements are easily readable.
- Relevance: Only include information that is relevant to understanding the data.
- Color usage: Use colors effectively to distinguish between different elements or data series.
- Whitespace: Utilize whitespace effectively to prevent cluttering.
Let’s explore these best practices with an example:
import matplotlib.pyplot as plt
import numpy as np

fig, (ax1, ax2) = plt.subplots(1, 2, figsize=(12, 5))
fig.suptitle('Formatting Axes in Matplotlib: Best Practices', fontsize=16)

x = np.linspace(0, 10, 100)
y1 = np.sin(x)
y2 = np.cos(x)

ax1.plot(x, y1, label='Sin(x)')
ax1.plot(x, y2, label='Cos(x)')
ax1.set_xlabel('X-axis (how2matplotlib.com)')
ax1.set_ylabel('Y-axis (how2matplotlib.com)')
ax1.set_title('Trigonometric Functions')
ax1.legend()
ax1.grid(True, linestyle='--', alpha=0.7)

categories = ['A', 'B', 'C', 'D']
values = [15, 30, 45, 10]
ax2.bar(categories, values)
ax2.set_xlabel('Categories (how2matplotlib.com)')
ax2.set_ylabel('Values (how2matplotlib.com)')
ax2.set_title('Bar Chart')
ax2.set_ylim(0, 50)

for i, v in enumerate(values):
    ax2.text(i, v + 1, str(v), ha='center')

plt.tight_layout()
plt.show()
Output:
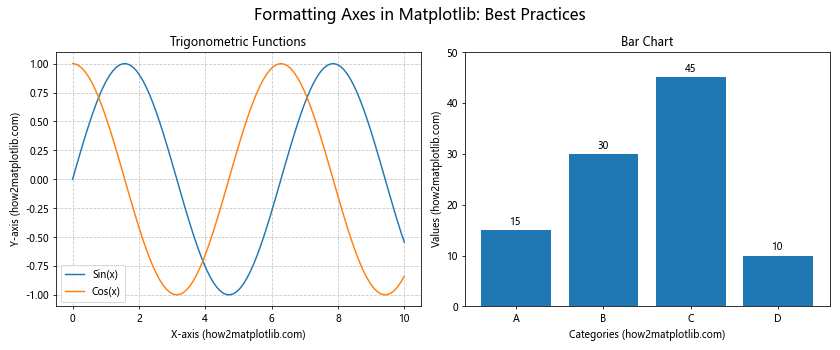
In this example, we demonstrate several best practices for formatting axes in Matplotlib:
- Consistency: Both subplots use similar font sizes and styles for labels and titles.
- Readability: Axis labels and tick marks are clear and easy to read.
- Relevance: We include only necessary information, such as legends and value labels where appropriate.
- Color usage: Different colors are used to distinguish between data series in the line plot.
- Whitespace: We use
tight_layout()to ensure proper spacing between subplots.
Troubleshooting Common Issues When Formatting Axes in Matplotlib
Even experienced users may encounter issues when formatting axes in Matplotlib. Here are some common problems and their solutions:
Overlapping Labels
When dealing with long labels or many data points, axis labels may overlap. Here’s how to address this issue:
import matplotlib.pyplot as plt
import numpy as np

fig, (ax1, ax2) = plt.subplots(2, 1, figsize=(8, 10))
fig.suptitle('Formatting Axes in Matplotlib: Fixing Overlapping Labels', fontsize=16)

x = np.arange(20)
y = np.random.rand(20)

ax1.bar(x, y)
ax1.set_xlabel('X-axis (how2matplotlib.com)')
ax1.set_ylabel('Y-axis (how2matplotlib.com)')
ax1.set_title('Before: Overlapping Labels')

ax2.bar(x, y)
ax2.set_xlabel('X-axis (how2matplotlib.com)')
ax2.set_ylabel('Y-axis (how2matplotlib.com)')
ax2.set_title('After: Fixed Overlapping Labels')
ax2.set_xticks(x[::2])
ax2.tick_params(axis='x', rotation=45)

plt.tight_layout()
plt.show()
Output:
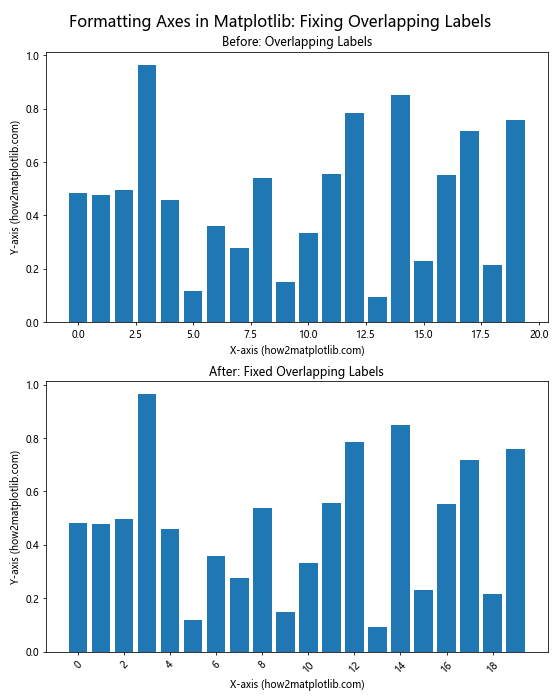
In this example, we demonstrate how to fix overlapping labels by reducing the number of tick marks and rotating the labels.
Misaligned Axes
When working with multiple subplots or twin axes, misalignment can occur. Here’s how to address this issue:
import matplotlib.pyplot as plt
import numpy as np

fig, (ax1, ax2) = plt.subplots(1, 2, figsize=(12, 5))
fig.suptitle('Formatting Axes in Matplotlib: Fixing Misaligned Axes', fontsize=16)

x = np.linspace(0, 10, 100)
y1 = np.sin(x)
y2 = np.exp(x)

ax1.plot(x, y1)
ax1.set_xlabel('X-axis (how2matplotlib.com)')
ax1.set_ylabel('Sin(x)')
ax1.set_title('Sine Function')

ax2.plot(x, y2)
ax2.set_xlabel('X-axis (how2matplotlib.com)')
ax2.set_ylabel('Exp(x)')
ax2.set_title('Exponential Function')

plt.tight_layout()
plt.show()
Output:
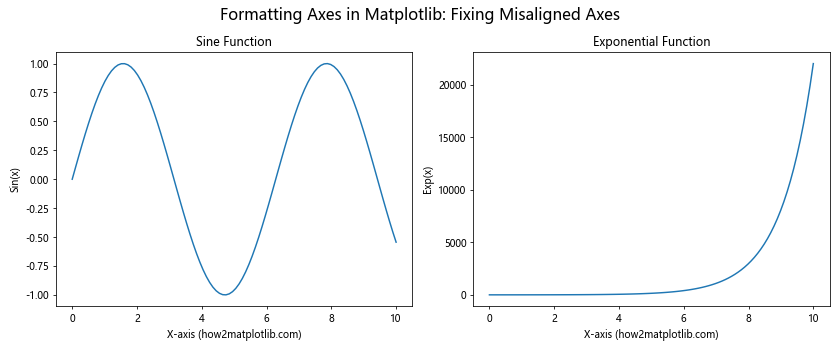
In this example, we use tight_layout() to automatically adjust the spacing between subplots and align the axes.
Advanced Customization Techniques for Formatting Axes in Matplotlib
For those looking to take their axis formatting skills to the next level, Matplotlib offers advanced customization options. Let’s explore some of these techniques:
Custom Tick Locators and Formatters
You can create custom tick locators and formatters to have fine-grained control over tick placement and labeling:
import matplotlib.pyplot as plt
import numpy as np
from matplotlib.ticker import FuncFormatter, MultipleLocator

def currency_formatter(x, p):
    return f'${x:,.0f}'

x = np.linspace(0, 1e6, 100)
y = x**2

fig, ax = plt.subplots(figsize=(8, 6))
ax.plot(x, y)

ax.set_xlabel('X-axis (how2matplotlib.com)')
ax.set_ylabel('Y-axis (how2matplotlib.com)')
ax.set_title('Formatting Axes in Matplotlib: Custom Tick Formatting')

ax.xaxis.set_major_locator(MultipleLocator(2e5))
ax.xaxis.set_major_formatter(FuncFormatter(currency_formatter))

ax.yaxis.set_major_formatter(FuncFormatter(lambda x, p: f'{x/1e6:.1f}M'))

plt.xticks(rotation=45)
plt.tight_layout()
plt.show()
Output:
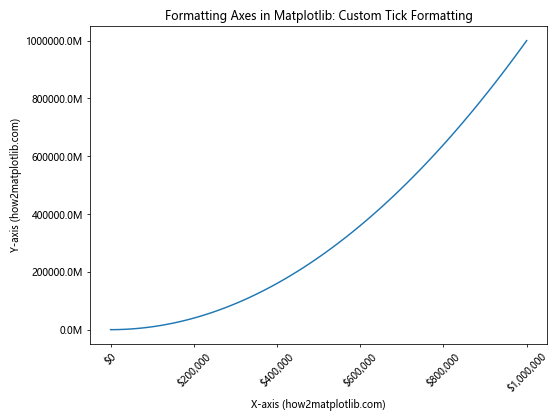
In this example, we create a custom currency formatter for the x-axis and format the y-axis labels in millions.
Styling Axis Spines
You can customize the appearance of axis spines to create unique visual effects:
import matplotlib.pyplot as plt
import numpy as np

x = np.linspace(-5, 5, 100)
y = x**2

fig, ax = plt.subplots(figsize=(8, 6))
ax.plot(x, y)

ax.set_xlabel('X-axis (how2matplotlib.com)')
ax.set_ylabel('Y-axis (how2matplotlib.com)')
ax.set_title('Formatting Axes in Matplotlib: Custom Spine Styling')

ax.spines['left'].set_position(('data', 0))
ax.spines['bottom'].set_position(('data', 0))
ax.spines['top'].set_visible(False)
ax.spines['right'].set_visible(False)

ax.spines['left'].set_color('red')
ax.spines['bottom'].set_color('red')
ax.spines['left'].set_linewidth(2)
ax.spines['bottom'].set_linewidth(2)

plt.show()
Output:
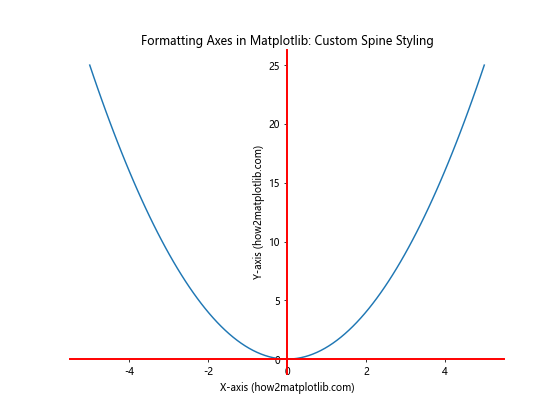
In this example, we move the left and bottom spines to the origin, hide the top and right spines, and customize the color and width of the visible spines.
Conclusion: Mastering the Art of Formatting Axes in Matplotlib
Formatting axes in Matplotlib is a crucial skill for creating effective and visually appealing data visualizations. Throughout this comprehensive guide, we’ve explored various techniques and best practices for formatting axes, from basic customization to advanced techniques.
By mastering these skills, you’ll be able to create professional-looking charts and graphs that effectively communicate your data. Remember to consider the following key points when formatting axes in Matplotlib:
- Choose appropriate axis labels and titles
- Customize tick marks and labels for clarity
- Adjust axis limits and scales to best represent your data
- Use grid lines and spines effectively
- Consider advanced techniques like broken axes or logarithmic scales when necessary
- Follow best practices for consistency and readability
- Troubleshoot common issues like overlapping labels or misaligned axes
With practice and experimentation, you’ll become proficient in formatting axes in Matplotlib, enabling you to create stunning and informative visualizations for a wide range of applications.