How to Create Stunning Visualizations of Quick Sort Using Matplotlib
Visualization of Quick sort using Matplotlib is an excellent way to understand and illustrate the inner workings of this efficient sorting algorithm. By leveraging the power of Matplotlib, we can create dynamic and informative visualizations that showcase each step of the Quick sort process. This article will delve deep into the various techniques and approaches for visualizing Quick sort using Matplotlib, providing you with a comprehensive understanding of both the algorithm and the visualization process.
Understanding Quick Sort for Effective Visualization of Quick Sort Using Matplotlib
Before we dive into the visualization techniques, it’s crucial to have a solid grasp of the Quick sort algorithm itself. Quick sort is a divide-and-conquer algorithm that works by selecting a ‘pivot’ element from the array and partitioning the other elements into two sub-arrays, according to whether they are less than or greater than the pivot. The sub-arrays are then sorted recursively.
Let’s start with a simple implementation of Quick sort in Python:
import matplotlib.pyplot as plt

def quicksort(arr, low, high):
    if low < high:
        pi = partition(arr, low, high)
        quicksort(arr, low, pi - 1)
        quicksort(arr, pi + 1, high)

def partition(arr, low, high):
    pivot = arr[high]
    i = low - 1
    for j in range(low, high):
        if arr[j] <= pivot:
            i += 1
            arr[i], arr[j] = arr[j], arr[i]
    arr[i + 1], arr[high] = arr[high], arr[i + 1]
    return i + 1

# Example usage
arr = [64, 34, 25, 12, 22, 11, 90]
quicksort(arr, 0, len(arr) - 1)
print("Sorted array:", arr)

plt.figure(figsize=(10, 6))
plt.bar(range(len(arr)), arr)
plt.title("Visualization of Quick sort using Matplotlib - how2matplotlib.com")
plt.xlabel("Index")
plt.ylabel("Value")
plt.show()
Output:
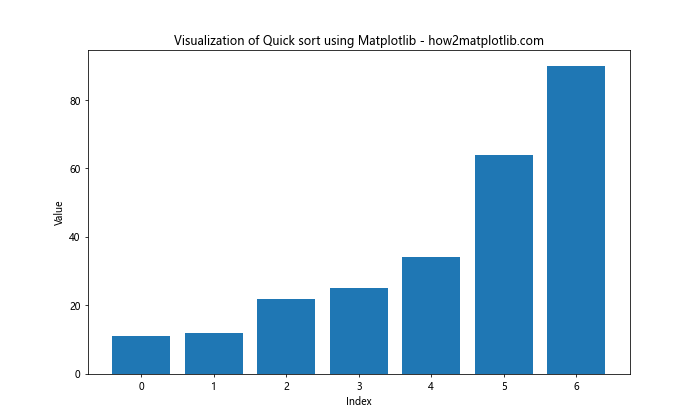
This code provides a basic implementation of Quick sort and a simple bar plot visualization of the sorted array. However, to truly understand the algorithm through visualization, we need to create more dynamic and step-by-step visualizations.
Setting Up the Environment for Visualization of Quick Sort Using Matplotlib
To create effective visualizations of Quick sort using Matplotlib, we need to set up our environment properly. First, ensure you have Matplotlib installed:
import sys
!{sys.executable} -m pip install matplotlib
Next, import the necessary libraries:
import matplotlib.pyplot as plt
import numpy as np
import time
Now that we have our environment set up, let's explore various techniques for visualizing Quick sort using Matplotlib.
Creating a Basic Bar Plot for Visualization of Quick Sort Using Matplotlib
A simple way to start visualizing Quick sort using Matplotlib is by creating a basic bar plot that updates after each partition step. Here's an example:
import matplotlib.pyplot as plt
import numpy as np

def quicksort_visualize(arr, low, high):
    if low < high:
        pi = partition_visualize(arr, low, high)
        quicksort_visualize(arr, low, pi - 1)
        quicksort_visualize(arr, pi + 1, high)

def partition_visualize(arr, low, high):
    pivot = arr[high]
    i = low - 1
    for j in range(low, high):
        if arr[j] <= pivot:
            i += 1
            arr[i], arr[j] = arr[j], arr[i]
    arr[i + 1], arr[high] = arr[high], arr[i + 1]

    # Visualization
    plt.clf()
    plt.bar(range(len(arr)), arr, color='skyblue')
    plt.title("Visualization of Quick sort using Matplotlib - how2matplotlib.com")
    plt.xlabel("Index")
    plt.ylabel("Value")
    plt.pause(0.5)

    return i + 1

# Example usage
arr = np.random.randint(1, 100, 20)
plt.figure(figsize=(12, 6))
quicksort_visualize(arr, 0, len(arr) - 1)
plt.show()
Output:
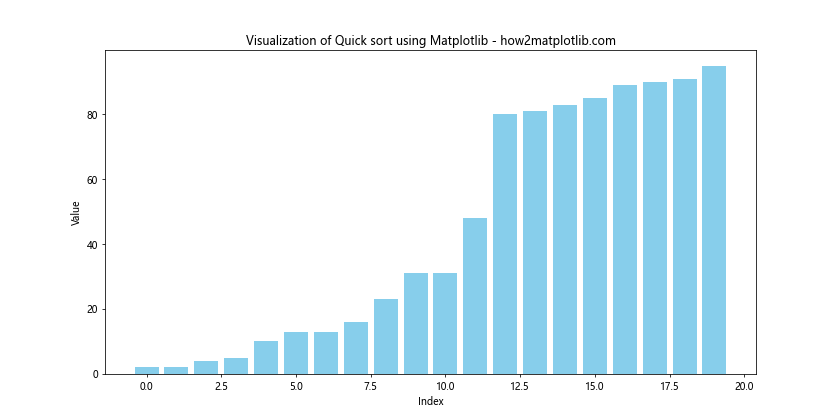
This code creates a bar plot that updates after each partition step, allowing you to see how the array is being sorted in real-time.
Enhancing Visualization of Quick Sort Using Matplotlib with Color Coding
To make our visualization of Quick sort using Matplotlib more informative, we can add color coding to highlight different parts of the array during the sorting process. Here's an example:
import matplotlib.pyplot as plt
import numpy as np

def quicksort_visualize_color(arr, low, high):
    if low < high:
        pi = partition_visualize_color(arr, low, high)
        quicksort_visualize_color(arr, low, pi - 1)
        quicksort_visualize_color(arr, pi + 1, high)

def partition_visualize_color(arr, low, high):
    pivot = arr[high]
    i = low - 1
    for j in range(low, high):
        if arr[j] <= pivot:
            i += 1
            arr[i], arr[j] = arr[j], arr[i]
    arr[i + 1], arr[high] = arr[high], arr[i + 1]

    # Visualization
    plt.clf()
    colors = ['skyblue' if x != pivot else 'red' for x in arr]
    colors[i+1] = 'green'
    plt.bar(range(len(arr)), arr, color=colors)
    plt.title("Color-coded Visualization of Quick sort using Matplotlib - how2matplotlib.com")
    plt.xlabel("Index")
    plt.ylabel("Value")
    plt.pause(0.5)

    return i + 1

# Example usage
arr = np.random.randint(1, 100, 20)
plt.figure(figsize=(12, 6))
quicksort_visualize_color(arr, 0, len(arr) - 1)
plt.show()
Output:
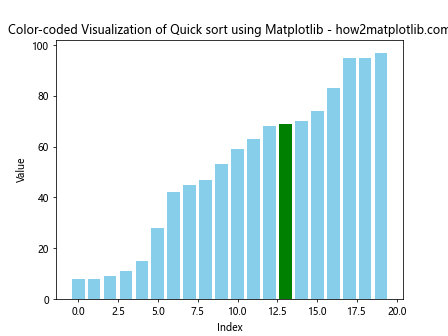
In this visualization, the pivot element is colored red, the partitioned element is colored green, and the rest of the elements are colored blue.
Implementing Step-by-Step Visualization of Quick Sort Using Matplotlib
To provide a more detailed view of the Quick sort process, we can implement a step-by-step visualization that shows each comparison and swap. Here's an example:
import matplotlib.pyplot as plt
import numpy as np

def quicksort_visualize_steps(arr, low, high):
    if low < high:
        pi = partition_visualize_steps(arr, low, high)
        quicksort_visualize_steps(arr, low, pi - 1)
        quicksort_visualize_steps(arr, pi + 1, high)

def partition_visualize_steps(arr, low, high):
    pivot = arr[high]
    i = low - 1
    for j in range(low, high):
        # Visualization of comparison
        plt.clf()
        colors = ['skyblue' if x != pivot else 'red' for x in arr]
        colors[j] = 'yellow'
        plt.bar(range(len(arr)), arr, color=colors)
        plt.title(f"Comparing {arr[j]} with pivot {pivot} - how2matplotlib.com")
        plt.xlabel("Index")
        plt.ylabel("Value")
        plt.pause(0.5)

        if arr[j] <= pivot:
            i += 1
            # Visualization of swap
            plt.clf()
            colors = ['skyblue' if x != pivot else 'red' for x in arr]
            colors[i], colors[j] = 'green', 'green'
            plt.bar(range(len(arr)), arr, color=colors)
            plt.title(f"Swapping {arr[i]} and {arr[j]} - how2matplotlib.com")
            plt.xlabel("Index")
            plt.ylabel("Value")
            plt.pause(0.5)

            arr[i], arr[j] = arr[j], arr[i]

    # Final swap with pivot
    arr[i + 1], arr[high] = arr[high], arr[i + 1]
    plt.clf()
    colors = ['skyblue' for _ in arr]
    colors[i+1], colors[high] = 'green', 'red'
    plt.bar(range(len(arr)), arr, color=colors)
    plt.title(f"Swapping pivot {pivot} to its correct position - how2matplotlib.com")
    plt.xlabel("Index")
    plt.ylabel("Value")
    plt.pause(0.5)

    return i + 1

# Example usage
arr = np.random.randint(1, 100, 15)
plt.figure(figsize=(12, 6))
quicksort_visualize_steps(arr, 0, len(arr) - 1)
plt.show()
Output:
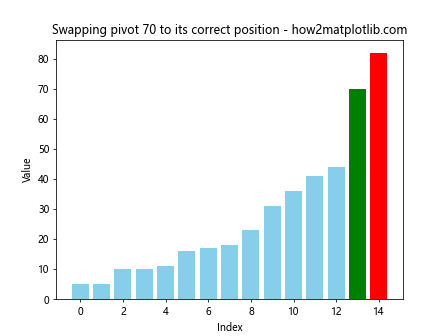
This visualization shows each comparison and swap, providing a detailed view of how Quick sort works.
Animating the Visualization of Quick Sort Using Matplotlib
To create a smoother visualization of Quick sort using Matplotlib, we can use animation. Here's an example using Matplotlib's animation module:
import matplotlib.pyplot as plt
import matplotlib.animation as animation
import numpy as np

def quicksort_animate(arr):
    fig, ax = plt.subplots(figsize=(12, 6))
    bar_rects = ax.bar(range(len(arr)), arr, align="edge")

    ax.set_xlim(0, len(arr))
    ax.set_ylim(0, int(1.1*max(arr)))

    text = ax.text(0.02, 0.95, "", transform=ax.transAxes)

    iteration = [0]

    def update_fig(arr, rects, iteration):
        for rect, val in zip(rects, arr):
            rect.set_height(val)
        iteration[0] += 1
        text.set_text(f"# of operations: {iteration[0]}")

    def quicksort(arr, low, high):
        if low < high:
            pi = partition(arr, low, high)
            yield from quicksort(arr, low, pi - 1)
            yield from quicksort(arr, pi + 1, high)

    def partition(arr, low, high):
        pivot = arr[high]
        i = low - 1
        for j in range(low, high):
            if arr[j] <= pivot:
                i += 1
                arr[i], arr[j] = arr[j], arr[i]
                yield arr
        arr[i + 1], arr[high] = arr[high], arr[i + 1]
        yield arr
        return i + 1

    anim = animation.FuncAnimation(fig, func=update_fig,
                                   fargs=(bar_rects, iteration),
                                   frames=quicksort(arr, 0, len(arr) - 1),
                                   interval=50,
                                   repeat=False)

    plt.title("Animated Visualization of Quick sort using Matplotlib - how2matplotlib.com")
    plt.xlabel("Index")
    plt.ylabel("Value")
    plt.show()

# Example usage
arr = np.random.randint(1, 100, 30)
quicksort_animate(arr)
This animation provides a smooth visualization of the Quick sort process, showing how the array is sorted over time.
Visualizing the Recursion Tree in Quick Sort Using Matplotlib
To better understand the recursive nature of Quick sort, we can visualize its recursion tree using Matplotlib. Here's an example:
import matplotlib.pyplot as plt
import numpy as np

class TreeNode:
    def __init__(self, data):
        self.data = data
        self.left = None
        self.right = None

def build_quicksort_tree(arr, low, high):
    if low < high:
        pivot = partition(arr, low, high)
        node = TreeNode(arr[pivot])
        node.left = build_quicksort_tree(arr, low, pivot - 1)
        node.right = build_quicksort_tree(arr, pivot + 1, high)
        return node
    return None

def partition(arr, low, high):
    pivot = arr[high]
    i = low - 1
    for j in range(low, high):
        if arr[j] <= pivot:
            i += 1
            arr[i], arr[j] = arr[j], arr[i]
    arr[i + 1], arr[high] = arr[high], arr[i + 1]
    return i + 1

def plot_tree(node, x, y, dx, dy):
    if node:
        plt.text(x, y, str(node.data), ha='center', va='center',
                 bbox=dict(facecolor='white', edgecolor='black'))
        if node.left:
            plt.plot([x, x-dx], [y-0.1, y-dy+0.1], 'k-')
            plot_tree(node.left, x-dx, y-dy, dx/2, dy)
        if node.right:
            plt.plot([x, x+dx], [y-0.1, y-dy+0.1], 'k-')
            plot_tree(node.right, x+dx, y-dy, dx/2, dy)

# Example usage
arr = np.random.randint(1, 100, 15)
root = build_quicksort_tree(arr.copy(), 0, len(arr) - 1)

plt.figure(figsize=(12, 8))
plot_tree(root, 0, 0, 1, 1)
plt.axis('off')
plt.title("Recursion Tree Visualization of Quick sort using Matplotlib - how2matplotlib.com")
plt.show()
Output:
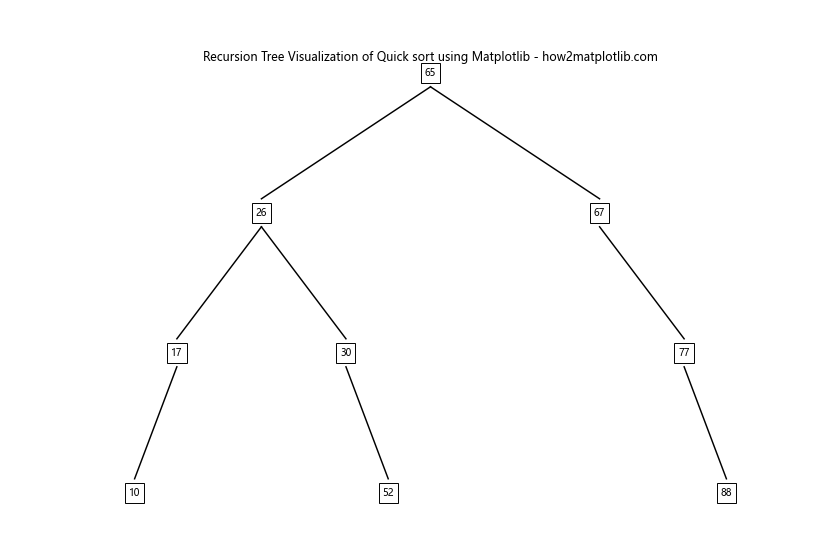
This visualization shows the recursion tree of Quick sort, helping to understand how the array is divided and conquered during the sorting process.
Comparing Different Pivot Selection Strategies in Visualization of Quick Sort Using Matplotlib
Quick sort's performance can vary depending on the pivot selection strategy. We can visualize these differences using Matplotlib. Here's an example comparing three common pivot selection strategies:
import matplotlib.pyplot as plt
import numpy as np

def quicksort_first_pivot(arr, low, high):
    if low < high:
        pi = partition_first(arr, low, high)
        quicksort_first_pivot(arr, low, pi - 1)
        quicksort_first_pivot(arr, pi + 1, high)

def partition_first(arr, low, high):
    pivot = arr[low]
    i = low + 1
    for j in range(low + 1, high + 1):
        if arr[j] < pivot:
            arr[i], arr[j] = arr[j], arr[i]
            i += 1
    arr[low], arr[i - 1] = arr[i - 1], arr[low]
    return i - 1

def quicksort_last_pivot(arr, low, high):
    if low < high:
        pi = partition_last(arr, low, high)
        quicksort_last_pivot(arr, low, pi - 1)
        quicksort_last_pivot(arr, pi + 1, high)

def partition_last(arr, low, high):
    pivot = arr[high]
    i = low - 1
    for j in range(low, high):
        if arr[j] <= pivot:
            i += 1
            arr[i], arr[j] = arr[j], arr[i]
    arr[i + 1], arr[high] = arr[high], arr[i + 1]
    return i + 1

defdef quicksort_random_pivot(arr, low, high):
    if low < high:
        pi = partition_random(arr, low, high)
        quicksort_random_pivot(arr, low, pi - 1)
        quicksort_random_pivot(arr, pi + 1, high)

def partition_random(arr, low, high):
    pivot_idx = np.random.randint(low, high + 1)
    arr[pivot_idx], arr[high] = arr[high], arr[pivot_idx]
    return partition_last(arr, low, high)

def compare_pivot_strategies(arr_size):
    arr = np.random.randint(1, 1000, arr_size)

    arr_first = arr.copy()
    arr_last = arr.copy()
    arr_random = arr.copy()

    plt.figure(figsize=(15, 5))

    # First element as pivot
    plt.subplot(131)
    quicksort_first_pivot(arr_first, 0, len(arr_first) - 1)
    plt.bar(range(len(arr_first)), arr_first)
    plt.title("First Element Pivot - how2matplotlib.com")
    plt.xlabel("Index")
    plt.ylabel("Value")

    # Last element as pivot
    plt.subplot(132)
    quicksort_last_pivot(arr_last, 0, len(arr_last) - 1)
    plt.bar(range(len(arr_last)), arr_last)
    plt.title("Last Element Pivot - how2matplotlib.com")
    plt.xlabel("Index")
    plt.ylabel("Value")

    # Random element as pivot
    plt.subplot(133)
    quicksort_random_pivot(arr_random, 0, len(arr_random) - 1)
    plt.bar(range(len(arr_random)), arr_random)
    plt.title("Random Element Pivot - how2matplotlib.com")
    plt.xlabel("Index")
    plt.ylabel("Value")

    plt.tight_layout()
    plt.suptitle("Comparison of Pivot Selection Strategies in Visualization of Quick sort using Matplotlib")
    plt.show()

# Example usage
compare_pivot_strategies(50)
This visualization compares the sorted arrays resulting from different pivot selection strategies, allowing us to see how the choice of pivot affects the final sorted order.
Visualizing the Distribution of Pivot Selections in Quick Sort Using Matplotlib
To better understand how different pivot selection strategies affect the sorting process, we can visualize the distribution of pivot selections. Here's an example:
import matplotlib.pyplot as plt
import numpy as np

def quicksort_with_pivot_tracking(arr, low, high, pivot_positions):
    if low < high:
        pi = partition_with_tracking(arr, low, high, pivot_positions)
        quicksort_with_pivot_tracking(arr, low, pi - 1, pivot_positions)
        quicksort_with_pivot_tracking(arr, pi + 1, high, pivot_positions)

def partition_with_tracking(arr, low, high, pivot_positions):
    pivot = arr[high]
    pivot_positions.append(high)
    i = low - 1
    for j in range(low, high):
        if arr[j] <= pivot:
            i += 1
            arr[i], arr[j] = arr[j], arr[i]
    arr[i + 1], arr[high] = arr[high], arr[i + 1]
    return i + 1

def visualize_pivot_distribution(arr_size):
    arr = np.random.randint(1, 1000, arr_size)
    pivot_positions = []

    quicksort_with_pivot_tracking(arr.copy(), 0, len(arr) - 1, pivot_positions)

    plt.figure(figsize=(12, 6))
    plt.hist(pivot_positions, bins=20, edgecolor='black')
    plt.title("Distribution of Pivot Selections in Visualization of Quick sort using Matplotlib - how2matplotlib.com")
    plt.xlabel("Array Index")
    plt.ylabel("Frequency of Selection as Pivot")
    plt.show()

# Example usage
visualize_pivot_distribution(1000)
This visualization shows the distribution of pivot selections across the array, helping to understand how the pivot selection strategy affects the sorting process.
Creating a Heatmap for Visualization of Quick Sort Using Matplotlib
We can create a heatmap to visualize how the array changes during the Quick sort process. This provides a different perspective on the sorting algorithm. Here's an example:
import matplotlib.pyplot as plt
import numpy as np

def quicksort_with_history(arr, low, high, history):
    if low < high:
        pi = partition_with_history(arr, low, high, history)
        quicksort_with_history(arr, low, pi - 1, history)
        quicksort_with_history(arr, pi + 1, high, history)

def partition_with_history(arr, low, high, history):
    pivot = arr[high]
    i = low - 1
    for j in range(low, high):
        if arr[j] <= pivot:
            i += 1
            arr[i], arr[j] = arr[j], arr[i]
            history.append(arr.copy())
    arr[i + 1], arr[high] = arr[high], arr[i + 1]
    history.append(arr.copy())
    return i + 1

def visualize_quicksort_heatmap(arr_size):
    arr = np.random.randint(1, 100, arr_size)
    history = [arr.copy()]

    quicksort_with_history(arr, 0, len(arr) - 1, history)

    plt.figure(figsize=(12, 8))
    plt.imshow(history, aspect='auto', cmap='viridis')
    plt.colorbar(label='Value')
    plt.title("Heatmap Visualization of Quick sort using Matplotlib - how2matplotlib.com")
    plt.xlabel("Array Index")
    plt.ylabel("Sorting Step")
    plt.show()

# Example usage
visualize_quicksort_heatmap(50)
This heatmap visualization shows how the array changes over time during the Quick sort process, with each row representing a step in the sorting algorithm.
Visualizing the Comparison Count in Quick Sort Using Matplotlib
To better understand the efficiency of Quick sort, we can visualize the number of comparisons made during the sorting process. Here's an example:
import matplotlib.pyplot as plt
import numpy as np

def quicksort_with_comparison_count(arr, low, high, comparisons):
    if low < high:
        pi = partition_with_comparison_count(arr, low, high, comparisons)
        quicksort_with_comparison_count(arr, low, pi - 1, comparisons)
        quicksort_with_comparison_count(arr, pi + 1, high, comparisons)

def partition_with_comparison_count(arr, low, high, comparisons):
    pivot = arr[high]
    i = low - 1
    for j in range(low, high):
        comparisons[0] += 1
        if arr[j] <= pivot:
            i += 1
            arr[i], arr[j] = arr[j], arr[i]
    arr[i + 1], arr[high] = arr[high], arr[i + 1]
    return i + 1

def visualize_comparison_count(max_size):
    sizes = range(10, max_size + 1, 10)
    avg_comparisons = []

    for size in sizes:
        total_comparisons = 0
        runs = 100

        for _ in range(runs):
            arr = np.random.randint(1, 1000, size)
            comparisons = [0]
            quicksort_with_comparison_count(arr, 0, len(arr) - 1, comparisons)
            total_comparisons += comparisons[0]

        avg_comparisons.append(total_comparisons / runs)

    plt.figure(figsize=(12, 6))
    plt.plot(sizes, avg_comparisons, marker='o')
    plt.title("Average Comparison Count in Visualization of Quick sort using Matplotlib - how2matplotlib.com")
    plt.xlabel("Array Size")
    plt.ylabel("Average Number of Comparisons")
    plt.grid(True)
    plt.show()

# Example usage
visualize_comparison_count(200)
This visualization shows how the number of comparisons in Quick sort grows with the size of the input array, helping to understand its time complexity.
Creating a 3D Visualization of Quick Sort Using Matplotlib
We can create a 3D visualization to show how the array changes over time during the Quick sort process. This provides a unique perspective on the algorithm. Here's an example:
import matplotlib.pyplot as plt
import numpy as np
from mpl_toolkits.mplot3d import Axes3D

def quicksort_3d(arr, low, high, history):
    if low < high:
        pi = partition_3d(arr, low, high, history)
        quicksort_3d(arr, low, pi - 1, history)
        quicksort_3d(arr, pi + 1, high, history)

def partition_3d(arr, low, high, history):
    pivot = arr[high]
    i = low - 1
    for j in range(low, high):
        if arr[j] <= pivot:
            i += 1
            arr[i], arr[j] = arr[j], arr[i]
            history.append(arr.copy())
    arr[i + 1], arr[high] = arr[high], arr[i + 1]
    history.append(arr.copy())
    return i + 1

def visualize_quicksort_3d(arr_size):
    arr = np.random.randint(1, 100, arr_size)
    history = [arr.copy()]

    quicksort_3d(arr, 0, len(arr) - 1, history)

    fig = plt.figure(figsize=(12, 8))
    ax = fig.add_subplot(111, projection='3d')

    X, Y = np.meshgrid(range(len(arr)), range(len(history)))
    Z = np.array(history)

    ax.plot_surface(X, Y, Z, cmap='viridis')
    ax.set_title("3D Visualization of Quick sort using Matplotlib - how2matplotlib.com")
    ax.set_xlabel("Array Index")
    ax.set_ylabel("Sorting Step")
    ax.set_zlabel("Value")

    plt.show()

# Example usage
visualize_quicksort_3d(30)
This 3D visualization provides a unique perspective on how the array changes during the Quick sort process, with the x-axis representing the array index, the y-axis representing the sorting steps, and the z-axis representing the values in the array.
Conclusion: Mastering Visualization of Quick Sort Using Matplotlib
Throughout this comprehensive guide, we've explored various techniques for visualizing Quick sort using Matplotlib. From basic bar plots to advanced 3D visualizations, we've covered a wide range of approaches to help you understand and illustrate the Quick sort algorithm.
By leveraging Matplotlib's powerful visualization capabilities, we've been able to create dynamic, informative, and visually appealing representations of Quick sort. These visualizations not only help in understanding the algorithm but also provide valuable insights into its performance and behavior.
Some key takeaways from our exploration of visualization of Quick sort using Matplotlib include:
- The importance of step-by-step visualization in understanding the algorithm's process.
- The impact of different pivot selection strategies on the sorting process.
- The use of color coding to highlight important elements during sorting.
- The value of animated visualizations in showing the dynamic nature of Quick sort.
- The insights gained from visualizing comparison counts and pivot distributions.
- The unique perspectives provided by heatmaps and 3D visualizations.