Comprehensive Guide to Matplotlib.axis.Axis.set_view_interval() Function in Python
Matplotlib.axis.Axis.set_view_interval() function in Python is a powerful tool for customizing the view of your plots. This function is an essential part of the Matplotlib library, which is widely used for creating static, animated, and interactive visualizations in Python. In this comprehensive guide, we’ll explore the Matplotlib.axis.Axis.set_view_interval() function in depth, covering its usage, parameters, and various applications in data visualization.
Understanding the Matplotlib.axis.Axis.set_view_interval() Function
The Matplotlib.axis.Axis.set_view_interval() function is used to set the view limits of an axis. It allows you to specify the range of values that should be visible on the axis, regardless of the actual data range. This function is particularly useful when you want to focus on a specific portion of your data or maintain consistent axis limits across multiple plots.
Basic Syntax of Matplotlib.axis.Axis.set_view_interval()
The basic syntax of the Matplotlib.axis.Axis.set_view_interval() function is as follows:
axis.set_view_interval(vmin, vmax, ignore=False)
Let’s break down the parameters:
vmin: The minimum value of the view interval.vmax: The maximum value of the view interval.ignore: A boolean value that determines whether to ignore existing limits. If set to True, the function will override any existing view limits.
Now, let’s dive into some examples to better understand how to use the Matplotlib.axis.Axis.set_view_interval() function.
Example 1: Basic Usage of Matplotlib.axis.Axis.set_view_interval()
In this example, we’ll create a simple line plot and use the Matplotlib.axis.Axis.set_view_interval() function to set custom view limits for the x-axis.
import matplotlib.pyplot as plt
import numpy as np

# Create data for the plot
x = np.linspace(0, 10, 100)
y = np.sin(x)

# Create the plot
fig, ax = plt.subplots()
ax.plot(x, y, label='how2matplotlib.com')

# Set custom view interval for x-axis
ax.xaxis.set_view_interval(2, 8)

ax.set_title('Using Matplotlib.axis.Axis.set_view_interval()')
ax.legend()
plt.show()
Output:
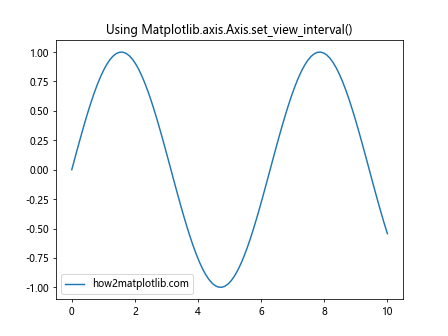
In this example, we create a simple sine wave plot using Matplotlib. After creating the plot, we use the Matplotlib.axis.Axis.set_view_interval() function to set the x-axis view limits from 2 to 8. This means that only the portion of the plot between x=2 and x=8 will be visible, regardless of the actual data range.
Example 2: Setting View Intervals for Both Axes
Now, let’s explore how to use the Matplotlib.axis.Axis.set_view_interval() function to set custom view limits for both the x-axis and y-axis.
import matplotlib.pyplot as plt
import numpy as np

# Create data for the plot
x = np.linspace(0, 10, 100)
y = np.sin(x)

# Create the plot
fig, ax = plt.subplots()
ax.plot(x, y, label='how2matplotlib.com')

# Set custom view interval for x-axis
ax.xaxis.set_view_interval(2, 8)

# Set custom view interval for y-axis
ax.yaxis.set_view_interval(-0.5, 0.5)

ax.set_title('Setting View Intervals for Both Axes')
ax.legend()
plt.show()
Output:
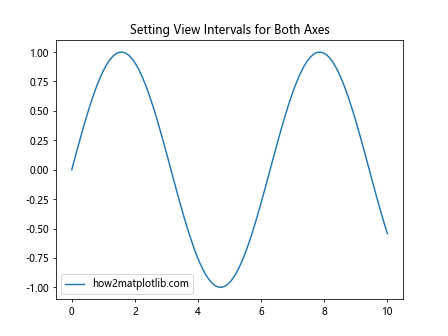
In this example, we use the Matplotlib.axis.Axis.set_view_interval() function twice: once for the x-axis and once for the y-axis. We set the x-axis view limits from 2 to 8 and the y-axis view limits from -0.5 to 0.5. This results in a plot that focuses on a specific region of the sine wave.
Using Matplotlib.axis.Axis.set_view_interval() with Different Plot Types
The Matplotlib.axis.Axis.set_view_interval() function can be used with various types of plots. Let’s explore how to use it with different plot types.
Example 3: Bar Plot with Custom View Interval
In this example, we’ll create a bar plot and use the Matplotlib.axis.Axis.set_view_interval() function to focus on a specific range of bars.
import matplotlib.pyplot as plt
import numpy as np

# Create data for the bar plot
categories = ['A', 'B', 'C', 'D', 'E']
values = [3, 7, 2, 5, 8]

# Create the bar plot
fig, ax = plt.subplots()
ax.bar(categories, values)

# Set custom view interval for y-axis
ax.yaxis.set_view_interval(0, 6)

ax.set_title('Bar Plot with Custom View Interval')
ax.set_xlabel('Categories')
ax.set_ylabel('Values')
plt.text(0.5, 0.5, 'how2matplotlib.com', transform=ax.transAxes, ha='center')
plt.show()
Output:
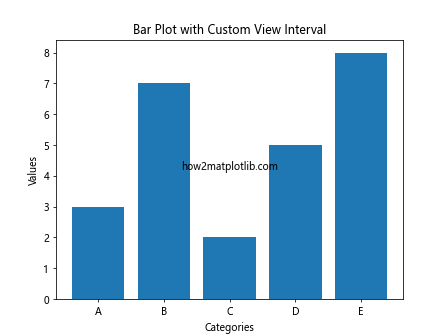
In this example, we create a bar plot with five categories. We then use the Matplotlib.axis.Axis.set_view_interval() function to set the y-axis view limits from 0 to 6. This focuses the plot on the lower range of values, effectively “zooming in” on the shorter bars.
Example 4: Scatter Plot with Custom View Interval
Now, let’s see how to use the Matplotlib.axis.Axis.set_view_interval() function with a scatter plot.
import matplotlib.pyplot as plt
import numpy as np

# Create data for the scatter plot
x = np.random.rand(50)
y = np.random.rand(50)

# Create the scatter plot
fig, ax = plt.subplots()
ax.scatter(x, y, alpha=0.5)

# Set custom view interval for both axes
ax.xaxis.set_view_interval(0.2, 0.8)
ax.yaxis.set_view_interval(0.3, 0.7)

ax.set_title('Scatter Plot with Custom View Interval')
ax.set_xlabel('X-axis')
ax.set_ylabel('Y-axis')
plt.text(0.5, 0.5, 'how2matplotlib.com', transform=ax.transAxes, ha='center')
plt.show()
Output:
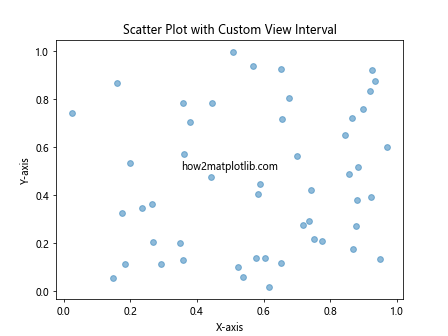
In this scatter plot example, we generate random data points and then use the Matplotlib.axis.Axis.set_view_interval() function to set custom view limits for both the x-axis and y-axis. This effectively zooms in on a specific region of the scatter plot, allowing us to focus on a subset of the data points.
Advanced Usage of Matplotlib.axis.Axis.set_view_interval()
Now that we’ve covered the basics, let’s explore some more advanced uses of the Matplotlib.axis.Axis.set_view_interval() function.
Example 5: Dynamic View Interval Based on Data
In this example, we’ll demonstrate how to set the view interval dynamically based on the data.
import matplotlib.pyplot as plt
import numpy as np

# Create data
x = np.linspace(0, 10, 100)
y = np.sin(x) * np.exp(-x/10)

# Create the plot
fig, ax = plt.subplots()
ax.plot(x, y, label='how2matplotlib.com')

# Calculate the range of y values
y_min, y_max = np.min(y), np.max(y)

# Set custom view interval for y-axis
margin = 0.1 * (y_max - y_min)
ax.yaxis.set_view_interval(y_min - margin, y_max + margin)

ax.set_title('Dynamic View Interval Based on Data')
ax.legend()
plt.show()
Output:
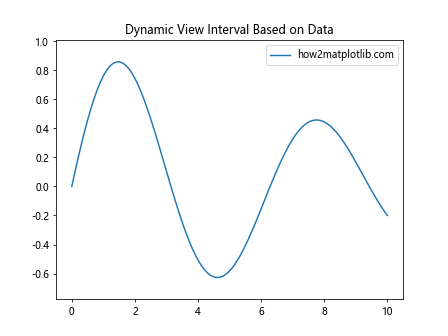
In this example, we create a plot of a damped sine wave. We then calculate the minimum and maximum y values and use these to set a dynamic view interval for the y-axis. We add a small margin (10% of the data range) to ensure that all data points are visible.
Example 6: Using set_view_interval() with Subplots
The Matplotlib.axis.Axis.set_view_interval() function can also be used with subplots. Here’s an example:
import matplotlib.pyplot as plt
import numpy as np

# Create data
x = np.linspace(0, 10, 100)
y1 = np.sin(x)
y2 = np.cos(x)

# Create subplots
fig, (ax1, ax2) = plt.subplots(2, 1, figsize=(8, 8))

# Plot data
ax1.plot(x, y1, label='Sin')
ax2.plot(x, y2, label='Cos')

# Set custom view intervals
ax1.xaxis.set_view_interval(2, 8)
ax2.xaxis.set_view_interval(2, 8)

ax1.set_title('Sine Wave')
ax2.set_title('Cosine Wave')
ax1.legend()
ax2.legend()

plt.tight_layout()
plt.text(0.5, 0.5, 'how2matplotlib.com', transform=fig.transFigure, ha='center')
plt.show()
Output:
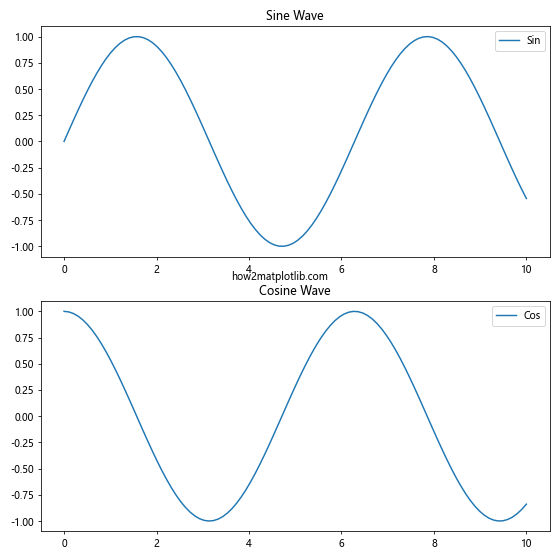
In this example, we create two subplots showing sine and cosine waves. We use the Matplotlib.axis.Axis.set_view_interval() function to set the same x-axis view limits (from 2 to 8) for both subplots, ensuring that they display the same range of x values.
Combining Matplotlib.axis.Axis.set_view_interval() with Other Axis Functions
The Matplotlib.axis.Axis.set_view_interval() function can be used in combination with other axis functions to achieve more complex customizations.
Example 7: Combining set_view_interval() with set_ticks()
In this example, we’ll combine the Matplotlib.axis.Axis.set_view_interval() function with the set_ticks() function to create custom tick locations within the view interval.
import matplotlib.pyplot as plt
import numpy as np

# Create data
x = np.linspace(0, 10, 100)
y = np.sin(x)

# Create the plot
fig, ax = plt.subplots()
ax.plot(x, y, label='how2matplotlib.com')

# Set custom view interval
ax.xaxis.set_view_interval(2, 8)

# Set custom ticks within the view interval
ax.set_xticks(np.arange(2, 9, 1))

ax.set_title('Combining set_view_interval() with set_ticks()')
ax.legend()
plt.show()
Output:
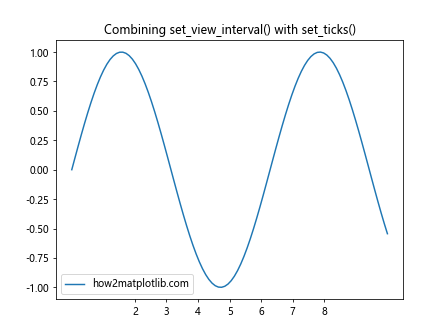
In this example, we first set the x-axis view interval from 2 to 8 using the Matplotlib.axis.Axis.set_view_interval() function. We then use the set_xticks() function to create custom tick locations at integer values within this interval.
Example 8: Using set_view_interval() with log scale
The Matplotlib.axis.Axis.set_view_interval() function can also be used with logarithmic scales. Here’s an example:
import matplotlib.pyplot as plt
import numpy as np

# Create data
x = np.logspace(0, 3, 100)
y = np.log10(x)

# Create the plot
fig, ax = plt.subplots()
ax.semilogx(x, y, label='how2matplotlib.com')

# Set custom view interval for x-axis (in log scale)
ax.xaxis.set_view_interval(10, 500)

ax.set_title('Using set_view_interval() with log scale')
ax.legend()
plt.show()
Output:
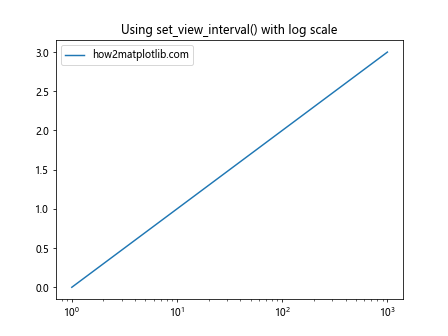
In this example, we create a semilog plot (logarithmic x-axis, linear y-axis). We then use the Matplotlib.axis.Axis.set_view_interval() function to set the x-axis view limits from 10 to 500. Note that these limits are applied in the logarithmic scale.
Handling Edge Cases with Matplotlib.axis.Axis.set_view_interval()
When using the Matplotlib.axis.Axis.set_view_interval() function, it’s important to be aware of potential edge cases and how to handle them.
Example 9: Handling Invalid Intervals
Let’s see what happens when we try to set an invalid interval (where the minimum is greater than the maximum):
import matplotlib.pyplot as plt
import numpy as np

# Create data
x = np.linspace(0, 10, 100)
y = np.sin(x)

# Create the plot
fig, ax = plt.subplots()
ax.plot(x, y, label='how2matplotlib.com')

# Try to set an invalid view interval
ax.xaxis.set_view_interval(8, 2)

ax.set_title('Handling Invalid Intervals')
ax.legend()
plt.show()
Output:
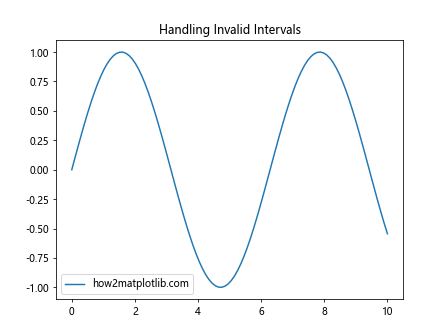
In this example, we attempt to set an invalid view interval where the minimum (8) is greater than the maximum (2). Matplotlib will handle this gracefully by automatically swapping the values, resulting in a valid interval from 2 to 8.
Example 10: Using set_view_interval() with Empty Data
Let’s see how the Matplotlib.axis.Axis.set_view_interval() function behaves when we have an empty dataset:
import matplotlib.pyplot as plt

# Create an empty plot
fig, ax = plt.subplots()

# Set custom view interval for both axes
ax.xaxis.set_view_interval(0, 10)
ax.yaxis.set_view_interval(-1, 1)

ax.set_title('Using set_view_interval() with Empty Data')
plt.text(0.5, 0.5, 'how2matplotlib.com', transform=ax.transAxes, ha='center')
plt.show()
Output:
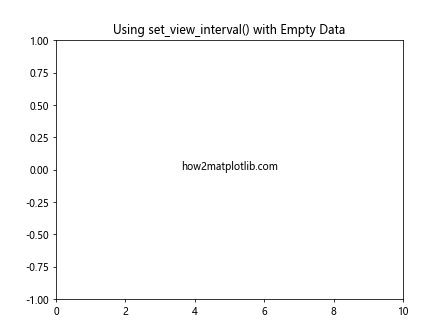
In this example, we create an empty plot and use the Matplotlib.axis.Axis.set_view_interval() function to set custom view intervals for both axes. This demonstrates that the function works even when there’s no data, allowing you to set up the plot area before adding any data points.
Practical Applications of Matplotlib.axis.Axis.set_view_interval()
Now that we’ve covered various aspects of the Matplotlib.axis.Axis.set_view_interval() function, let’s explore some practical applications where this function can be particularly useful.
Example 11: Comparing Multiple Datasets
The Matplotlib.axis.Axis.set_view_interval() function can be very useful when comparing multiple datasets with different ranges:
import matplotlib.pyplot as plt
import numpy as np

# Create data
x = np.linspace(0, 10, 100)
y1 = np.sin(x)
y2 = 10 * np.sin(x)

# Create the plot
fig, (ax1, ax2) = plt.subplots(2, 1, figsize=(8, 8))

# Plot data
ax1.plot(x, y1, label='Dataset 1')
ax2.plot(x, y2, label='Dataset 2')

# Set same view interval for both y-axes
y_min = min(np.min(y1), np.min(y2))
y_max = max(np.max(y1), np.max(y2))
ax1.yaxis.set_view_interval(y_min, y_max)
ax2.yaxis.set_view_interval(y_min, y_max)

ax1.set_title('Dataset 1')
ax2.set_title('Dataset 2')
ax1.legend()
ax2.legend()

plt.tight_layout()
plt.text(0.5, 0.5, 'how2matplotlib.com', transform=fig.transFigure, ha='center')
plt.show()
Output:
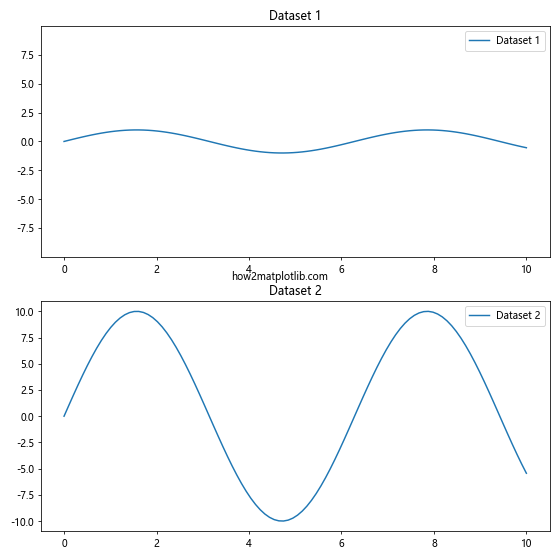
In this example, we have two datasets with different scales. By using the Matplotlib.axis.Axis.set_view_interval() function to set the same y-axis limits for both plots, we can easilycompare the shapes of the two datasets, even though their magnitudes are different.
Example 12: Creating a Sliding Window View
The Matplotlib.axis.Axis.set_view_interval() function can be used to create a sliding window effect, which is useful for visualizing time series data:
import matplotlib.pyplot as plt
import numpy as np

# Create data
x = np.linspace(0, 100, 1000)
y = np.sin(x) + np.random.normal(0, 0.1, 1000)

# Create the plot
fig, ax = plt.subplots()
line, = ax.plot(x, y)

# Function to update the view
def update_view(event):
    if event.key == 'right':
        current_xlim = ax.get_xlim()
        ax.xaxis.set_view_interval(current_xlim[0] + 5, current_xlim[1] + 5)
    elif event.key == 'left':
        current_xlim = ax.get_xlim()
        ax.xaxis.set_view_interval(current_xlim[0] - 5, current_xlim[1] - 5)
    fig.canvas.draw()

# Set initial view
ax.xaxis.set_view_interval(0, 20)

ax.set_title('Sliding Window View')
plt.text(0.5, 0.5, 'how2matplotlib.com', transform=ax.transAxes, ha='center')

# Connect the key press event to the update function
fig.canvas.mpl_connect('key_press_event', update_view)

plt.show()
Output:
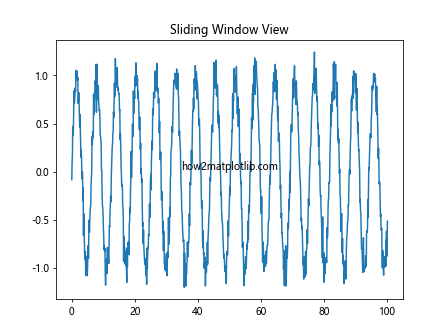
In this interactive example, we create a long time series and use the Matplotlib.axis.Axis.set_view_interval() function to show only a portion of it at a time. The left and right arrow keys can be used to slide the view window along the time series.
Advanced Techniques with Matplotlib.axis.Axis.set_view_interval()
Let’s explore some more advanced techniques using the Matplotlib.axis.Axis.set_view_interval() function.
Example 13: Animating View Changes
We can use the Matplotlib.axis.Axis.set_view_interval() function in combination with animation to create dynamic visualizations:
import matplotlib.pyplot as plt
import numpy as np
from matplotlib.animation import FuncAnimation

# Create data
x = np.linspace(0, 10, 1000)
y = np.sin(x)

# Create the plot
fig, ax = plt.subplots()
line, = ax.plot(x, y)

# Animation update function
def update(frame):
    ax.xaxis.set_view_interval(frame, frame + 2)
    return line,

# Create animation
ani = FuncAnimation(fig, update, frames=np.linspace(0, 8, 100),
                    blit=True, interval=50)

ax.set_title('Animating View Changes')
plt.text(0.5, 0.5, 'how2matplotlib.com', transform=ax.transAxes, ha='center')

plt.show()
Output:
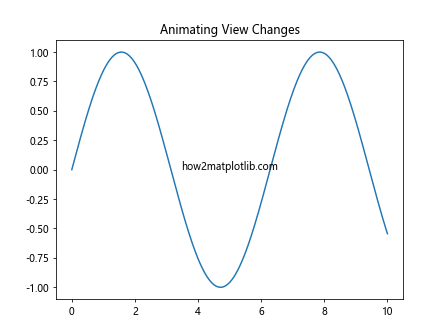
In this example, we create an animation that uses the Matplotlib.axis.Axis.set_view_interval() function to continuously update the x-axis view, creating a “moving window” effect over the sine wave.
Example 14: Synchronizing Multiple Axes
The Matplotlib.axis.Axis.set_view_interval() function can be used to synchronize the views of multiple axes:
import matplotlib.pyplot as plt
import numpy as np

# Create data
x = np.linspace(0, 10, 100)
y1 = np.sin(x)
y2 = np.cos(x)

# Create the plot with two y-axes
fig, ax1 = plt.subplots()
ax2 = ax1.twinx()

# Plot data
ax1.plot(x, y1, 'b-', label='Sin')
ax2.plot(x, y2, 'r-', label='Cos')

# Function to update both axes
def update_views(event):
    if event.key == 'right':
        current_xlim = ax1.get_xlim()
        new_xlim = (current_xlim[0] + 1, current_xlim[1] + 1)
    elif event.key == 'left':
        current_xlim = ax1.get_xlim()
        new_xlim = (current_xlim[0] - 1, current_xlim[1] - 1)
    else:
        return
    ax1.xaxis.set_view_interval(new_xlim[0], new_xlim[1])
    ax2.xaxis.set_view_interval(new_xlim[0], new_xlim[1])
    fig.canvas.draw()

# Set initial view
ax1.xaxis.set_view_interval(0, 5)
ax2.xaxis.set_view_interval(0, 5)

ax1.set_title('Synchronizing Multiple Axes')
ax1.set_ylabel('Sin', color='b')
ax2.set_ylabel('Cos', color='r')
plt.text(0.5, 0.5, 'how2matplotlib.com', transform=ax1.transAxes, ha='center')

# Connect the key press event to the update function
fig.canvas.mpl_connect('key_press_event', update_views)

plt.show()
Output:
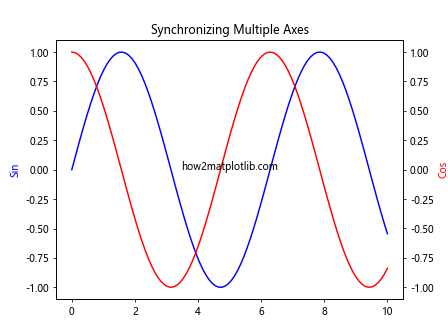
In this interactive example, we create a plot with two y-axes and use the Matplotlib.axis.Axis.set_view_interval() function to keep their x-axes synchronized as we navigate through the plot using the left and right arrow keys.
Best Practices for Using Matplotlib.axis.Axis.set_view_interval()
When working with the Matplotlib.axis.Axis.set_view_interval() function, there are several best practices to keep in mind:
- Always ensure that the minimum value is less than the maximum value when setting the view interval.
- Be mindful of the data range when setting view intervals. Setting intervals that are too narrow or too wide can distort the perception of the data.
- When using the function with logarithmic scales, remember that the interval values are in the original scale, not the log scale.
- Consider using dynamic view intervals based on the data range to ensure that all data points are visible.
- When comparing multiple datasets or subplots, use consistent view intervals to facilitate accurate comparisons.
Example 15: Implementing Best Practices
Let’s create an example that implements these best practices:
import matplotlib.pyplot as plt
import numpy as np

# Create data
x = np.linspace(0, 10, 100)
y1 = np.exp(x/10)
y2 = np.log(x+1)

# Create the plot
fig, (ax1, ax2) = plt.subplots(2, 1, figsize=(8, 8))

# Plot data
ax1.plot(x, y1, label='Exponential')
ax2.plot(x, y2, label='Logarithmic')

# Set view intervals based on data range
margin = 0.1

x_min, x_max = np.min(x), np.max(x)
x_range = x_max - x_min
ax1.xaxis.set_view_interval(x_min - margin*x_range, x_max + margin*x_range)
ax2.xaxis.set_view_interval(x_min - margin*x_range, x_max + margin*x_range)

y1_min, y1_max = np.min(y1), np.max(y1)
y1_range = y1_max - y1_min
ax1.yaxis.set_view_interval(y1_min - margin*y1_range, y1_max + margin*y1_range)

y2_min, y2_max = np.min(y2), np.max(y2)
y2_range = y2_max - y2_min
ax2.yaxis.set_view_interval(y2_min - margin*y2_range, y2_max + margin*y2_range)

ax1.set_title('Exponential Function')
ax2.set_title('Logarithmic Function')
ax1.legend()
ax2.legend()

plt.tight_layout()
plt.text(0.5, 0.5, 'how2matplotlib.com', transform=fig.transFigure, ha='center')
plt.show()
Output:
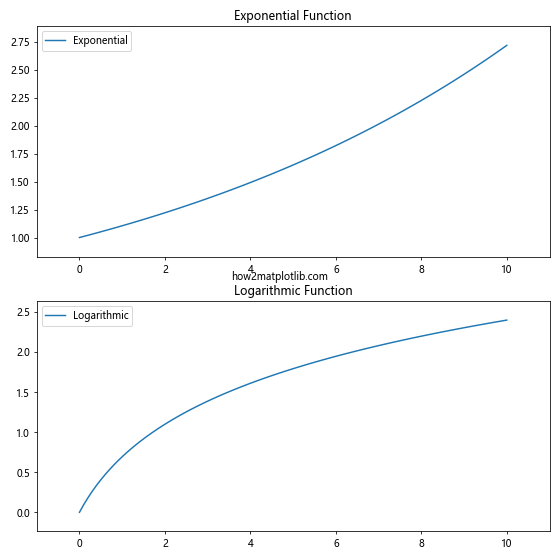
In this example, we implement several best practices:
- We calculate the data range for each axis and use it to set appropriate view intervals.
- We add a small margin to ensure all data points are visible.
- We use consistent x-axis view intervals for both subplots to facilitate comparison.
- We set different y-axis view intervals for each subplot to best display the different ranges of the exponential and logarithmic functions.
Troubleshooting Common Issues with Matplotlib.axis.Axis.set_view_interval()
When using the Matplotlib.axis.Axis.set_view_interval() function, you might encounter some common issues. Let’s address a few of these and how to resolve them.
Example 16: Dealing with Autoscaling
Sometimes, autoscaling can interfere with the view intervals you set. Here’s how to handle this:
import matplotlib.pyplot as plt
import numpy as np

# Create data
x = np.linspace(0, 10, 100)
y = np.sin(x)

# Create the plot
fig, (ax1, ax2) = plt.subplots(1, 2, figsize=(12, 5))

# Plot data and set view interval (with autoscaling on)
ax1.plot(x, y)
ax1.xaxis.set_view_interval(2, 8)
ax1.set_title('With Autoscaling')

# Plot data and set view interval (with autoscaling off)
ax2.plot(x, y)
ax2.set_autoscale_on(False)
ax2.xaxis.set_view_interval(2, 8)
ax2.set_title('Without Autoscaling')

plt.text(0.5, 0.5, 'how2matplotlib.com', transform=fig.transFigure, ha='center')
plt.tight_layout()
plt.show()
Output:
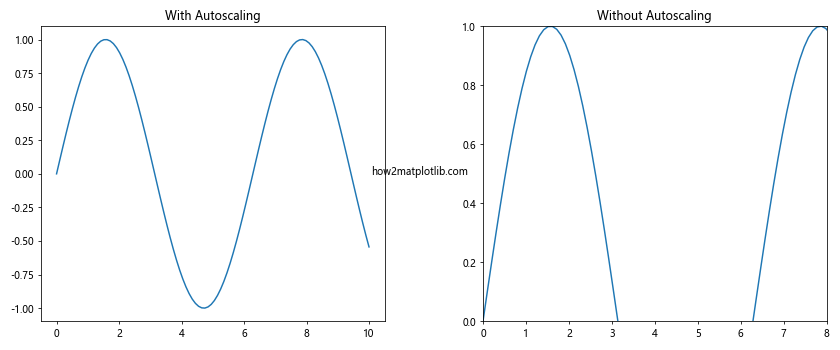
In this example, we demonstrate how autoscaling can override the view interval we set. By turning off autoscaling before setting the view interval, we ensure that our specified interval is respected.
Example 17: Handling Data Outside the View Interval
When setting a view interval that excludes some of your data, it’s important to consider how this affects the interpretation of your plot:
import matplotlib.pyplot as plt
import numpy as np

# Create data
x = np.linspace(0, 10, 100)
y = np.sin(x)

# Create the plot
fig, (ax1, ax2) = plt.subplots(1, 2, figsize=(12, 5))

# Plot all data
ax1.plot(x, y)
ax1.set_title('Full Data Range')

# Plot with limited view interval
ax2.plot(x, y)
ax2.xaxis.set_view_interval(2, 8)
ax2.yaxis.set_view_interval(-0.5, 0.5)
ax2.set_title('Limited View Interval')

plt.text(0.5, 0.5, 'how2matplotlib.com', transform=fig.transFigure, ha='center')
plt.tight_layout()
plt.show()
Output:
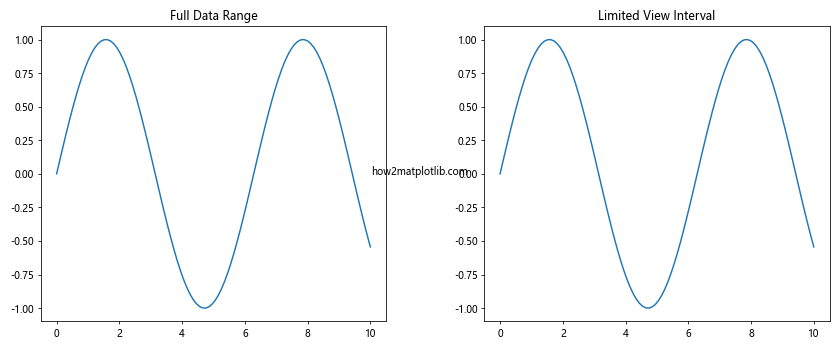
In this example, we show how setting a limited view interval can change the perception of the data. It’s important to clearly communicate when you’re showing only a portion of the data to avoid misinterpretation.
Conclusion
The Matplotlib.axis.Axis.set_view_interval() function is a powerful tool for customizing the view of your plots in Python. Throughout this comprehensive guide, we’ve explored its basic usage, advanced techniques, best practices, and common issues.
We’ve seen how this function can be used to focus on specific portions of data, create consistent views across multiple plots, and even create dynamic, interactive visualizations. We’ve also discussed important considerations such as handling different plot types, working with logarithmic scales, and dealing with autoscaling.