Comprehensive Guide to Matplotlib.axis.Axis.set_ticks() Function in Python
Matplotlib.axis.Axis.set_ticks() function in Python is a powerful tool for customizing the tick locations on your plot axes. This function allows you to precisely control where the ticks appear, enhancing the readability and aesthetics of your visualizations. In this comprehensive guide, we’ll explore the Matplotlib.axis.Axis.set_ticks() function in depth, covering its usage, parameters, and various applications with practical examples.
Understanding the Matplotlib.axis.Axis.set_ticks() Function
The Matplotlib.axis.Axis.set_ticks() function is a method of the Axis class in Matplotlib. It’s used to set the locations of the ticks on an axis. Ticks are the small marks on the axis that denote specific values. By using set_ticks(), you can override the default tick locations and specify exactly where you want the ticks to appear.
Let’s start with a basic example to illustrate how to use the Matplotlib.axis.Axis.set_ticks() function:
import matplotlib.pyplot as plt
import numpy as np

# Create some sample data
x = np.linspace(0, 10, 100)
y = np.sin(x)

# Create the plot
plt.figure(figsize=(10, 6))
plt.plot(x, y)

# Set custom tick locations on the x-axis
plt.gca().xaxis.set_ticks([0, 2, 4, 6, 8, 10])

plt.title('How to use Matplotlib.axis.Axis.set_ticks() - how2matplotlib.com')
plt.xlabel('X-axis')
plt.ylabel('Y-axis')
plt.grid(True)
plt.show()
Output:
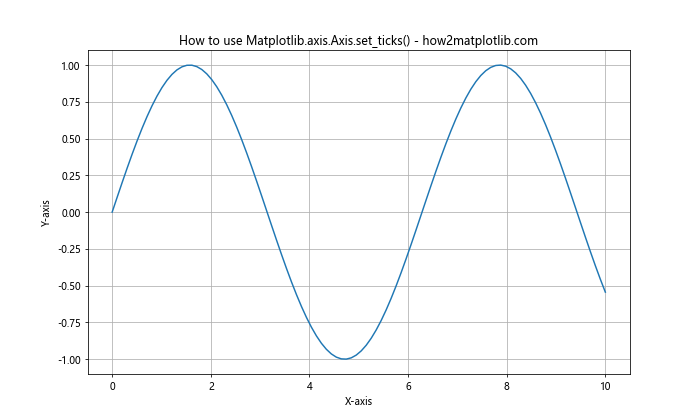
In this example, we’re using set_ticks() to set custom tick locations on the x-axis. The ticks will appear at 0, 2, 4, 6, 8, and 10. This gives us more control over how our plot is presented.
Parameters of Matplotlib.axis.Axis.set_ticks()
The Matplotlib.axis.Axis.set_ticks() function accepts several parameters:
- ticks: This is the primary parameter, which is a list or array of tick locations.
- minor: A boolean value that, if True, sets the ticks for the minor ticks.
- **kwargs: Additional keyword arguments passed to Axis.set_ticks_params().
Let’s look at an example that demonstrates the use of these parameters:
import matplotlib.pyplot as plt
import numpy as np

# Create some sample data
x = np.linspace(0, 10, 100)
y = np.cos(x)

# Create the plot
plt.figure(figsize=(12, 6))
plt.plot(x, y)

# Set major ticks
plt.gca().xaxis.set_ticks(np.arange(0, 11, 2))

# Set minor ticks
plt.gca().xaxis.set_ticks(np.arange(1, 10, 2), minor=True)

plt.title('Major and Minor Ticks with Matplotlib.axis.Axis.set_ticks() - how2matplotlib.com')
plt.xlabel('X-axis')
plt.ylabel('Y-axis')
plt.grid(True)
plt.show()
Output:
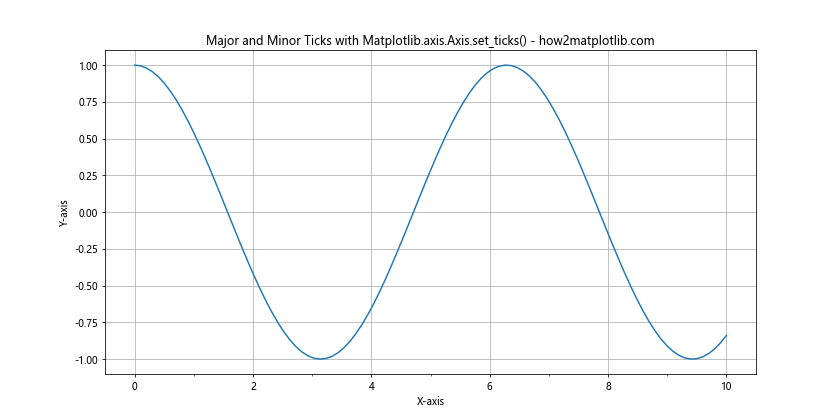
In this example, we’re setting both major and minor ticks using set_ticks(). The major ticks are set at even numbers from 0 to 10, while the minor ticks are set at odd numbers from 1 to 9.
Using Matplotlib.axis.Axis.set_ticks() with Different Plot Types
The Matplotlib.axis.Axis.set_ticks() function can be used with various types of plots. Let’s explore how to use it with different plot types.
Bar Plot
import matplotlib.pyplot as plt
import numpy as np

categories = ['A', 'B', 'C', 'D', 'E']
values = [23, 45, 56, 78, 32]

plt.figure(figsize=(10, 6))
plt.bar(categories, values)

# Set custom tick locations
plt.gca().yaxis.set_ticks(np.arange(0, 81, 20))

plt.title('Bar Plot with Custom Y-axis Ticks - how2matplotlib.com')
plt.xlabel('Categories')
plt.ylabel('Values')
plt.show()
Output:
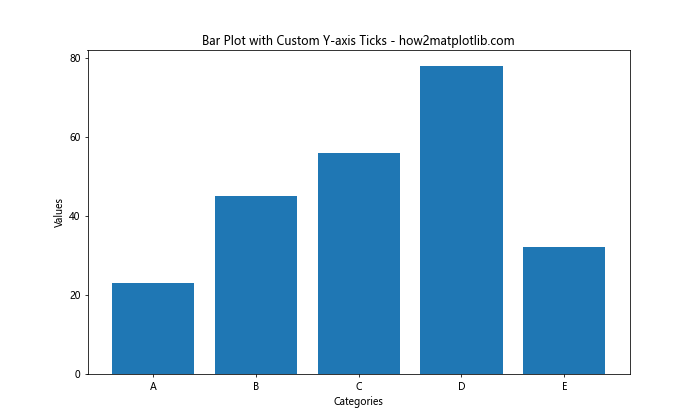
In this bar plot example, we’re using set_ticks() to set custom tick locations on the y-axis, creating a more readable scale for our data.
Scatter Plot
import matplotlib.pyplot as plt
import numpy as np

x = np.random.rand(50) * 10
y = np.random.rand(50) * 100

plt.figure(figsize=(10, 6))
plt.scatter(x, y)

# Set custom tick locations for both axes
plt.gca().xaxis.set_ticks(np.arange(0, 11, 2))
plt.gca().yaxis.set_ticks(np.arange(0, 101, 25))

plt.title('Scatter Plot with Custom Ticks - how2matplotlib.com')
plt.xlabel('X-axis')
plt.ylabel('Y-axis')
plt.grid(True)
plt.show()
Output:
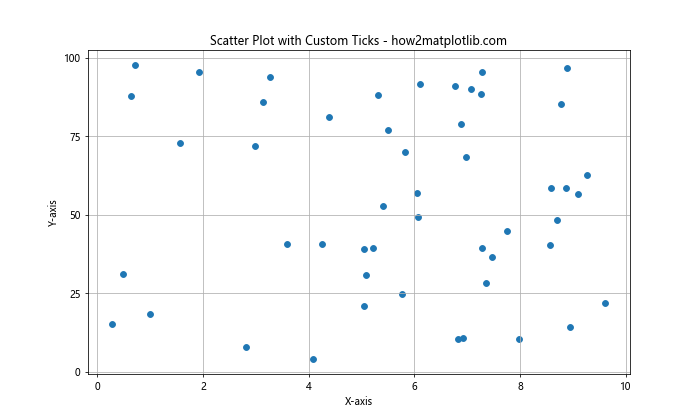
In this scatter plot example, we’re using set_ticks() to set custom tick locations on both the x and y axes, providing a clearer scale for our scattered data points.
Advanced Usage of Matplotlib.axis.Axis.set_ticks()
Now that we’ve covered the basics, let’s dive into some more advanced applications of the Matplotlib.axis.Axis.set_ticks() function.
Logarithmic Scale
When working with data that spans several orders of magnitude, a logarithmic scale can be useful. Here’s how you can use set_ticks() with a logarithmic scale:
import matplotlib.pyplot as plt
import numpy as np

x = np.logspace(0, 5, 100)
y = x**2

plt.figure(figsize=(10, 6))
plt.loglog(x, y)

# Set custom tick locations for logarithmic scale
plt.gca().xaxis.set_ticks([1, 10, 100, 1000, 10000, 100000])
plt.gca().yaxis.set_ticks([1, 1e2, 1e4, 1e6, 1e8, 1e10])

plt.title('Logarithmic Plot with Custom Ticks - how2matplotlib.com')
plt.xlabel('X-axis (log scale)')
plt.ylabel('Y-axis (log scale)')
plt.grid(True)
plt.show()
Output:
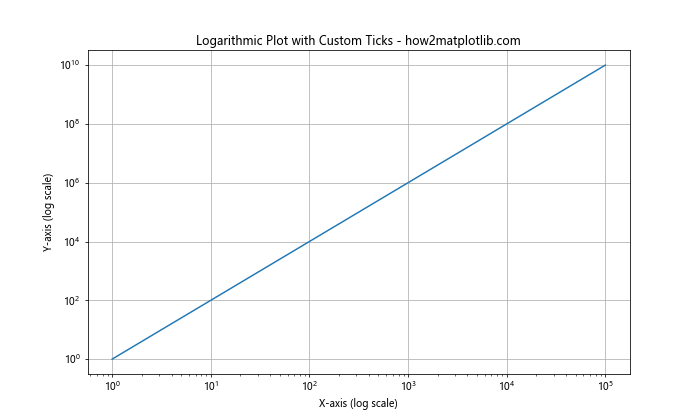
In this example, we’re using set_ticks() to set custom tick locations on both axes of a logarithmic plot. This allows us to highlight specific values on our logarithmic scale.
Date Axis
When working with time series data, you might want to customize the date ticks. Here’s how you can use set_ticks() with date data:
import matplotlib.pyplot as plt
import numpy as np
from datetime import datetime, timedelta

# Generate some sample date data
start_date = datetime(2023, 1, 1)
dates = [start_date + timedelta(days=i) for i in range(365)]
values = np.cumsum(np.random.randn(365))

plt.figure(figsize=(12, 6))
plt.plot(dates, values)

# Set custom date ticks
custom_ticks = [datetime(2023, m, 1) for m in range(1, 13)]
plt.gca().xaxis.set_ticks(custom_ticks)

plt.title('Time Series Plot with Custom Date Ticks - how2matplotlib.com')
plt.xlabel('Date')
plt.ylabel('Value')
plt.xticks(rotation=45)
plt.grid(True)
plt.tight_layout()
plt.show()
Output:
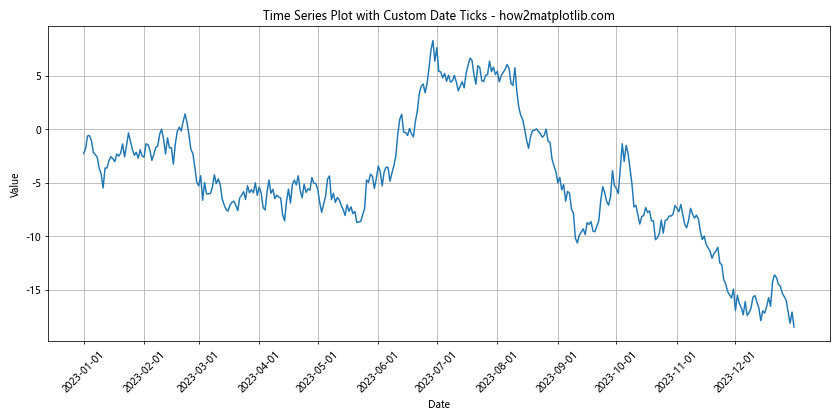
In this example, we’re using set_ticks() to set custom tick locations for a time series plot. We’re setting ticks at the first day of each month throughout the year.
Combining Matplotlib.axis.Axis.set_ticks() with Other Customization Functions
The Matplotlib.axis.Axis.set_ticks() function is often used in conjunction with other axis customization functions to create highly tailored plots. Let’s explore some of these combinations.
Using set_ticks() with set_ticklabels()
While set_ticks() sets the locations of the ticks, set_ticklabels() allows you to set custom labels for these ticks. Here’s an example:
import matplotlib.pyplot as plt
import numpy as np

x = np.linspace(0, 2*np.pi, 100)
y = np.sin(x)

plt.figure(figsize=(10, 6))
plt.plot(x, y)

# Set custom tick locations and labels
ticks = [0, np.pi/2, np.pi, 3*np.pi/2, 2*np.pi]
plt.gca().xaxis.set_ticks(ticks)
plt.gca().xaxis.set_ticklabels(['0', 'π/2', 'π', '3π/2', '2π'])

plt.title('Sine Wave with Custom Tick Locations and Labels - how2matplotlib.com')
plt.xlabel('X-axis')
plt.ylabel('Y-axis')
plt.grid(True)
plt.show()
Output:
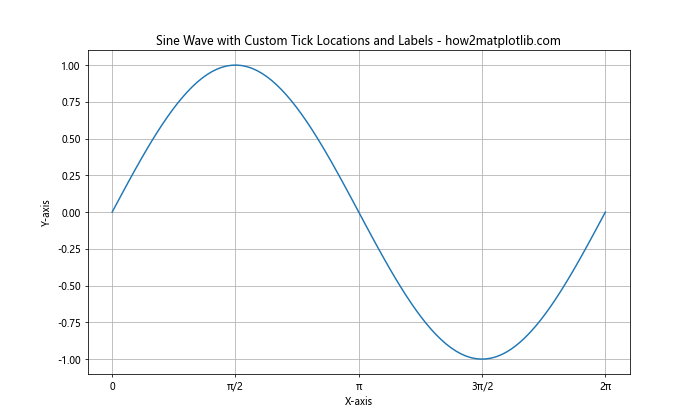
In this example, we’re using set_ticks() to set custom tick locations at multiples of π/2, and then using set_ticklabels() to give these ticks meaningful labels.
Handling Edge Cases with Matplotlib.axis.Axis.set_ticks()
While the Matplotlib.axis.Axis.set_ticks() function is versatile, there are some edge cases and potential pitfalls to be aware of. Let’s explore some of these scenarios and how to handle them.
Dealing with Out-of-Range Ticks
If you set ticks that are outside the range of your data, they won’t appear on the plot by default. However, you can force them to appear by adjusting the axis limits:
import matplotlib.pyplot as plt
import numpy as np

x = np.linspace(0, 10, 100)
y = np.sin(x)

plt.figure(figsize=(10, 6))
plt.plot(x, y)

# Set ticks including out-of-range values
plt.gca().xaxis.set_ticks([-2, 0, 2, 4, 6, 8, 10, 12])

# Adjust x-axis limits to show all ticks
plt.xlim(-2, 12)

plt.title('Plot with Out-of-Range Ticks - how2matplotlib.com')
plt.xlabel('X-axis')
plt.ylabel('Y-axis')
plt.grid(True)
plt.show()
Output:
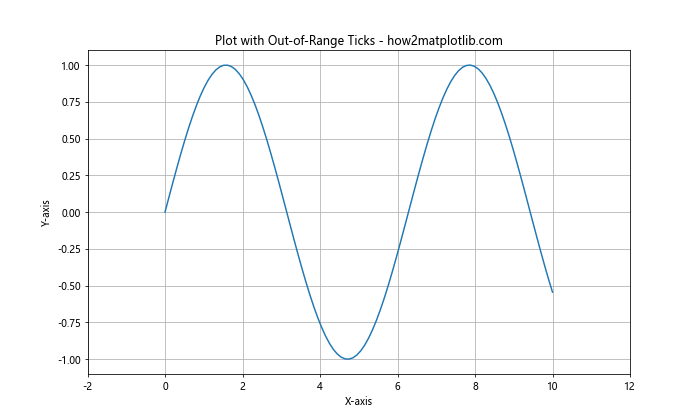
In this example, we’re setting ticks that go beyond the range of our data (-2 and 12), and then adjusting the x-axis limits to ensure these ticks are visible.
Best Practices for Using Matplotlib.axis.Axis.set_ticks()
When using the Matplotlib.axis.Axis.set_ticks() function, there are several best practices to keep in mind to create clear, informative, and visually appealing plots.
Choose Meaningful Tick Locations
The ticks you choose should help viewers understand the scale and distribution of your data. Here’s an example of choosing meaningful ticks for a dataset with a specific range:
import matplotlib.pyplot as plt
import numpy as np

# Generate data between 0 and 100
x = np.linspace(0, 100, 1000)
y = np.sin(x / 10) * 50 + 50

plt.figure(figsize=(12, 6))
plt.plot(x, y)

# Set meaningful ticks
plt.gca().yaxis.set_ticks([0, 25, 50, 75, 100])

plt.title('Sine Wave with Meaningful Y-axis Ticks - how2matplotlib.com')
plt.xlabel('X-axis')
plt.ylabel('Y-axis')
plt.grid(True)
plt.show()
Output:
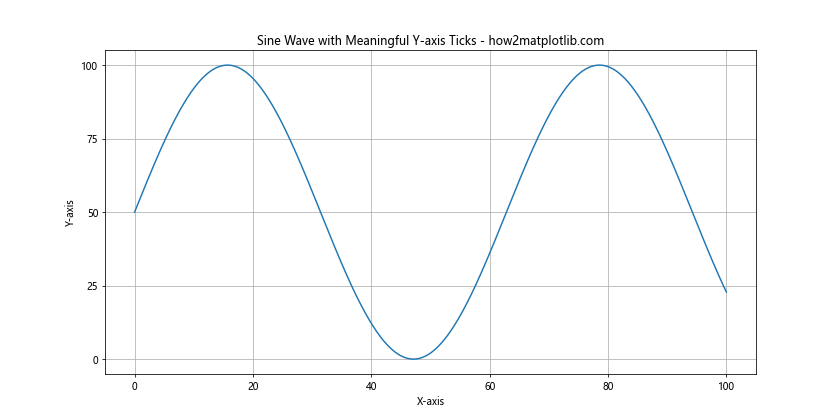
In this example, we’re setting y-axis ticks at 0, 25, 50, 75, and 100, which provides a clear scale for the data that ranges from 0 to 100.
Align Ticks with Data Points
When dealing with discrete data, it’s often helpful to align ticks with actual data points. Here’s an example:
import matplotlib.pyplot as plt
import numpy as np

# Generate discrete data
x = np.arange(1, 6)
y = [2, 4, 1, 5, 3]

plt.figure(figsize=(10, 6))
plt.bar(x, y)

# Align ticks with data points
plt.gca().xaxis.set_ticks(x)

plt.title('Bar Plot with Aligned X-axis Ticks - how2matplotlib.com')
plt.xlabel('Category')
plt.ylabel('Value')
plt.grid(True, axis='y')
plt.show()
Output:
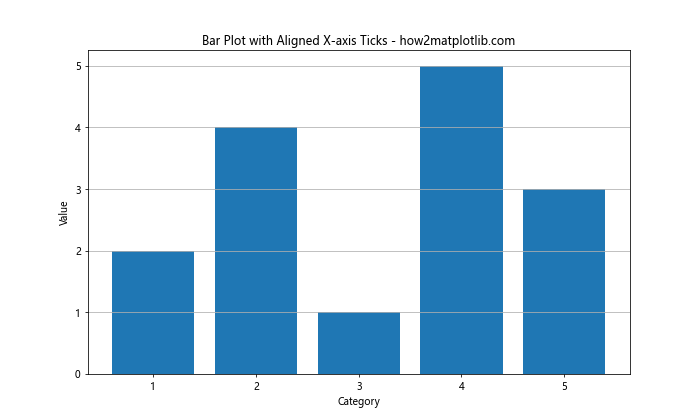
In this bar plot, we’re setting the x-axis ticks to align exactly with the categories represented by each bar.
Use Consistent Tick Spacing
When possible, use consistent spacing between ticks to make the scale easier to understand:
import matplotlib.pyplot as plt
import numpy as np

x = np.linspace(0, 50, 500)
y = np.exp(x / 10)

plt.figure(figsize=(12, 6))
plt.plot(x, y)

# Set consistently spaced ticks
plt.gca().yaxis.set_ticks(np.logspace(0, 4, 5))

plt.title('Exponential Plot with Consistently Spaced Y-axis Ticks - how2matplotlib.com')
plt.xlabel('X-axis')
plt.ylabel('Y-axis (log scale)')
plt.yscale('log')
plt.grid(True)
plt.show()
Output:
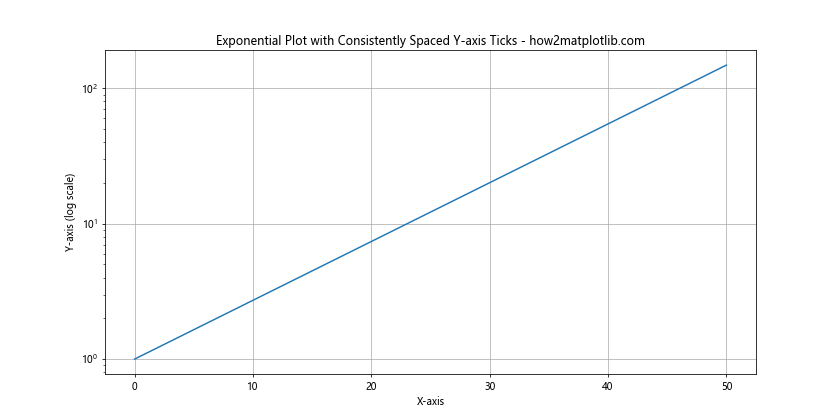
In this example, we’re using a logarithmic scale for the y-axis and setting ticks at consistently spaced powers of 10.
Advanced Techniques with Matplotlib.axis.Axis.set_ticks()
Let’s explore some advanced techniques that can be achieved using the Matplotlib.axis.Axis.set_ticks() function in combination with other Matplotlib features.
Multiple Y-axes with Different Tick Locations
Sometimes, you might want to plot multiple datasets with different scales on the same graph. Here’s how you can use set_ticks() with multiple y-axes:
import matplotlib.pyplot as plt
import numpy as np

x = np.linspace(0, 10, 100)
y1 = np.sin(x)
y2 = np.exp(x/2)

fig, ax1 = plt.subplots(figsize=(12, 6))

# Plot first dataset
color = 'tab:blue'
ax1.set_xlabel('X-axis')
ax1.set_ylabel('sin(x)', color=color)
ax1.plot(x, y1, color=color)
ax1.tick_params(axis='y', labelcolor=color)

# Create second y-axis
ax2 = ax1.twinx()
color = 'tab:orange'
ax2.set_ylabel('exp(x/2)', color=color)
ax2.plot(x, y2, color=color)
ax2.tick_params(axis='y', labelcolor=color)

# Set custom ticks for both y-axes
ax1.yaxis.set_ticks(np.arange(-1, 1.1, 0.5))
ax2.yaxis.set_ticks(np.arange(0, 151, 30))

plt.title('Multiple Y-axes with Custom Ticks - how2matplotlib.com')
plt.grid(True)
plt.show()
Output:
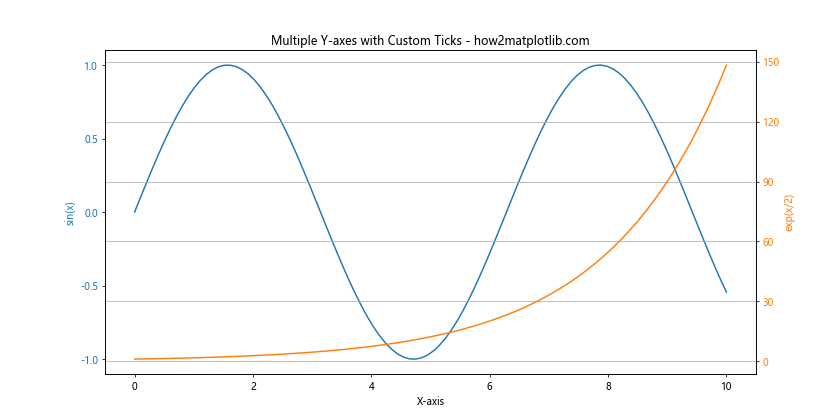
In this example, we’re creating a plot with two y-axes, each with its own custom tick locations set using set_ticks().
Polar Plots with Custom Ticks
The Matplotlib.axis.Axis.set_ticks() function can also be used with polar plots. Here’s an example:
import matplotlib.pyplot as plt
import numpy as np

r = np.arange(0, 2, 0.01)
theta = 2 * np.pi * r

fig, ax = plt.subplots(subplot_kw=dict(projection='polar'), figsize=(10, 10))
ax.plot(theta, r)

# Set custom ticks for radial axis
ax.set_rticks([0.5, 1, 1.5])

# Set custom ticks for angular axis
ax.set_xticks(np.arange(0, 2*np.pi, np.pi/4))

plt.title('Polar Plot with Custom Ticks - how2matplotlib.com')
plt.show()
Output:
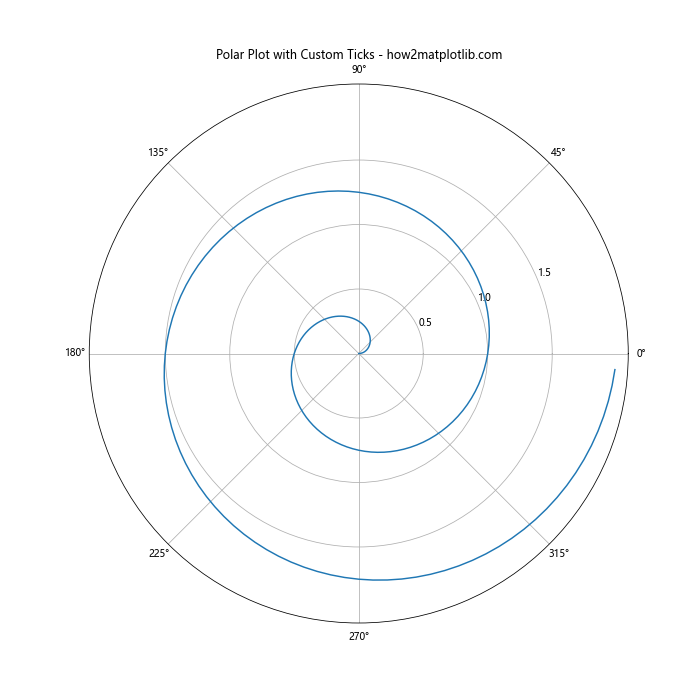
In this polar plot example, we’re using set_ticks() (via set_rticks() and set_xticks()) to set custom tick locations for both the radial and angular axes.
3D Plots with Custom Ticks
The Matplotlib.axis.Axis.set_ticks() function can also be applied to 3D plots. Here’s an example:
import matplotlib.pyplot as plt
import numpy as np
from mpl_toolkits.mplot3d import Axes3D

fig = plt.figure(figsize=(12, 8))
ax = fig.add_subplot(111, projection='3d')

# Generate data for a 3D surface
X = np.arange(-5, 5, 0.25)
Y = np.arange(-5, 5, 0.25)
X, Y = np.meshgrid(X, Y)
R = np.sqrt(X**2 + Y**2)
Z = np.sin(R)

# Plot the surface
surf = ax.plot_surface(X, Y, Z, cmap='viridis')

# Set custom ticks for all axes
ax.set_xticks(np.arange(-5, 6, 2))
ax.set_yticks(np.arange(-5, 6, 2))
ax.set_zticks(np.arange(-1, 1.1, 0.5))

plt.title('3D Surface Plot with Custom Ticks - how2matplotlib.com')
plt.show()
Output:
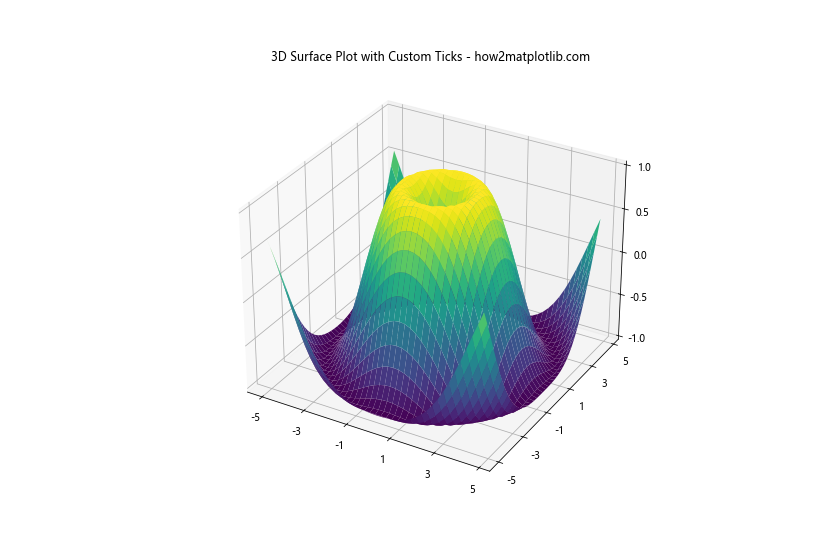
In this 3D plot example, we’re using set_ticks() to set custom tick locations for all three axes.
Troubleshooting Common Issues with Matplotlib.axis.Axis.set_ticks()
When working with the Matplotlib.axis.Axis.set_ticks() function, you might encounter some common issues. Let’s discuss these issues and how to resolve them.
Ticks Not Appearing
If you’ve set ticks using set_ticks() but they’re not appearing on your plot, it could be due to the axis limits. Here’s how to diagnose and fix this issue:
import matplotlib.pyplot as plt
import numpy as np

x = np.linspace(0, 10, 100)
y = np.sin(x)

plt.figure(figsize=(12, 6))
plt.plot(x, y)

# Set ticks that extend beyond the data range
plt.gca().xaxis.set_ticks(np.arange(0, 15, 2))

# Adjust the x-axis limits to show all ticks
plt.xlim(0, 14)

plt.title('Plot with Extended X-axis Ticks - how2matplotlib.com')
plt.xlabel('X-axis')
plt.ylabel('Y-axis')
plt.grid(True)
plt.show()
Output:
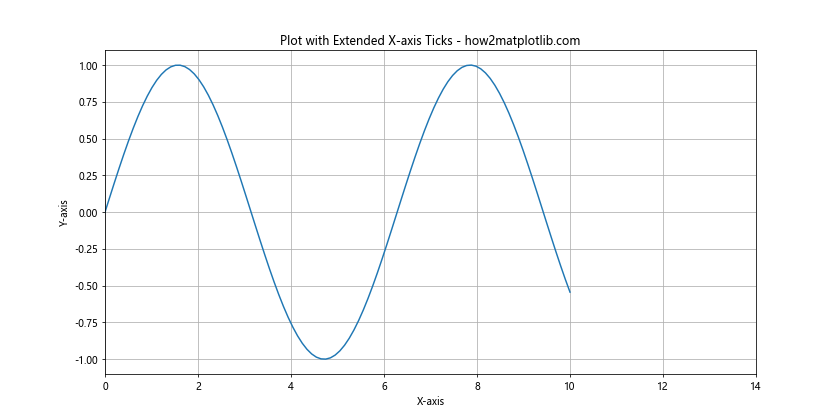
In this example, we’re setting ticks that go beyond the range of our data, and then adjusting the x-axis limits to ensure all ticks are visible.
Tick Labels Overlapping
If you have many ticks or long tick labels, they might overlap and become unreadable. Here’s how to handle this:
import matplotlib.pyplot as plt
import numpy as np

x = np.arange(10)
y = np.random.rand(10)

plt.figure(figsize=(12, 6))
plt.bar(x, y)

# Set many ticks with long labels
ticks = np.arange(10)
labels = [f'Category {i} (how2matplotlib.com)' for i in range(10)]
plt.gca().xaxis.set_ticks(ticks)
plt.gca().xaxis.set_ticklabels(labels)

# Rotate tick labels to prevent overlap
plt.xticks(rotation=45, ha='right')

plt.title('Bar Plot with Rotated X-axis Tick Labels')
plt.xlabel('Categories')
plt.ylabel('Values')
plt.tight_layout()
plt.show()
Output:
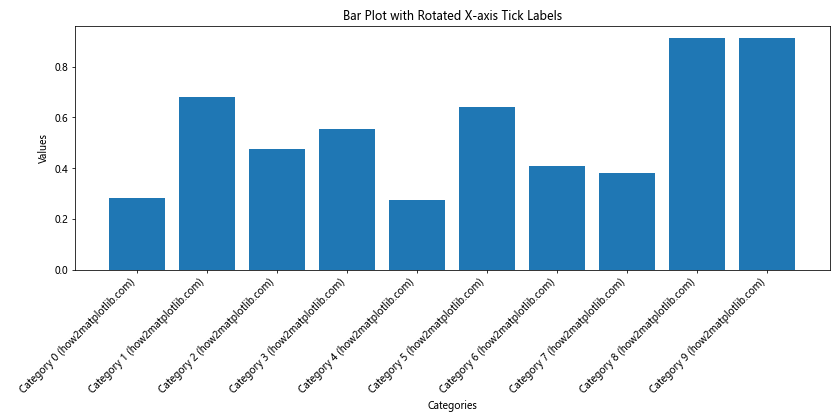
In this example, we’re rotating the tick labels to prevent overlap when we have many ticks with long labels.
Conclusion
The Matplotlib.axis.Axis.set_ticks() function is a powerful tool for customizing the appearance of your plots in Python. By allowing precise control over tick locations, it enables you to create more informative and visually appealing visualizations.