Comprehensive Guide to Matplotlib.axis.Axis.set_ticklabels() Function in Python
Matplotlib.axis.Axis.set_ticklabels() function in Python is a powerful tool for customizing tick labels on plot axes. This function allows you to set custom labels for the ticks on an axis, providing greater control over the appearance and information displayed on your plots. In this comprehensive guide, we’ll explore the Matplotlib.axis.Axis.set_ticklabels() function in depth, covering its syntax, parameters, usage, and various applications in data visualization.
Understanding the Matplotlib.axis.Axis.set_ticklabels() Function
The Matplotlib.axis.Axis.set_ticklabels() function is part of the Matplotlib library, which is widely used for creating static, animated, and interactive visualizations in Python. This function specifically deals with customizing the labels of tick marks on an axis. By using Matplotlib.axis.Axis.set_ticklabels(), you can replace the default tick labels with custom text, numbers, or even mathematical expressions.
Basic Syntax of Matplotlib.axis.Axis.set_ticklabels()
The basic syntax of the Matplotlib.axis.Axis.set_ticklabels() function is as follows:
axis.set_ticklabels(labels, fontdict=None, minor=False, **kwargs)
Let’s break down the parameters:
labels: This is a list or array of string labels to be placed at the given tick locations.fontdict: An optional dictionary controlling the appearance of the tick labels.minor: A boolean value that, when True, sets the labels on the minor ticks.**kwargs: Additional keyword arguments to control text properties.
Now, let’s dive into some examples to see how we can use the Matplotlib.axis.Axis.set_ticklabels() function in practice.
Basic Usage of Matplotlib.axis.Axis.set_ticklabels()
Let’s start with a simple example to demonstrate the basic usage of the Matplotlib.axis.Axis.set_ticklabels() function.
import matplotlib.pyplot as plt
import numpy as np

# Create some sample data
x = np.arange(5)
y = x ** 2

# Create the plot
fig, ax = plt.subplots()
ax.plot(x, y, marker='o')

# Set custom tick labels for x-axis
ax.xaxis.set_ticklabels(['One', 'Two', 'Three', 'Four', 'Five'])

# Set title and labels
plt.title('Basic Usage of set_ticklabels() - how2matplotlib.com')
plt.xlabel('Custom X Labels')
plt.ylabel('Y Values')

plt.show()
Output:
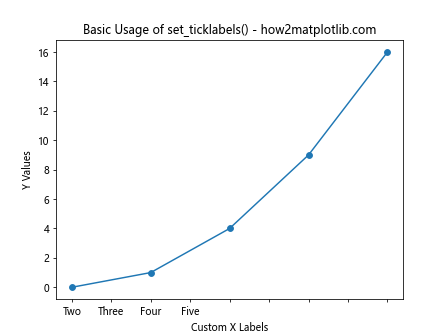
In this example, we create a simple plot of y = x^2 and use Matplotlib.axis.Axis.set_ticklabels() to set custom labels for the x-axis. The default numeric labels are replaced with text labels ‘One’, ‘Two’, ‘Three’, ‘Four’, and ‘Five’.
Customizing Font Properties with Matplotlib.axis.Axis.set_ticklabels()
The Matplotlib.axis.Axis.set_ticklabels() function allows you to customize the appearance of tick labels using the fontdict parameter. Let’s see how we can change the font size, color, and style of our tick labels.
import matplotlib.pyplot as plt
import numpy as np

# Create some sample data
x = np.arange(5)
y = x ** 2

# Create the plot
fig, ax = plt.subplots()
ax.plot(x, y, marker='o')

# Define font properties
font_props = {
    'fontsize': 14,
    'fontweight': 'bold',
    'color': 'red',
    'rotation': 45
}

# Set custom tick labels with font properties
ax.xaxis.set_ticklabels(['A', 'B', 'C', 'D', 'E'], fontdict=font_props)

# Set title and labels
plt.title('Customized Font Properties - how2matplotlib.com')
plt.xlabel('Custom X Labels')
plt.ylabel('Y Values')

plt.tight_layout()
plt.show()
Output:
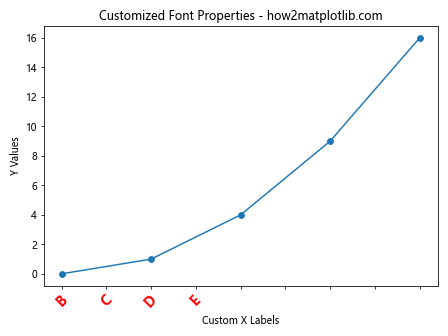
In this example, we use the fontdict parameter to customize the appearance of our tick labels. We set the font size to 14, make the labels bold, color them red, and rotate them by 45 degrees.
Using Matplotlib.axis.Axis.set_ticklabels() with DateTime Data
The Matplotlib.axis.Axis.set_ticklabels() function is particularly useful when working with datetime data. Let’s see how we can customize date labels on an axis.
import matplotlib.pyplot as plt
import numpy as np
from datetime import datetime, timedelta

# Create some sample datetime data
start_date = datetime(2023, 1, 1)
dates = [start_date + timedelta(days=i) for i in range(5)]
values = [10, 15, 13, 18, 20]

# Create the plot
fig, ax = plt.subplots(figsize=(10, 6))
ax.plot(dates, values, marker='o')

# Format dates as strings
date_strings = [date.strftime('%Y-%m-%d') for date in dates]

# Set custom tick labels
ax.xaxis.set_ticklabels(date_strings, rotation=45, ha='right')

# Set title and labels
plt.title('DateTime Labels with set_ticklabels() - how2matplotlib.com')
plt.xlabel('Dates')
plt.ylabel('Values')

plt.tight_layout()
plt.show()
Output:
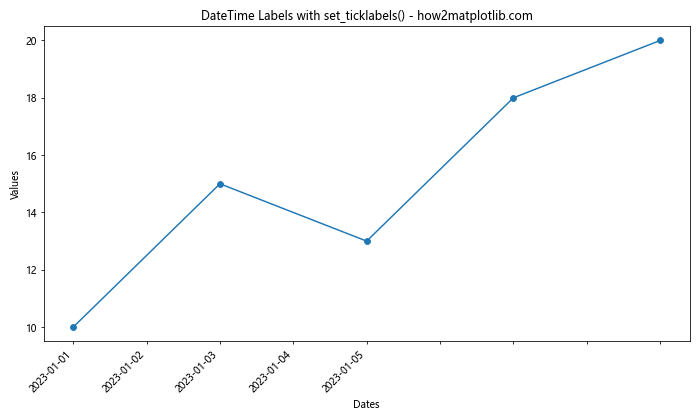
In this example, we create a plot with datetime data on the x-axis. We use Matplotlib.axis.Axis.set_ticklabels() to set custom date labels, formatting them as strings and rotating them for better readability.
Applying Matplotlib.axis.Axis.set_ticklabels() to Both Axes
You can use Matplotlib.axis.Axis.set_ticklabels() on both the x-axis and y-axis. Here’s an example demonstrating this:
import matplotlib.pyplot as plt
import numpy as np

# Create some sample data
x = np.arange(5)
y = x ** 2

# Create the plot
fig, ax = plt.subplots()
ax.plot(x, y, marker='o')

# Set custom tick labels for x-axis
ax.xaxis.set_ticklabels(['Low', 'Medium-Low', 'Medium', 'Medium-High', 'High'])

# Set custom tick labels for y-axis
ax.yaxis.set_ticklabels(['Zero', 'Low', 'Medium', 'High', 'Very High'])

# Set title and labels
plt.title('Custom Labels on Both Axes - how2matplotlib.com')
plt.xlabel('X Categories')
plt.ylabel('Y Categories')

plt.tight_layout()
plt.show()
Output:
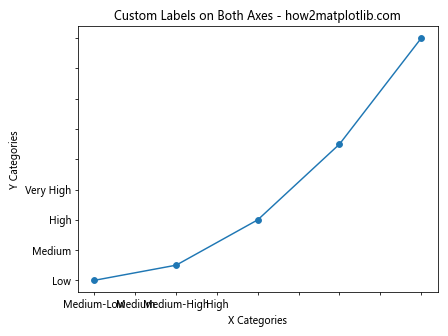
In this example, we apply custom labels to both the x-axis and y-axis using Matplotlib.axis.Axis.set_ticklabels(). This can be useful when you want to categorize your data or provide more descriptive labels for both dimensions.
Using Matplotlib.axis.Axis.set_ticklabels() with Logarithmic Scales
The Matplotlib.axis.Axis.set_ticklabels() function can also be used effectively with logarithmic scales. Here’s an example:
import matplotlib.pyplot as plt
import numpy as np

# Create some sample data
x = np.logspace(0, 3, 4)
y = x ** 2

# Create the plot with logarithmic scales
fig, ax = plt.subplots()
ax.loglog(x, y, marker='o')

# Set custom tick labels for x-axis
ax.xaxis.set_ticklabels(['1', '10', '100', '1000'])

# Set custom tick labels for y-axis
ax.yaxis.set_ticklabels(['1', '10^2', '10^4', '10^6'])

# Set title and labels
plt.title('Logarithmic Scale with set_ticklabels() - how2matplotlib.com')
plt.xlabel('X (log scale)')
plt.ylabel('Y (log scale)')

plt.tight_layout()
plt.show()
Output:
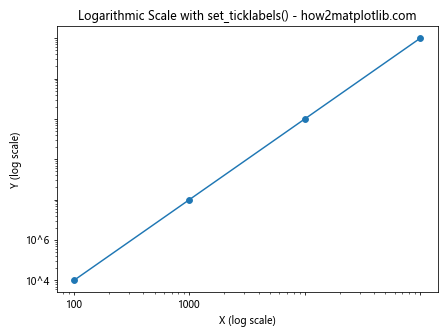
In this example, we create a log-log plot and use Matplotlib.axis.Axis.set_ticklabels() to set custom labels for both axes. This can be particularly useful when dealing with data that spans multiple orders of magnitude.
Combining Matplotlib.axis.Axis.set_ticklabels() with set_ticks()
Often, you’ll want to use Matplotlib.axis.Axis.set_ticklabels() in conjunction with the set_ticks() function to ensure your custom labels align with specific data points. Here’s an example:
import matplotlib.pyplot as plt
import numpy as np

# Create some sample data
x = np.linspace(0, 10, 11)
y = x ** 2

# Create the plot
fig, ax = plt.subplots()
ax.plot(x, y, marker='o')

# Set custom ticks and labels for x-axis
custom_ticks = [0, 2, 5, 8, 10]
custom_labels = ['Start', 'Early', 'Middle', 'Late', 'End']
ax.xaxis.set_ticks(custom_ticks)
ax.xaxis.set_ticklabels(custom_labels)

# Set title and labels
plt.title('Combining set_ticks() and set_ticklabels() - how2matplotlib.com')
plt.xlabel('Custom X Labels')
plt.ylabel('Y Values')

plt.tight_layout()
plt.show()
Output:
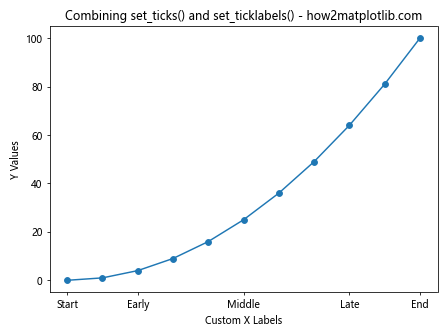
In this example, we first use set_ticks() to specify the positions of the ticks, and then use Matplotlib.axis.Axis.set_ticklabels() to set custom labels for these ticks. This ensures that our custom labels are aligned with specific data points.
Using Matplotlib.axis.Axis.set_ticklabels() with Categorical Data
The Matplotlib.axis.Axis.set_ticklabels() function is particularly useful when working with categorical data. Here’s an example:
import matplotlib.pyplot as plt
import numpy as np

# Create some sample categorical data
categories = ['A', 'B', 'C', 'D', 'E']
values = [23, 45, 56, 78, 32]

# Create the bar plot
fig, ax = plt.subplots()
ax.bar(categories, values)

# Set custom tick labels
ax.xaxis.set_ticklabels(['Category A', 'Category B', 'Category C', 'Category D', 'Category E'])

# Set title and labels
plt.title('Categorical Data with set_ticklabels() - how2matplotlib.com')
plt.xlabel('Categories')
plt.ylabel('Values')

plt.tight_layout()
plt.show()
Output:
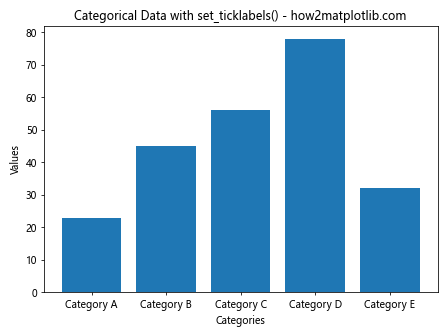
In this example, we create a bar plot with categorical data and use Matplotlib.axis.Axis.set_ticklabels() to set more descriptive labels for each category.
Applying Matplotlib.axis.Axis.set_ticklabels() to Subplots
When working with multiple subplots, you can apply Matplotlib.axis.Axis.set_ticklabels() to each subplot individually. Here’s an example:
import matplotlib.pyplot as plt
import numpy as np

# Create some sample data
x = np.arange(5)
y1 = x ** 2
y2 = x ** 3

# Create the subplots
fig, (ax1, ax2) = plt.subplots(2, 1, figsize=(8, 10))

# Plot data on first subplot
ax1.plot(x, y1, marker='o')
ax1.xaxis.set_ticklabels(['A', 'B', 'C', 'D', 'E'])
ax1.set_title('Subplot 1 - how2matplotlib.com')

# Plot data on second subplot
ax2.plot(x, y2, marker='s')
ax2.xaxis.set_ticklabels(['One', 'Two', 'Three', 'Four', 'Five'])
ax2.set_title('Subplot 2 - how2matplotlib.com')

# Set overall title
fig.suptitle('Applying set_ticklabels() to Subplots', fontsize=16)

plt.tight_layout()
plt.show()
Output:
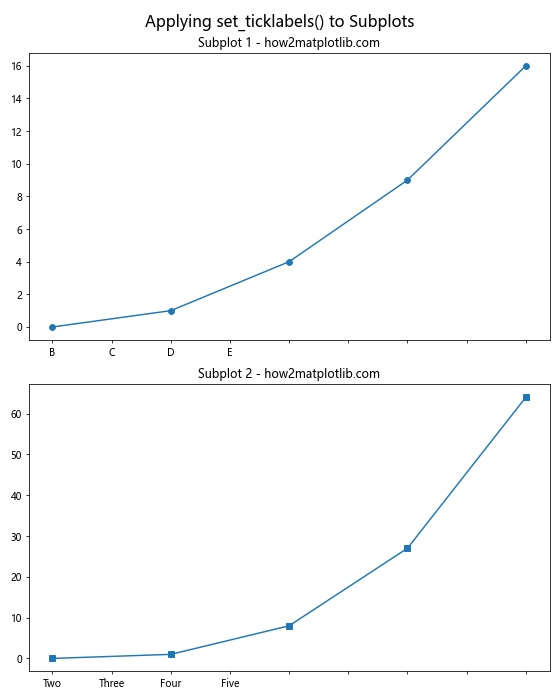
In this example, we create two subplots and apply different custom labels to each subplot using Matplotlib.axis.Axis.set_ticklabels().
Using Matplotlib.axis.Axis.set_ticklabels() with Scientific Notation
When dealing with very large or very small numbers, it can be useful to display tick labels in scientific notation. Here’s how you can achieve this using Matplotlib.axis.Axis.set_ticklabels():
import matplotlib.pyplot as plt
import numpy as np

# Create some sample data
x = np.array([1e3, 1e4, 1e5, 1e6, 1e7])
y = x ** 2

# Create the plot
fig, ax = plt.subplots()
ax.plot(x, y, marker='o')

# Set custom tick labels with scientific notation
ax.xaxis.set_ticklabels(['$10^3$', '$10^4$', '$10^5$', '$10^6$', '$10^7$'])
ax.yaxis.set_ticklabels(['$10^6$', '$10^8$', '$10^{10}$', '$10^{12}$', '$10^{14}$'])

# Set title and labels
plt.title('Scientific Notation with set_ticklabels() - how2matplotlib.com')
plt.xlabel('X Values')
plt.ylabel('Y Values')

plt.tight_layout()
plt.show()
Output:
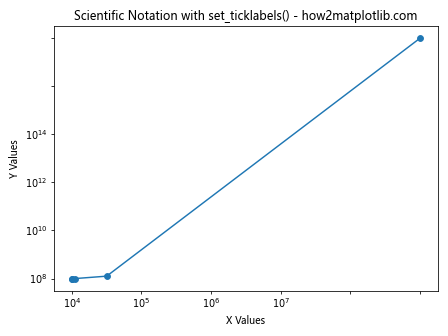
In this example, we use LaTeX formatting to display the tick labels in scientific notation. This can greatly improve the readability of plots with very large or small numbers.
Applying Matplotlib.axis.Axis.set_ticklabels() to Polar Plots
The Matplotlib.axis.Axis.set_ticklabels() function can also be applied to polar plots. Here’s an example:
import matplotlib.pyplot as plt
import numpy as np

# Create some sample data
theta = np.linspace(0, 2*np.pi, 8, endpoint=False)
r = np.array([2, 3, 4, 3, 2, 3, 4, 3])

# Create the polar plot
fig, ax = plt.subplots(subplot_kw=dict(projection='polar'))
ax.plot(theta, r, marker='o')

# Set custom tick labels
ax.xaxis.set_ticklabels(['N', 'NE', 'E', 'SE', 'S', 'SW', 'W', 'NW'])

# Set title
plt.title('Polar Plot with set_ticklabels() - how2matplotlib.com')

plt.tight_layout()
plt.show()
Output:
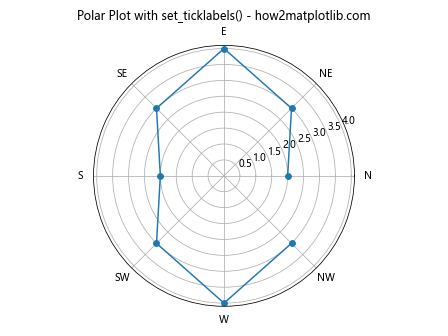
In this example, we create a polar plot and use Matplotlib.axis.Axis.set_ticklabels() to set custom labels for the angular axis, representing compass directions.
Using Matplotlib.axis.Axis.set_ticklabels() with Locators
Matplotlib provides various locator classes that can be used to determine the positions of tick marks. You can combine these locators with Matplotlib.axis.Axis.set_ticklabels() for more precise control over your tick labels. Here’s an example:
import matplotlib.pyplot as plt
import numpy as np
from matplotlib.ticker import MultipleLocator

# Create some sample data
x = np.linspace(0, 10, 100)
y = np.sin(x)

# Create the plot
fig, ax = plt.subplots()
ax.plot(x, y)

# Set major locator and custom labels
ax.xaxis.set_major_locator(MultipleLocator(2))
ax.xaxis.set_ticklabels(['Zero', 'Two', 'Four', 'Six', 'Eight', 'Ten'])

# Set title and labels
plt.title('Using set_ticklabels() with Locators - how2matplotlib.com')
plt.xlabel('X Values')
plt.ylabel('Y Values')

plt.tight_layout()
plt.show()
Output:
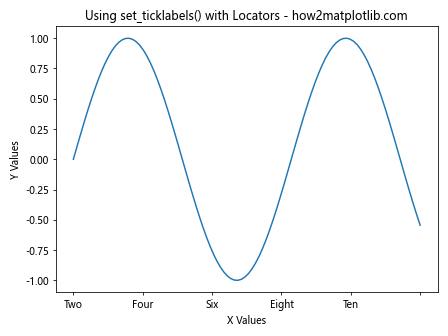
In this example, we use the MultipleLocator to set major ticks at intervals of 2, and then use Matplotlib.axis.Axis.set_ticklabels() to provide custom labels for these ticks.
Applying Matplotlib.axis.Axis.set_ticklabels() to 3D Plots
The Matplotlib.axis.Axis.set_ticklabels() function can also be applied to 3D plots. Here’s an example:
import matplotlib.pyplot as plt
import numpy as np

# Create some sample data
x = np.arange(-5, 5, 0.25)
y = np.arange(-5, 5, 0.25)
X, Y = np.meshgrid(x, y)
Z = np.sin(np.sqrt(X**2 + Y**2))

# Create the 3D plot
fig = plt.figure()
ax = fig.add_subplot(111, projection='3d')
surf = ax.plot_surface(X, Y, Z)

# Set custom tick labels for all axes
ax.xaxis.set_ticklabels(['Very Low', 'Low', 'Medium', 'High', 'Very High'])
ax.yaxis.set_ticklabels(['Very Low', 'Low', 'Medium', 'High', 'Very High'])
ax.zaxis.set_ticklabels(['Min', 'Low', 'Medium', 'High', 'Max'])

# Set title and labels
ax.set_title('3D Plot with set_ticklabels() - how2matplotlib.com')
ax.set_xlabel('X Axis')
ax.set_ylabel('Y Axis')
ax.set_zlabel('Z Axis')

plt.tight_layout()
plt.show()
Output:
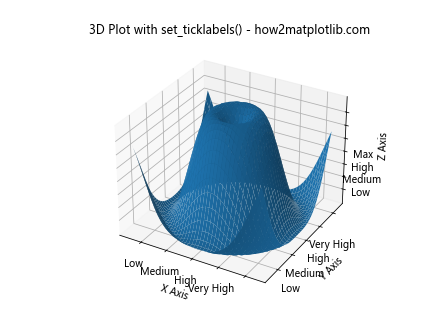
In this example, we create a 3D surface plot and use Matplotlib.axis.Axis.set_ticklabels() to set custom labels for all three axes.
Using Matplotlib.axis.Axis.set_ticklabels() with Colorbar
When working with colormaps and colorbars, you can also apply Matplotlib.axis.Axis.set_ticklabels() to customize the colorbar labels. Here’s an example:
import matplotlib.pyplot as plt
import numpy as np

# Create some sample data
x = np.linspace(0, 10, 100)
y = np.linspace(0, 10, 100)
X, Y = np.meshgrid(x, y)
Z = np.sin(X) * np.cos(Y)

# Create the plot
fig, ax = plt.subplots()
im = ax.imshow(Z, cmap='viridis')

# Add colorbar
cbar = fig.colorbar(im)

# Set custom tick labels for colorbar
cbar.ax.yaxis.set_ticklabels(['Very Low', 'Low', 'Medium', 'High', 'Very High'])

# Set title and labels
plt.title('Colorbar with set_ticklabels() - how2matplotlib.com')
plt.xlabel('X Axis')
plt.ylabel('Y Axis')

plt.tight_layout()
plt.show()
Output:
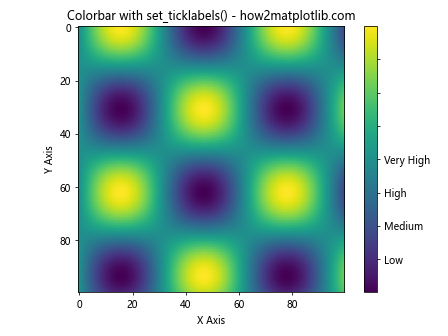
In this example, we create a 2D color plot and add a colorbar. We then use Matplotlib.axis.Axis.set_ticklabels() to set custom labels for the colorbar.
Advanced Usage: Formatting Tick Labels with Functions
For more complex labeling scenarios, you can pass a function to Matplotlib.axis.Axis.set_ticklabels(). This function will be called for each tick, allowing you to create dynamic or conditional labels. Here’s an example:
import matplotlib.pyplot as plt
import numpy as np

def format_func(value, tick_number):
    if value == 0:
        return 'Zero'
    elif value < 0:
        return f'Neg {abs(value)}'
    else:
        return f'Pos {value}'

# Create some sample data
x = np.linspace(-5, 5, 11)
y = x ** 2

# Create the plot
fig, ax = plt.subplots()
ax.plot(x, y, marker='o')

# Set custom tick labels using a formatting function
ax.xaxis.set_major_locator(plt.MultipleLocator(1))
ax.xaxis.set_ticklabels([format_func(i, 0) for i in range(-5, 6)])

# Set title and labels
plt.title('Formatting Tick Labels with Functions - how2matplotlib.com')
plt.xlabel('X Values')
plt.ylabel('Y Values')

plt.tight_layout()
plt.show()
Output:
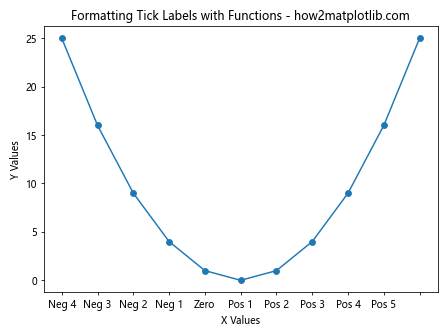
In this example, we define a custom function format_func that formats the tick labels based on their values. We then use this function in combination with Matplotlib.axis.Axis.set_ticklabels() to create dynamic labels.
Handling Overlapping Labels with Matplotlib.axis.Axis.set_ticklabels()
When dealing with many tick labels or long label text, overlapping can become an issue. Here's how you can handle this using Matplotlib.axis.Axis.set_ticklabels():
import matplotlib.pyplot as plt
import numpy as np

# Create some sample data
x = np.arange(10)
y = np.random.rand(10)

# Create the plot
fig, ax = plt.subplots(figsize=(10, 6))
ax.bar(x, y)

# Set custom tick labels
long_labels = ['Category ' + str(i) for i in range(1, 11)]
ax.xaxis.set_ticklabels(long_labels, rotation=45, ha='right')

# Set title and labels
plt.title('Handling Overlapping Labels - how2matplotlib.com')
plt.xlabel('Categories')
plt.ylabel('Values')

plt.tight_layout()
plt.show()
Output:
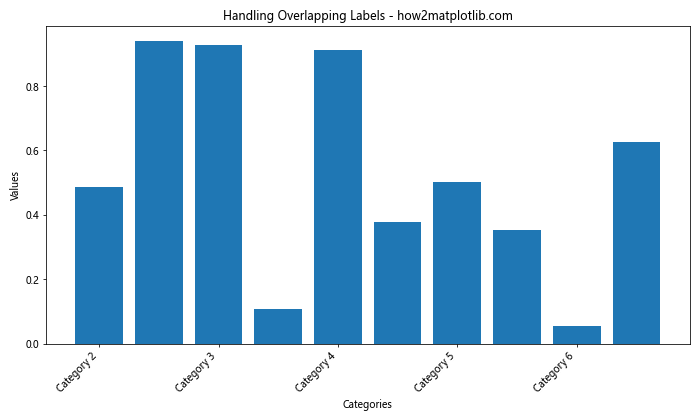
In this example, we use long category names for our x-axis labels. To prevent overlapping, we rotate the labels by 45 degrees and align them to the right using the ha='right' parameter.
Using Matplotlib.axis.Axis.set_ticklabels() with Time Series Data
When working with time series data, Matplotlib.axis.Axis.set_ticklabels() can be particularly useful for formatting date and time labels. Here's an example:
import matplotlib.pyplot as plt
import numpy as np
from datetime import datetime, timedelta

# Create some sample time series data
start_date = datetime(2023, 1, 1)
dates = [start_date + timedelta(days=i) for i in range(10)]
values = np.random.rand(10)

# Create the plot
fig, ax = plt.subplots(figsize=(12, 6))
ax.plot(dates, values, marker='o')

# Format date labels
date_labels = [date.strftime('%Y-%m-%d') for date in dates]
ax.xaxis.set_ticklabels(date_labels, rotation=45, ha='right')

# Set title and labels
plt.title('Time Series Data with set_ticklabels() - how2matplotlib.com')
plt.xlabel('Date')
plt.ylabel('Value')

plt.tight_layout()
plt.show()
Output:
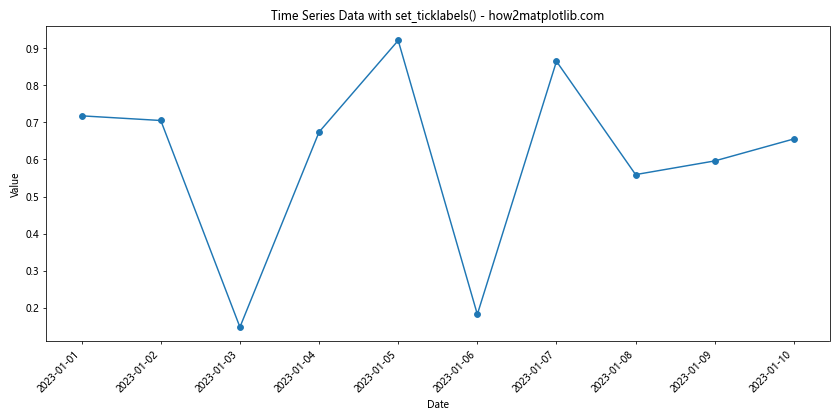
In this example, we create a time series plot and use Matplotlib.axis.Axis.set_ticklabels() to format the date labels on the x-axis.
Conclusion
The Matplotlib.axis.Axis.set_ticklabels() function is a powerful tool in the Matplotlib library that allows for extensive customization of tick labels on plot axes. Throughout this comprehensive guide, we've explored various applications of this function, from basic usage to more advanced scenarios.
We've seen how Matplotlib.axis.Axis.set_ticklabels() can be used to:
- Set custom text labels for numeric data
- Customize font properties of tick labels
- Work with datetime data
- Apply custom labels to both x and y axes
- Handle logarithmic scales
- Combine with set_ticks() for precise label placement
- Work with categorical data
- Apply to subplots individually
- Display scientific notation
- Customize polar plots
- Work with various locators
- Apply to 3D plots
- Customize colorbar labels
- Use formatting functions for dynamic labeling
- Handle overlapping labels
- Format time series data
By mastering the Matplotlib.axis.Axis.set_ticklabels() function, you can greatly enhance the readability and interpretability of your plots, making your data visualizations more informative and visually appealing.
Remember that while Matplotlib.axis.Axis.set_ticklabels() offers great flexibility, it's important to use it judiciously. Always aim for clarity and simplicity in your plots, and use custom labels when they truly add value to your visualization.