Comprehensive Guide to Matplotlib.axis.Axis.set_pickradius() Function in Python
Matplotlib.axis.Axis.set_pickradius() function in Python is a powerful tool for customizing the interactive behavior of plots created with Matplotlib. This function allows you to set the pick radius used for picking axis lines and tick labels. By adjusting the pick radius, you can fine-tune how sensitive your plot is to mouse clicks and other interactive events. In this comprehensive guide, we’ll explore the Matplotlib.axis.Axis.set_pickradius() function in depth, covering its usage, parameters, and practical applications in various plotting scenarios.
Understanding the Basics of Matplotlib.axis.Axis.set_pickradius()
The Matplotlib.axis.Axis.set_pickradius() function is a method of the Axis class in Matplotlib. It is used to set the pick radius for the axis, which determines how close a mouse click needs to be to an axis line or tick label for it to be considered a “pick” event. This function is particularly useful when you want to create interactive plots where users can click on specific parts of the axis to trigger actions or retrieve information.
Let’s start with a simple example to demonstrate how to use the Matplotlib.axis.Axis.set_pickradius() function:
import matplotlib.pyplot as plt

# Create a simple plot
fig, ax = plt.subplots()
ax.plot([1, 2, 3, 4], [1, 4, 2, 3], label='how2matplotlib.com')

# Set the pick radius for the x-axis
ax.xaxis.set_pickradius(5)

# Set the pick radius for the y-axis
ax.yaxis.set_pickradius(10)

plt.legend()
plt.title('Matplotlib.axis.Axis.set_pickradius() Example')
plt.show()
Output:
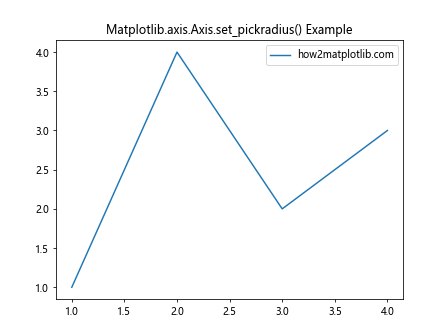
In this example, we create a simple line plot and set different pick radii for the x-axis and y-axis. The x-axis has a pick radius of 5 pixels, while the y-axis has a pick radius of 10 pixels. This means that clicks within 5 pixels of the x-axis or 10 pixels of the y-axis will be considered as pick events.
Exploring the Parameters of Matplotlib.axis.Axis.set_pickradius()
The Matplotlib.axis.Axis.set_pickradius() function takes a single parameter:
pickradius: This is a float value that specifies the pick radius in points. One point is 1/72 of an inch.
It’s important to note that the pick radius is measured in points, not pixels. This ensures consistency across different screen resolutions and display settings.
Let’s look at an example that demonstrates how different pick radius values affect the interactive behavior of a plot:
import matplotlib.pyplot as plt

fig, (ax1, ax2) = plt.subplots(1, 2, figsize=(12, 5))

# Plot with small pick radius
ax1.plot([1, 2, 3, 4], [1, 4, 2, 3], label='how2matplotlib.com')
ax1.xaxis.set_pickradius(2)
ax1.yaxis.set_pickradius(2)
ax1.set_title('Small Pick Radius (2 points)')

# Plot with large pick radius
ax2.plot([1, 2, 3, 4], [1, 4, 2, 3], label='how2matplotlib.com')
ax2.xaxis.set_pickradius(20)
ax2.yaxis.set_pickradius(20)
ax2.set_title('Large Pick Radius (20 points)')

plt.tight_layout()
plt.show()
Output:
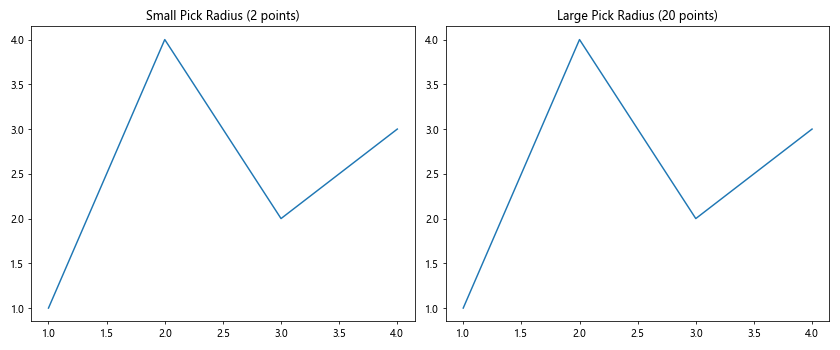
In this example, we create two subplots side by side. The left subplot has a small pick radius of 2 points, while the right subplot has a larger pick radius of 20 points. This difference will be noticeable when interacting with the plot, as the larger pick radius will make it easier to select axis elements.
Practical Applications of Matplotlib.axis.Axis.set_pickradius()
Now that we understand the basics of the Matplotlib.axis.Axis.set_pickradius() function, let’s explore some practical applications and more advanced usage scenarios.
1. Creating Interactive Axis Labels
One common use case for the set_pickradius() function is to create interactive axis labels. By setting an appropriate pick radius, you can make it easier for users to click on specific tick labels and trigger custom actions.
Here’s an example that demonstrates how to create interactive x-axis labels:
import matplotlib.pyplot as plt

def on_pick(event):
    label = event.artist
    print(f"Clicked on label: {label.get_text()}")

fig, ax = plt.subplots()
ax.plot([1, 2, 3, 4], [1, 4, 2, 3], label='how2matplotlib.com')

ax.xaxis.set_pickradius(10)
for label in ax.get_xticklabels():
    label.set_picker(True)

fig.canvas.mpl_connect('pick_event', on_pick)

plt.title('Interactive X-axis Labels')
plt.show()
Output:
In this example, we set the pick radius for the x-axis to 10 points and make all x-axis tick labels pickable. We then connect a custom function (on_pick) to the pick event, which prints the text of the clicked label.
2. Enhancing Axis Line Interaction
The set_pickradius() function can also be used to make it easier to interact with axis lines. This can be particularly useful when creating custom tools or annotations that rely on axis selection.
Here’s an example that demonstrates how to create an interactive axis line:
import matplotlib.pyplot as plt

def on_pick(event):
    if event.artist == ax.xaxis:
        print("X-axis clicked")
    elif event.artist == ax.yaxis:
        print("Y-axis clicked")

fig, ax = plt.subplots()
ax.plot([1, 2, 3, 4], [1, 4, 2, 3], label='how2matplotlib.com')

ax.xaxis.set_pickradius(15)
ax.yaxis.set_pickradius(15)

ax.xaxis.set_picker(True)
ax.yaxis.set_picker(True)

fig.canvas.mpl_connect('pick_event', on_pick)

plt.title('Interactive Axis Lines')
plt.show()
Output:
In this example, we set the pick radius for both the x-axis and y-axis to 15 points and make them pickable. We then connect a custom function (on_pick) to the pick event, which prints a message indicating which axis was clicked.
3. Customizing Pick Radius for Different Plot Types
The Matplotlib.axis.Axis.set_pickradius() function can be particularly useful when working with different types of plots that may require varying levels of interactivity. Let’s explore how to customize the pick radius for different plot types.
Bar Plot Example
import matplotlib.pyplot as plt
import numpy as np

def on_pick(event):
    bar = event.artist
    height = bar.get_height()
    print(f"Clicked on bar with height: {height}")

fig, ax = plt.subplots()

x = np.arange(5)
y = [2, 4, 1, 5, 3]
bars = ax.bar(x, y, label='how2matplotlib.com')

ax.xaxis.set_pickradius(20)
for bar in bars:
    bar.set_picker(True)

fig.canvas.mpl_connect('pick_event', on_pick)

plt.title('Interactive Bar Plot')
plt.show()
Output:
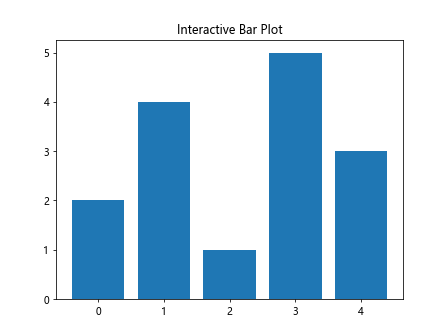
In this example, we create a bar plot and set the pick radius for the x-axis to 20 points. We make each bar pickable and connect a custom function (on_pick) to the pick event, which prints the height of the clicked bar.
Scatter Plot Example
import matplotlib.pyplot as plt
import numpy as np

def on_pick(event):
    ind = event.ind
    print(f"Clicked on point(s) with indices: {ind}")

fig, ax = plt.subplots()

x = np.random.rand(100)
y = np.random.rand(100)
scatter = ax.scatter(x, y, picker=True, label='how2matplotlib.com')

ax.xaxis.set_pickradius(10)
ax.yaxis.set_pickradius(10)

fig.canvas.mpl_connect('pick_event', on_pick)

plt.title('Interactive Scatter Plot')
plt.show()
Output:
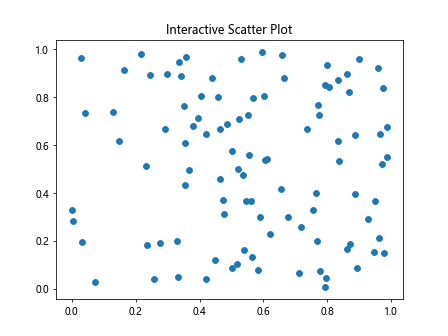
In this scatter plot example, we set the pick radius for both axes to 10 points. We make the scatter points pickable and connect a custom function (on_pick) to the pick event, which prints the indices of the clicked points.
Advanced Techniques with Matplotlib.axis.Axis.set_pickradius()
Now that we’ve covered the basics and some practical applications, let’s explore some advanced techniques using the Matplotlib.axis.Axis.set_pickradius() function.
1. Dynamic Pick Radius Adjustment
In some cases, you might want to adjust the pick radius dynamically based on user interaction or other factors. Here’s an example that demonstrates how to change the pick radius in response to a button click:
import matplotlib.pyplot as plt
from matplotlib.widgets import Button

fig, ax = plt.subplots()
ax.plot([1, 2, 3, 4], [1, 4, 2, 3], label='how2matplotlib.com')

ax.xaxis.set_pickradius(5)
ax.yaxis.set_pickradius(5)

def increase_radius(event):
    current_radius = ax.xaxis.get_pickradius()
    new_radius = current_radius + 5
    ax.xaxis.set_pickradius(new_radius)
    ax.yaxis.set_pickradius(new_radius)
    print(f"Pick radius increased to {new_radius}")
    plt.draw()

def decrease_radius(event):
    current_radius = ax.xaxis.get_pickradius()
    new_radius = max(1, current_radius - 5)
    ax.xaxis.set_pickradius(new_radius)
    ax.yaxis.set_pickradius(new_radius)
    print(f"Pick radius decreased to {new_radius}")
    plt.draw()

ax_increase = plt.axes([0.7, 0.05, 0.1, 0.075])
ax_decrease = plt.axes([0.81, 0.05, 0.1, 0.075])
btn_increase = Button(ax_increase, 'Increase')
btn_decrease = Button(ax_decrease, 'Decrease')

btn_increase.on_clicked(increase_radius)
btn_decrease.on_clicked(decrease_radius)

plt.title('Dynamic Pick Radius Adjustment')
plt.show()
Output:
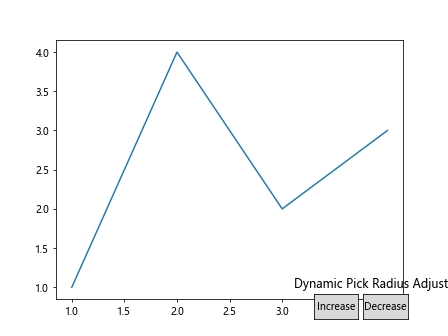
In this example, we create two buttons that allow the user to increase or decrease the pick radius for both axes. The pick radius is adjusted in real-time, and the plot is updated accordingly.
2. Combining Pick Radius with Custom Tooltips
The Matplotlib.axis.Axis.set_pickradius() function can be combined with other interactive features, such as custom tooltips, to create more informative and user-friendly plots. Here’s an example that demonstrates how to create a plot with custom tooltips that appear when hovering near axis tick labels:
import matplotlib.pyplot as plt
from matplotlib.widgets import Button

fig, ax = plt.subplots()
ax.plot([1, 2, 3, 4], [1, 4, 2, 3], label='how2matplotlib.com')

ax.xaxis.set_pickradius(10)
ax.yaxis.set_pickradius(10)

tooltip = ax.annotate("", xy=(0,0), xytext=(20,20), textcoords="offset points",
                      bbox=dict(boxstyle="round", fc="w"),
                      arrowprops=dict(arrowstyle="->"))
tooltip.set_visible(False)

def update_tooltip(event):
    if event.inaxes == ax:
        for label in ax.get_xticklabels() + ax.get_yticklabels():
            if label.contains(event)[0]:
                tooltip.xy = label.get_position()
                tooltip.set_text(f"Value: {label.get_text()}")
                tooltip.set_visible(True)
                fig.canvas.draw_idle()
                return
    tooltip.set_visible(False)
    fig.canvas.draw_idle()

fig.canvas.mpl_connect("motion_notify_event", update_tooltip)

plt.title('Custom Tooltips with Pick Radius')
plt.show()
Output:
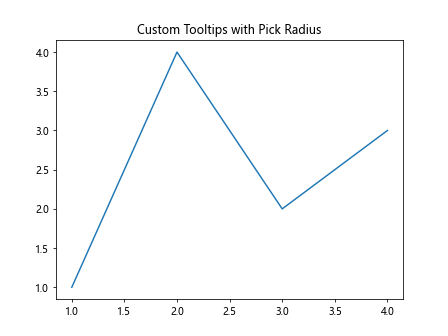
In this example, we create a custom tooltip that appears when the mouse hovers near axis tick labels. The pick radius is set to 10 points for both axes, making it easier to trigger the tooltip display.
3. Implementing Multi-level Interactivity
The Matplotlib.axis.Axis.set_pickradius() function can be used in conjunction with other interactive elements to create multi-level interactivity. Here’s an example that demonstrates how to create a plot with interactive axis labels and data points:
import matplotlib.pyplot as plt
import numpy as np

def on_pick(event):
    if isinstance(event.artist, plt.Line2D):
        thisline = event.artist
        xdata = thisline.get_xdata()
        ydata = thisline.get_ydata()
        ind = event.ind
        print(f'Clicked on point: x={xdata[ind][0]:.2f}, y={ydata[ind][0]:.2f}')
    elif isinstance(event.artist, plt.Text):
        label = event.artist
        print(f'Clicked on label: {label.get_text()}')

fig, ax = plt.subplots()

x = np.linspace(0, 10, 100)
y = np.sin(x)
line, = ax.plot(x, y, 'o', picker=5, label='how2matplotlib.com')

ax.xaxis.set_pickradius(10)
ax.yaxis.set_pickradius(10)

for label in ax.get_xticklabels() + ax.get_yticklabels():
    label.set_picker(True)

fig.canvas.mpl_connect('pick_event', on_pick)

plt.title('Multi-level Interactivity')
plt.show()
Output:
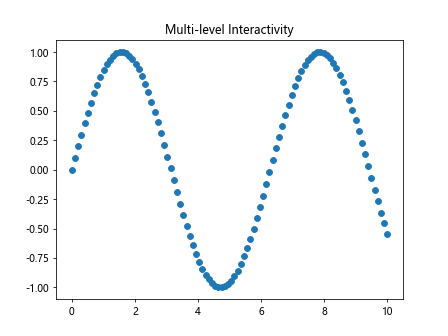
In this example, we create a plot with both interactive data points and axis labels. The pick radius is set to 10 points for both axes, making it easier to interact with the labels. The data points are also made pickable with a separate pick radius of 5 points. The on_pick function distinguishes between clicks on data points and axis labels, providing different information for each.
Best Practices and Considerations
When using the Matplotlib.axis.Axis.set_pickradius() function, there are several best practices and considerations to keep in mind:
- Choose an appropriate pick radius: The ideal pick radius depends on the specific plot and intended interaction. A larger radius makes it easier to select elements but may lead to unintended selections in dense plots.
Consider device differences: Remember that the pick radius is measured in points, which may translate differently on various devices and screen resolutions. Test your interactive plots on different devices to ensure a consistent user experience.
Combine with other interactive features: The set_pickradius() function works well in combination with other interactive Matplotlib features, such as event handling and widgets. Experiment with different combinations to create rich, interactive visualizations.
Use pick events judiciously: While interactive elements can enhance a plot, too many interactive features can be overwhelming or confusing for users. Strike a balance between interactivity and simplicity.
Provide visual feedback: When implementing interactive elements using set_pickradius(), consider providing visual feedback to users when they interact with the plot. This can include highlighting selected elements or displaying tooltips.
Document interactive features: If you’re creating plots for others to use, make sure to document the interactive features and how to use them. This can be done through plot titles, legends, or separate documentation.
Troubleshooting Common Issues
When working withthe Matplotlib.axis.Axis.set_pickradius() function, you may encounter some common issues. Here are some troubleshooting tips: