Comprehensive Guide to Matplotlib.axis.Axis.set_major_locator() Function in Python
Matplotlib.axis.Axis.set_major_locator() function in Python is a powerful tool for customizing the tick marks on your plot axes. This function allows you to control the placement and frequency of major tick marks, which can significantly enhance the readability and aesthetics of your visualizations. In this comprehensive guide, we’ll explore the ins and outs of the set_major_locator() function, providing detailed explanations and numerous examples to help you master this essential Matplotlib feature.
Understanding the Basics of Matplotlib.axis.Axis.set_major_locator()
The Matplotlib.axis.Axis.set_major_locator() function is a method of the Axis class in Matplotlib. It is used to set the locator for the major tick marks on an axis. A locator is an object that determines the positions of tick marks on an axis. By using set_major_locator(), you can customize how these major ticks are placed, which can be particularly useful when dealing with different types of data or when you want to emphasize certain aspects of your plot.
Let’s start with a simple example to illustrate the basic usage of set_major_locator():
import matplotlib.pyplot as plt
import numpy as np
from matplotlib.ticker import MultipleLocator

# Create some sample data
x = np.linspace(0, 10, 100)
y = np.sin(x)

# Create the plot
fig, ax = plt.subplots(figsize=(10, 6))
ax.plot(x, y, label='sin(x)')

# Set major locator
ax.xaxis.set_major_locator(MultipleLocator(2))

# Customize the plot
ax.set_title('Using set_major_locator() - how2matplotlib.com')
ax.set_xlabel('X-axis')
ax.set_ylabel('Y-axis')
ax.legend()

plt.show()
Output:
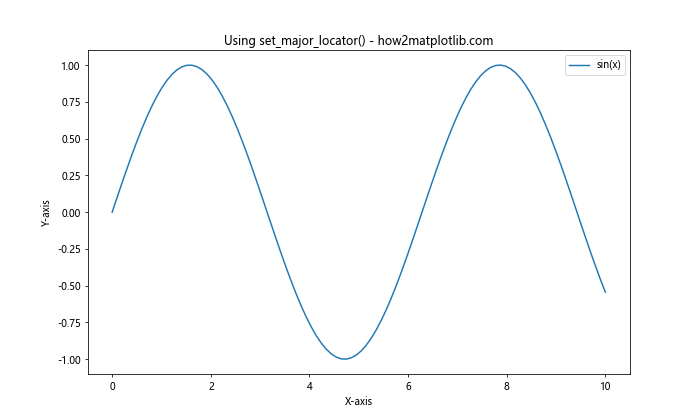
In this example, we’re using the MultipleLocator from Matplotlib’s ticker module to set major ticks at intervals of 2 on the x-axis. The set_major_locator() function is called on the xaxis of our Axes object (ax.xaxis), and we pass it an instance of MultipleLocator(2).
Types of Locators in Matplotlib
Matplotlib provides several types of locators that can be used with set_major_locator(). Each locator has its own behavior and is suitable for different scenarios. Let’s explore some of the most commonly used locators:
1. MultipleLocator
The MultipleLocator is used to place ticks at multiples of a given base value. This is particularly useful when you want evenly spaced ticks at specific intervals.
import matplotlib.pyplot as plt
import numpy as np
from matplotlib.ticker import MultipleLocator

x = np.linspace(0, 20, 100)
y = x**2

fig, ax = plt.subplots(figsize=(10, 6))
ax.plot(x, y)

# Set major locator to multiples of 5
ax.xaxis.set_major_locator(MultipleLocator(5))

ax.set_title('MultipleLocator Example - how2matplotlib.com')
ax.set_xlabel('X-axis')
ax.set_ylabel('Y-axis')

plt.show()
Output:
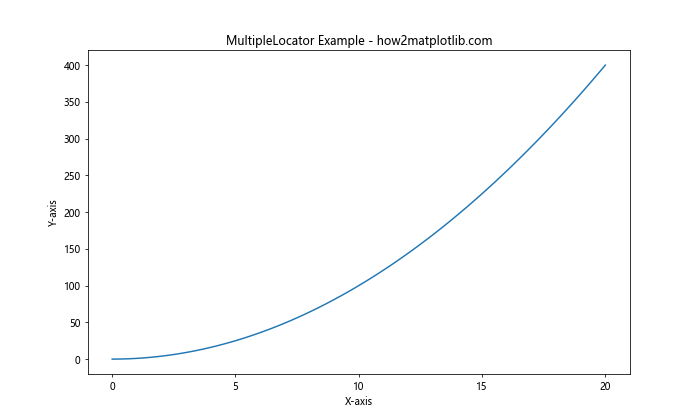
In this example, we’re setting major ticks at multiples of 5 on the x-axis. This creates evenly spaced ticks at 0, 5, 10, 15, and 20.
2. MaxNLocator
The MaxNLocator is used to generate a maximum number of intervals, trying to choose locations that are “nice” and don’t go beyond the axis limits.
import matplotlib.pyplot as plt
import numpy as np
from matplotlib.ticker import MaxNLocator

x = np.linspace(0, 10, 100)
y = np.exp(x)

fig, ax = plt.subplots(figsize=(10, 6))
ax.plot(x, y)

# Set major locator to a maximum of 6 ticks
ax.yaxis.set_major_locator(MaxNLocator(6))

ax.set_title('MaxNLocator Example - how2matplotlib.com')
ax.set_xlabel('X-axis')
ax.set_ylabel('Y-axis')

plt.show()
Output:
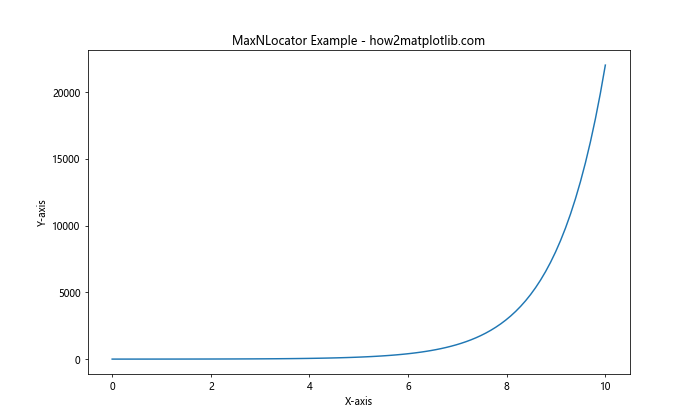
Here, we’re using MaxNLocator to set a maximum of 6 major ticks on the y-axis. Matplotlib will try to choose nice locations for these ticks within the data range.
3. AutoLocator
The AutoLocator is the default locator used by Matplotlib. It tries to choose a reasonable number of intervals by itself.
import matplotlib.pyplot as plt
import numpy as np
from matplotlib.ticker import AutoLocator

x = np.linspace(0, 100, 1000)
y = np.sin(x) * np.exp(-x/10)

fig, ax = plt.subplots(figsize=(10, 6))
ax.plot(x, y)

# Set major locator to AutoLocator (this is actually the default)
ax.xaxis.set_major_locator(AutoLocator())

ax.set_title('AutoLocator Example - how2matplotlib.com')
ax.set_xlabel('X-axis')
ax.set_ylabel('Y-axis')

plt.show()
Output:
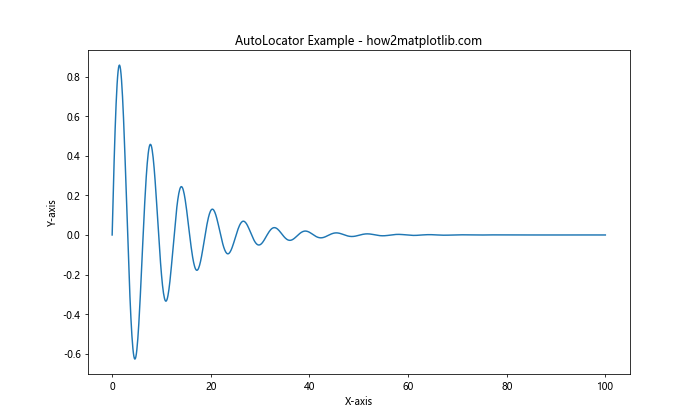
In this example, we’re explicitly setting the AutoLocator, although it’s worth noting that this is the default behavior if you don’t set any locator.
4. LinearLocator
The LinearLocator creates an exact number of evenly spaced ticks.
import matplotlib.pyplot as plt
import numpy as np
from matplotlib.ticker import LinearLocator

x = np.linspace(0, 10, 100)
y = x**3 - x**2 + x

fig, ax = plt.subplots(figsize=(10, 6))
ax.plot(x, y)

# Set major locator to 5 evenly spaced ticks
ax.xaxis.set_major_locator(LinearLocator(5))

ax.set_title('LinearLocator Example - how2matplotlib.com')
ax.set_xlabel('X-axis')
ax.set_ylabel('Y-axis')

plt.show()
Output:
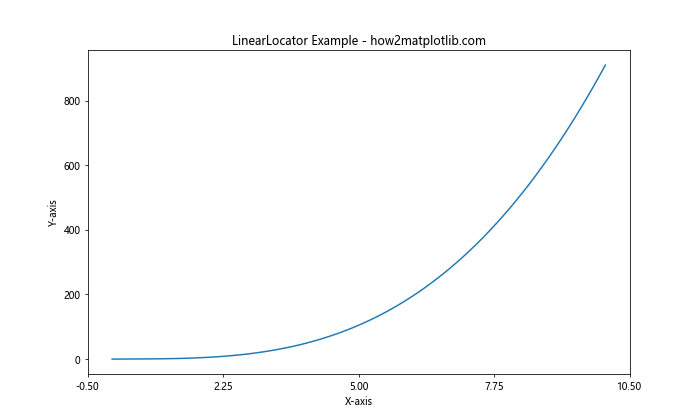
This example uses LinearLocator to create exactly 5 evenly spaced ticks on the x-axis, regardless of the data range.
5. LogLocator
The LogLocator is used for logarithmic scales, placing ticks at powers of the base.
import matplotlib.pyplot as plt
import numpy as np
from matplotlib.ticker import LogLocator

x = np.logspace(0, 3, 100)
y = x**2

fig, ax = plt.subplots(figsize=(10, 6))
ax.loglog(x, y)

# Set major locator for log scale
ax.xaxis.set_major_locator(LogLocator(base=10))

ax.set_title('LogLocator Example - how2matplotlib.com')
ax.set_xlabel('X-axis (log scale)')
ax.set_ylabel('Y-axis (log scale)')

plt.show()
Output:
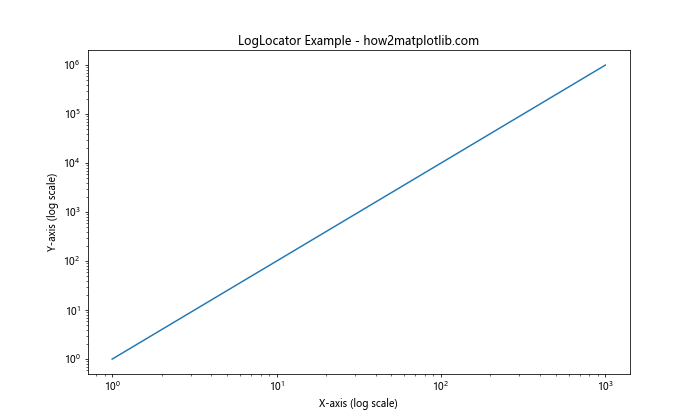
In this example, we’re using LogLocator with a base of 10 for the x-axis of a log-log plot.
Advanced Usage of set_major_locator()
Now that we’ve covered the basic locators, let’s explore some more advanced uses of the set_major_locator() function.
Combining Locators with Formatters
While locators determine the position of ticks, formatters control how the tick labels are displayed. You can combine set_major_locator() with set_major_formatter() for more control over your axis appearance.
import matplotlib.pyplot as plt
import numpy as np
from matplotlib.ticker import MultipleLocator, FuncFormatter

def currency_formatter(x, p):
    return f'${x:,.0f}'

x = np.linspace(0, 10000, 100)
y = x**2

fig, ax = plt.subplots(figsize=(10, 6))
ax.plot(x, y)

# Set major locator and formatter
ax.yaxis.set_major_locator(MultipleLocator(20000000))
ax.yaxis.set_major_formatter(FuncFormatter(currency_formatter))

ax.set_title('Combining Locators and Formatters - how2matplotlib.com')
ax.set_xlabel('X-axis')
ax.set_ylabel('Y-axis (USD)')

plt.show()
Output:
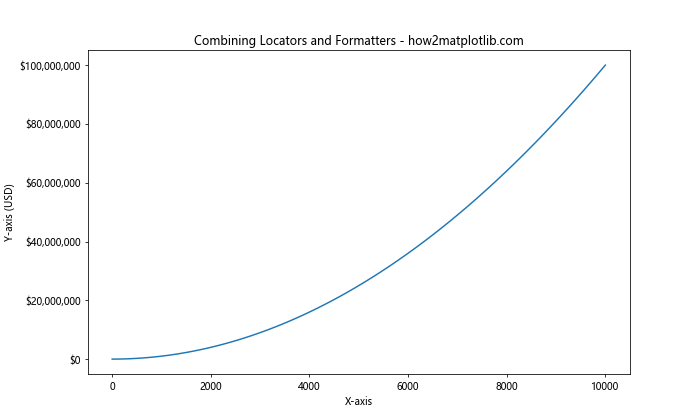
In this example, we’re using MultipleLocator to set ticks at multiples of 20,000,000 on the y-axis, and we’re using a custom formatter to display these values as currency.
Using set_major_locator() with Date Axes
When working with time series data, you can use specialized locators designed for dates.
import matplotlib.pyplot as plt
import numpy as np
from matplotlib.dates import DateLocator, AutoDateLocator, YearLocator, DateFormatter
import datetime

# Generate some sample date data
start_date = datetime.datetime(2020, 1, 1)
dates = [start_date + datetime.timedelta(days=i) for i in range(365*3)]  # 3 years of data
values = np.cumsum(np.random.randn(len(dates)))

fig, ax = plt.subplots(figsize=(12, 6))
ax.plot(dates, values)

# Set major locator to show ticks at the start of each year
ax.xaxis.set_major_locator(YearLocator())
ax.xaxis.set_major_formatter(DateFormatter('%Y'))

ax.set_title('Using set_major_locator() with Date Axes - how2matplotlib.com')
ax.set_xlabel('Date')
ax.set_ylabel('Value')

plt.xticks(rotation=45)
plt.tight_layout()
plt.show()
Output:
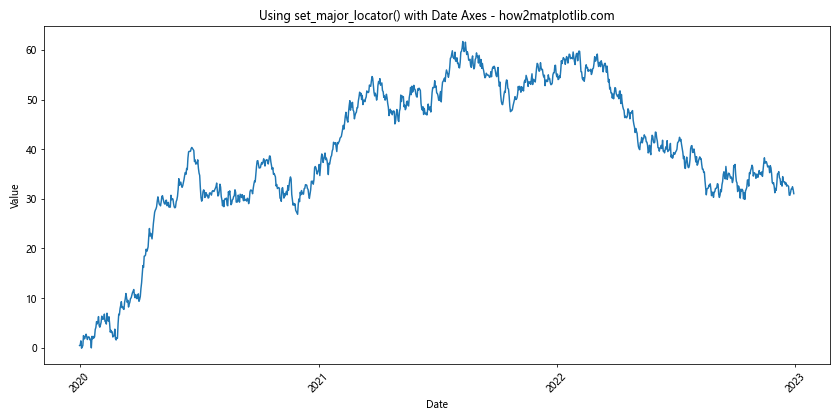
In this example, we’re using YearLocator to place ticks at the start of each year, and DateFormatter to format the tick labels as years.
Dynamic Locator Based on Data Range
Sometimes, you might want to adjust your locator based on the range of your data. Here’s an example of how to do this:
import matplotlib.pyplot as plt
import numpy as np
from matplotlib.ticker import MultipleLocator

def dynamic_locator(ax, x):
    range = np.ptp(x)
    if range < 10:
        ax.xaxis.set_major_locator(MultipleLocator(1))
    elif range < 50:
        ax.xaxis.set_major_locator(MultipleLocator(5))
    else:
        ax.xaxis.set_major_locator(MultipleLocator(10))

# Generate some sample data
x = np.linspace(0, 100, 1000)
y = np.sin(x)

fig, (ax1, ax2, ax3) = plt.subplots(3, 1, figsize=(10, 15))

# Plot with different x ranges
ax1.plot(x[:100], y[:100])
dynamic_locator(ax1, x[:100])
ax1.set_title('Dynamic Locator (Small Range) - how2matplotlib.com')

ax2.plot(x[:500], y[:500])
dynamic_locator(ax2, x[:500])
ax2.set_title('Dynamic Locator (Medium Range) - how2matplotlib.com')

ax3.plot(x, y)
dynamic_locator(ax3, x)
ax3.set_title('Dynamic Locator (Large Range) - how2matplotlib.com')

plt.tight_layout()
plt.show()
Output:
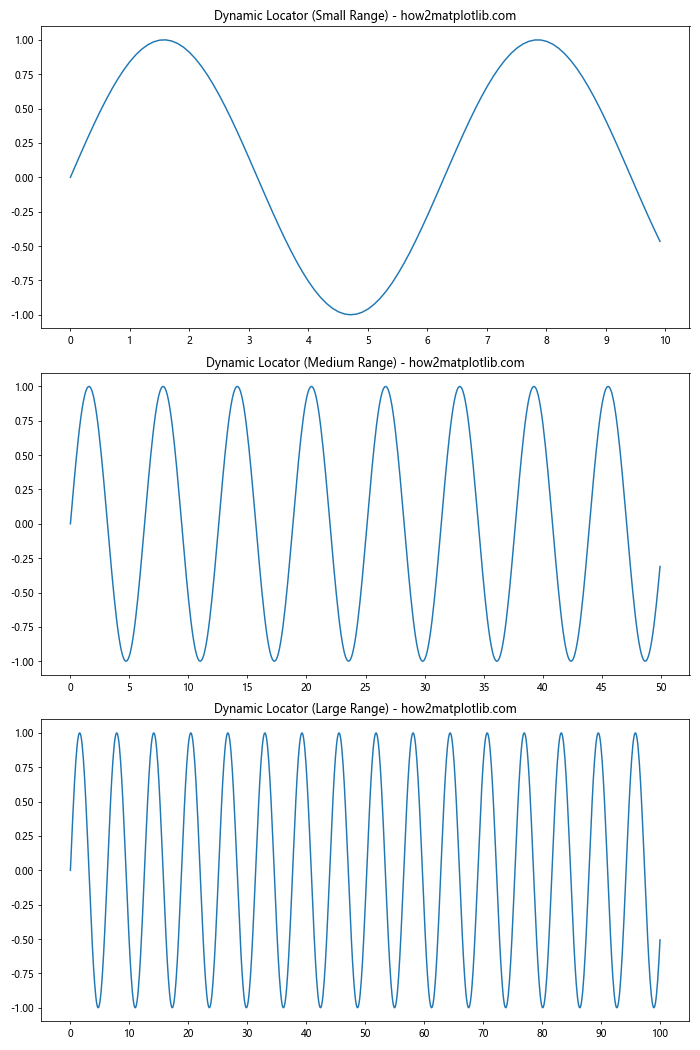
In this example, we define a function dynamic_locator that sets different MultipleLocators based on the range of the x data.
Common Pitfalls and How to Avoid Them
When using set_major_locator(), there are a few common issues that you might encounter. Let's discuss these and how to avoid them:
1. Too Many or Too Few Ticks
If you're not careful, you might end up with too many ticks, making your plot cluttered, or too few ticks, making it hard to read accurate values.
import matplotlib.pyplot as plt
import numpy as np
from matplotlib.ticker import MultipleLocator

x = np.linspace(0, 10, 100)
y = np.sin(x)

fig, (ax1, ax2, ax3) = plt.subplots(3, 1, figsize=(10, 15))

# Too many ticks
ax1.plot(x, y)
ax1.xaxis.set_major_locator(MultipleLocator(0.5))
ax1.set_title('Too Many Ticks - how2matplotlib.com')

# Too few ticks
ax2.plot(x, y)
ax2.xaxis.set_major_locator(MultipleLocator(5))
ax2.set_title('Too Few Ticks - how2matplotlib.com')

# Just right
ax3.plot(x, y)
ax3.xaxis.set_major_locator(MultipleLocator(2))
ax3.set_title('Appropriate Number of Ticks - how2matplotlib.com')

plt.tight_layout()
plt.show()
Output:
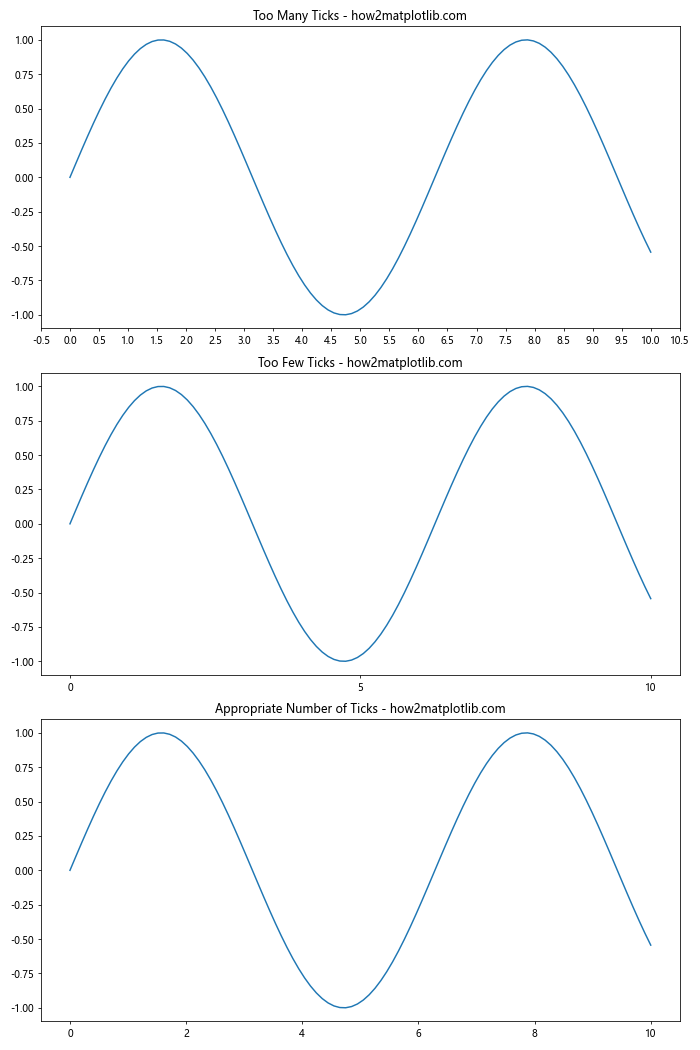
To avoid this, consider the range of your data and choose a locator that provides a reasonable number of ticks. You can also use MaxNLocator to set a maximum number of ticks.
2. Inconsistent Tick Spacing
When using certain locators, you might end up with inconsistent tick spacing, especially near the edges of your plot.
import matplotlib.pyplot as plt
import numpy as np
from matplotlib.ticker import AutoLocator, MultipleLocator

x = np.linspace(0, 10, 100)
y = np.sin(x)

fig, (ax1, ax2) = plt.subplots(2, 1, figsize=(10, 10))

# Inconsistent spacing with AutoLocator
ax1.plot(x, y)
ax1.xaxis.set_major_locator(AutoLocator())
ax1.set_title('Inconsistent Spacing with AutoLocator - how2matplotlib.com')

# Consistent spacing with MultipleLocator
ax2.plot(x, y)
ax2.xaxis.set_major_locator(MultipleLocator(2))
ax2.set_title('Consistent Spacing with MultipleLocator - how2matplotlib.com')

plt.tight_layout()
plt.show()
Output:
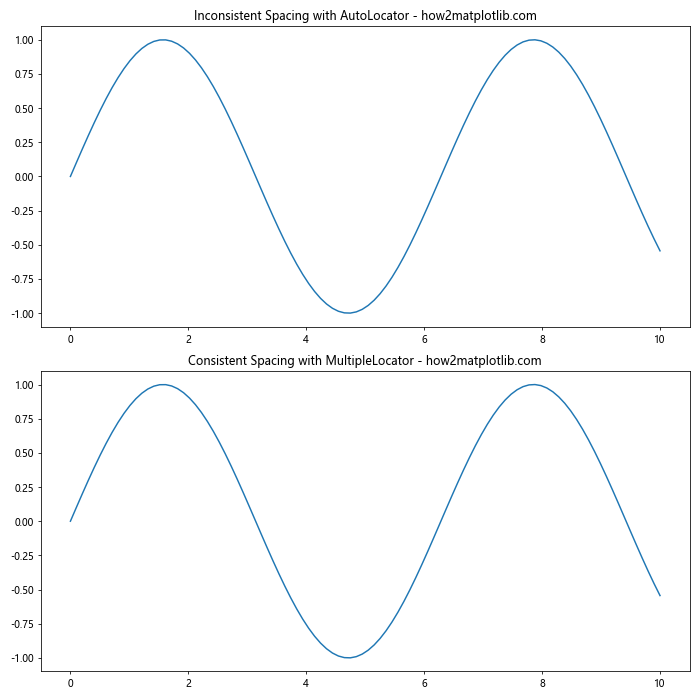
To ensure consistent spacing, consider using MultipleLocator or LinearLocator instead of AutoLocator.
3. Locator Not Respecting Axis Limits
Sometimes, a locator might place ticks outside the actual data range or axis limits.
import matplotlib.pyplot as plt
import numpy as np
from matplotlib.ticker import MultipleLocator

x = np.linspace(0, 9, 100)
y = np.sin(x)

fig, (ax1, ax2) = plt.subplots(2, 1, figsize=(10, 10))

# Locator not respecting axis limits
ax1.plot(x, y)
ax1.xaxis.set_major_locator(MultipleLocator(2))
ax1.set_title('Locator Not Respecting Axis Limits - how2matplotlib.com')

# Locator respecting axis limits
ax2.plot(x, y)
ax2.set_xlim(0, 9)  # Set x-axis limits explicitly
ax2.xaxis.set_major_locator(MultipleLocator(2))
ax2.set_title('Locator Respecting Axis Limits - how2matplotlib.com')

plt.tight_layout()
plt.show()
Output:
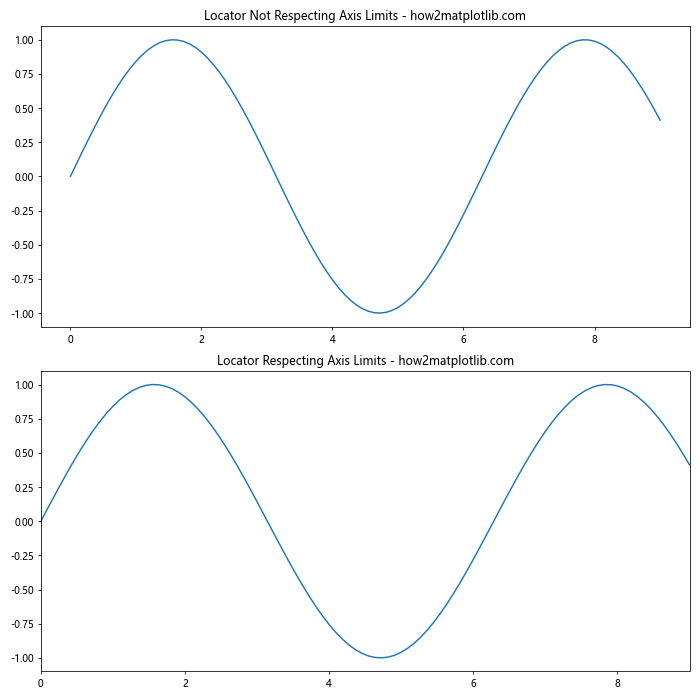
To avoid this, make sure to set your axis limits explicitly using set_xlim() or set_ylim() before applying the locator.
Best Practices for Using set_major_locator()
To make the most of the set_major_locator() function, consider the following best practices:
- Choose the appropriate locator for your data type (linear, logarithmic, date, etc.).
- Consider the range of your data when selecting a locator or its parameters.
- Use set_major_locator() in conjunction with set_minor_locator() for more detailed control.
- Combine locators with appropriate formatters for better readability.
- Always check your plot after applying a locator to ensure it looks as expected.
Let's look at an example that incorporates these best practices:
import matplotlib.pyplot as plt
import numpy as np
from matplotlib.ticker import MultipleLocator, AutoMinorLocator, FuncFormatter

def currency_formatter(x, p):
    return f'${x:,.0f}'

# Generate sample data
x = np.linspace(0, 100, 1000)
y = 1000 * np.exp(x/50)

fig, ax = plt.subplots(figsize=(12, 6))
ax.plot(x, y)

# Set major and minor locators
ax.xaxis.set_major_locator(MultipleLocator(20))
ax.xaxis.set_minor_locator(AutoMinorLocator())

ax.yaxis.set_major_locator(MultipleLocator(1000000))
ax.yaxis.set_major_formatter(FuncFormatter(currency_formatter))

# Customize the plot
ax.set_title('Best Practices for set_major_locator() - how2matplotlib.com')
ax.set_xlabel('Days')
ax.set_ylabel('Revenue')
ax.grid(which='major', linestyle='-', linewidth='0.5', color='red')
ax.grid(which='minor', linestyle=':', linewidth='0.5', color='black')

plt.tight_layout()
plt.show()
Output:
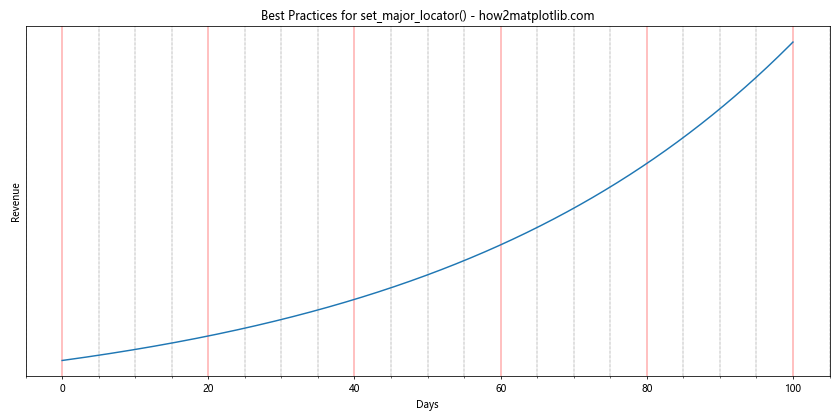
In this example, we've used MultipleLocator for both axes, combined with AutoMinorLocator for the x-axis. We've also used a custom formatter for the y-axis to display values as currency. The result is a clear, readable plot with well-spaced ticks and informative labels.
Advanced Techniques with set_major_locator()
Let's explore some advanced techniques that can be achieved using set_major_locator().
Custom Locator
While Matplotlib provides many built-in locators, sometimes you might need to create a custom locator for specific requirements. Here's an example of a custom locator that places ticks at Fibonacci numbers:
import matplotlib.pyplot as plt
import numpy as np
from matplotlib.ticker import Locator

class FibonacciLocator(Locator):
    def __init__(self, max_n):
        self.max_n = max_n

    def __call__(self):
        vmin, vmax = self.axis.get_view_interval()
        return [self.fib(n) for n in range(self.max_n) if vmin <= self.fib(n) <= vmax]

    def fib(self, n):
        if n < 2:
            return n
        return self.fib(n-1) + self.fib(n-2)

x = np.linspace(0, 100, 1000)
y = np.sin(x)

fig, ax = plt.subplots(figsize=(12, 6))
ax.plot(x, y)

ax.xaxis.set_major_locator(FibonacciLocator(10))

ax.set_title('Custom Fibonacci Locator - how2matplotlib.com')
ax.set_xlabel('Fibonacci Numbers')
ax.set_ylabel('sin(x)')

plt.show()
Output:
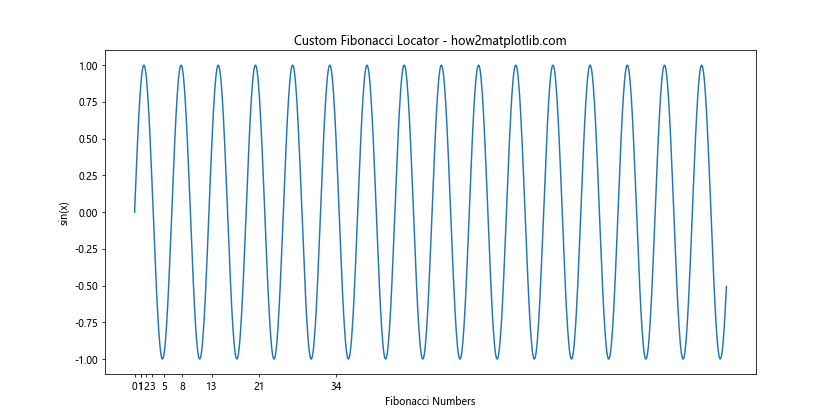
This custom locator places ticks at Fibonacci numbers within the visible range of the axis.
Troubleshooting Common Issues with set_major_locator()
Even with careful use, you might encounter some issues when working with set_major_locator(). Here are some common problems and their solutions:
1. Locator Not Updating After Changing Axis Limits
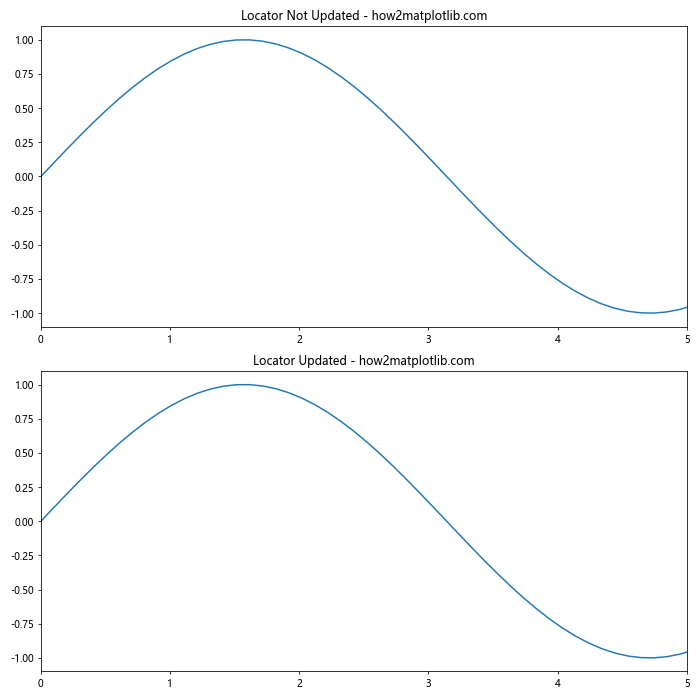
Sometimes, changing the axis limits after setting a locator doesn't update the tick positions. To fix this, you can explicitly call ax.relim() and ax.autoscale_view():
import matplotlib.pyplot as plt
import numpy as np
from matplotlib.ticker import MultipleLocator

x = np.linspace(0, 10, 100)
y = np.sin(x)

fig, (ax1, ax2) = plt.subplots(2, 1, figsize=(10, 10))

# Without updating
ax1.plot(x, y)
ax1.xaxis.set_major_locator(MultipleLocator(1))
ax1.set_xlim(0, 5)
ax1.set_title('Locator Not Updated - how2matplotlib.com')

# With updating
ax2.plot(x, y)
ax2.xaxis.set_major_locator(MultipleLocator(1))
ax2.set_xlim(0, 5)
ax2.relim()
ax2.autoscale_view()
ax2.set_title('Locator Updated - how2matplotlib.com')

plt.tight_layout()
plt.show()
Output:
2. Conflict Between Locator and Formatter
Sometimes, the locator and formatter might not work well together, resulting in odd-looking tick labels:
import matplotlib.pyplot as plt
import numpy as np
from matplotlib.ticker import MultipleLocator, FormatStrFormatter

x = np.linspace(0, 1, 100)
y = x**2

fig, (ax1, ax2) = plt.subplots(2, 1, figsize=(10, 10))

# Conflicting locator and formatter
ax1.plot(x, y)
ax1.xaxis.set_major_locator(MultipleLocator(0.1))
ax1.xaxis.set_major_formatter(FormatStrFormatter('%.2f'))
ax1.set_title('Conflicting Locator and Formatter - how2matplotlib.com')

# Matching locator and formatter
ax2.plot(x, y)
ax2.xaxis.set_major_locator(MultipleLocator(0.1))
ax2.xaxis.set_major_formatter(FormatStrFormatter('%.1f'))
ax2.set_title('Matching Locator and Formatter - how2matplotlib.com')

plt.tight_layout()
plt.show()
Output:
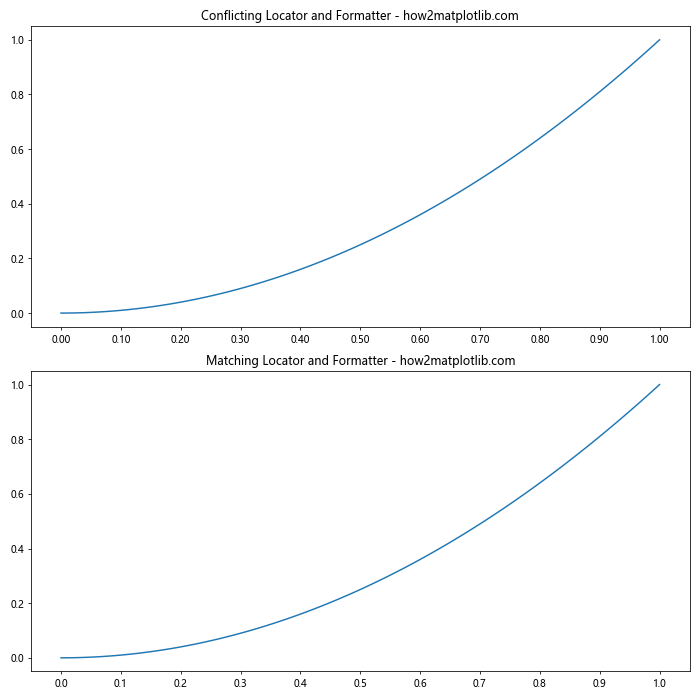
To fix this, ensure that your formatter matches the precision of your locator.
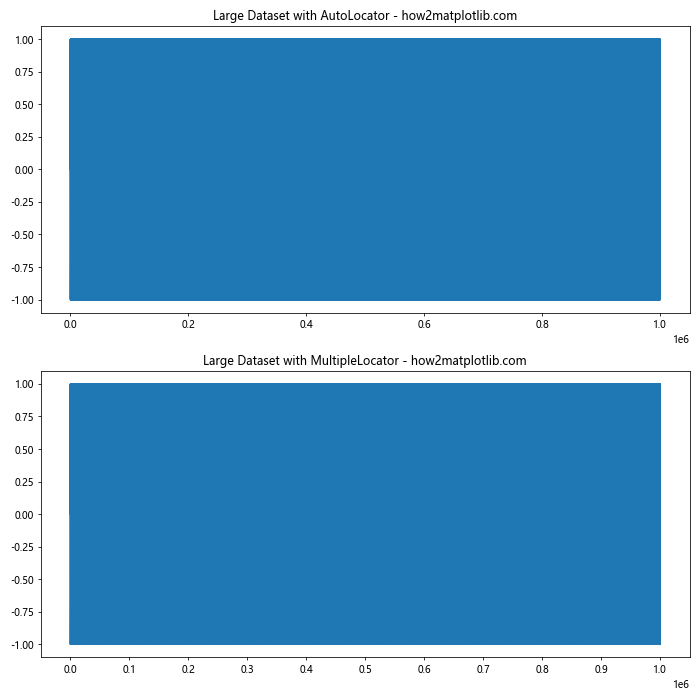
3. Performance Issues with Large Datasets
When working with large datasets, using certain locators can lead to performance issues. In such cases, it's often better to use simpler locators like MultipleLocator or manually specify tick locations:
import matplotlib.pyplot as plt
import numpy as np
from matplotlib.ticker import MultipleLocator, AutoLocator

# Generate a large dataset
x = np.linspace(0, 1000000, 10000000)
y = np.sin(x)

fig, (ax1, ax2) = plt.subplots(2, 1, figsize=(10, 10))

# Slower with AutoLocator
ax1.plot(x, y)
ax1.xaxis.set_major_locator(AutoLocator())
ax1.set_title('Large Dataset with AutoLocator - how2matplotlib.com')

# Faster with MultipleLocator
ax2.plot(x, y)
ax2.xaxis.set_major_locator(MultipleLocator(100000))
ax2.set_title('Large Dataset with MultipleLocator - how2matplotlib.com')

plt.tight_layout()
plt.show()
Output:
Conclusion
The Matplotlib.axis.Axis.set_major_locator() function is a powerful tool for customizing the appearance of your plots. By controlling the placement of major tick marks, you can significantly enhance the readability and effectiveness of your visualizations.