Comprehensive Guide to Matplotlib.axis.Axis.set_gid() Function in Python

Comprehensive Guide to Matplotlib.axis.Axis.set_gid() Function in Python

Matplotlib.axis.Axis.set_gid() function in Python is an essential tool for managing and organizing elements within Matplotlib plots. This function allows you to set a group id for an Axis object, which can be particularly useful when working with complex visualizations or when you need to manipulate specific elements of your plot programmatically. In this comprehensive guide, we’ll explore the Matplotlib.axis.Axis.set_gid() function in depth, covering its usage, benefits, and providing numerous examples to help you master this powerful feature.

Understanding the Basics of Matplotlib.axis.Axis.set_gid()

The Matplotlib.axis.Axis.set_gid() function is a method of the Axis class in Matplotlib. It’s used to set a group id (gid) for an Axis object. This gid can be used later to identify and manipulate the axis or its elements. Let’s start with a simple example to illustrate how to use the Matplotlib.axis.Axis.set_gid() function:

import matplotlib.pyplot as plt

fig, ax = plt.subplots()
ax.plot([1, 2, 3, 4], [1, 4, 2, 3])
ax.xaxis.set_gid('how2matplotlib.com_x_axis')
ax.yaxis.set_gid('how2matplotlib.com_y_axis')
plt.show()

Output:

Comprehensive Guide to Matplotlib.axis.Axis.set_gid() Function in Python

In this example, we create a simple line plot and use the Matplotlib.axis.Axis.set_gid() function to set group ids for both the x-axis and y-axis. The gids ‘how2matplotlib.com_x_axis’ and ‘how2matplotlib.com_y_axis’ can be used later to reference these specific axes.

Why Use Matplotlib.axis.Axis.set_gid()?

The Matplotlib.axis.Axis.set_gid() function provides several benefits when working with Matplotlib:

  1. Identification: It allows you to uniquely identify axes in complex plots with multiple subplots.
  2. Manipulation: You can easily manipulate specific axes using their gids.
  3. Styling: Group ids can be used for applying styles or transformations to specific axes.
  4. Interactivity: In interactive applications, gids can be used to handle user interactions with specific axes.

Let’s explore these benefits with more detailed examples.

Using Matplotlib.axis.Axis.set_gid() for Identification

When working with complex plots that have multiple subplots, the Matplotlib.axis.Axis.set_gid() function can be incredibly useful for identifying specific axes. Here’s an example:

import matplotlib.pyplot as plt

fig, (ax1, ax2) = plt.subplots(1, 2, figsize=(10, 5))

ax1.plot([1, 2, 3, 4], [1, 4, 2, 3])
ax1.set_title('Plot 1')
ax1.xaxis.set_gid('how2matplotlib.com_plot1_x')
ax1.yaxis.set_gid('how2matplotlib.com_plot1_y')

ax2.plot([1, 2, 3, 4], [3, 2, 4, 1])
ax2.set_title('Plot 2')
ax2.xaxis.set_gid('how2matplotlib.com_plot2_x')
ax2.yaxis.set_gid('how2matplotlib.com_plot2_y')

plt.tight_layout()
plt.show()

Output:

Comprehensive Guide to Matplotlib.axis.Axis.set_gid() Function in Python

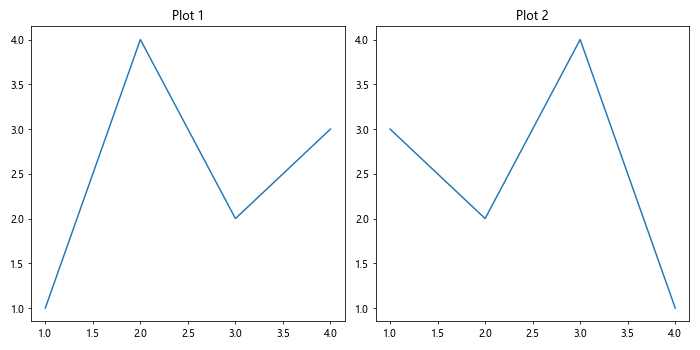
In this example, we create two subplots and use the Matplotlib.axis.Axis.set_gid() function to set unique gids for each axis. This makes it easy to identify and manipulate specific axes later in your code.

Manipulating Axes with Matplotlib.axis.Axis.set_gid()

Once you’ve set gids for your axes using the Matplotlib.axis.Axis.set_gid() function, you can easily manipulate them. Here’s an example that demonstrates how to change the color of a specific axis using its gid:

import matplotlib.pyplot as plt

fig, ax = plt.subplots()
ax.plot([1, 2, 3, 4], [1, 4, 2, 3])
ax.xaxis.set_gid('how2matplotlib.com_x_axis')
ax.yaxis.set_gid('how2matplotlib.com_y_axis')

# Change the color of the x-axis
for axis in fig.axes:
    if axis.xaxis.get_gid() == 'how2matplotlib.com_x_axis':
        axis.spines['bottom'].set_color('red')

plt.show()

Output:

Comprehensive Guide to Matplotlib.axis.Axis.set_gid() Function in Python

In this example, we use the gid set by Matplotlib.axis.Axis.set_gid() to identify the x-axis and change its color to red.

Styling Axes with Matplotlib.axis.Axis.set_gid()

The Matplotlib.axis.Axis.set_gid() function can also be used to apply styles to specific axes. Here’s an example that demonstrates how to change the font size of tick labels for a specific axis:

import matplotlib.pyplot as plt

fig, ax = plt.subplots()
ax.plot([1, 2, 3, 4], [1, 4, 2, 3])
ax.xaxis.set_gid('how2matplotlib.com_x_axis')
ax.yaxis.set_gid('how2matplotlib.com_y_axis')

# Change the font size of y-axis tick labels
for axis in fig.axes:
    if axis.yaxis.get_gid() == 'how2matplotlib.com_y_axis':
        axis.tick_params(axis='y', labelsize=14)

plt.show()

Output:

Comprehensive Guide to Matplotlib.axis.Axis.set_gid() Function in Python

In this example, we use the gid set by Matplotlib.axis.Axis.set_gid() to identify the y-axis and increase the font size of its tick labels.

Using Matplotlib.axis.Axis.set_gid() for Interactivity

The Matplotlib.axis.Axis.set_gid() function can be particularly useful when creating interactive plots. Here’s an example that demonstrates how to create a plot where clicking on an axis changes its color:

import matplotlib.pyplot as plt

fig, ax = plt.subplots()
ax.plot([1, 2, 3, 4], [1, 4, 2, 3])
ax.xaxis.set_gid('how2matplotlib.com_x_axis')
ax.yaxis.set_gid('how2matplotlib.com_y_axis')

def on_click(event):
    if event.inaxes:
        if event.inaxes.xaxis.get_gid() == 'how2matplotlib.com_x_axis':
            event.inaxes.spines['bottom'].set_color('red')
        elif event.inaxes.yaxis.get_gid() == 'how2matplotlib.com_y_axis':
            event.inaxes.spines['left'].set_color('blue')
    fig.canvas.draw()

fig.canvas.mpl_connect('button_press_event', on_click)
plt.show()

Output:

Comprehensive Guide to Matplotlib.axis.Axis.set_gid() Function in Python

In this interactive example, we use the gids set by Matplotlib.axis.Axis.set_gid() to identify which axis was clicked and change its color accordingly.

Advanced Usage of Matplotlib.axis.Axis.set_gid()

The Matplotlib.axis.Axis.set_gid() function can be used in more advanced scenarios as well. Let’s explore some of these use cases.

Using Matplotlib.axis.Axis.set_gid() with Multiple Subplots

When working with multiple subplots, the Matplotlib.axis.Axis.set_gid() function can help you manage and manipulate axes across different subplots. Here’s an example:

import matplotlib.pyplot as plt

fig, ((ax1, ax2), (ax3, ax4)) = plt.subplots(2, 2, figsize=(10, 10))

axes = [ax1, ax2, ax3, ax4]
for i, ax in enumerate(axes, 1):
    ax.plot([1, 2, 3, 4], [1, 4, 2, 3])
    ax.set_title(f'Plot {i}')
    ax.xaxis.set_gid(f'how2matplotlib.com_plot{i}_x')
    ax.yaxis.set_gid(f'how2matplotlib.com_plot{i}_y')

# Change color of all x-axes
for ax in fig.axes:
    if 'x' in ax.xaxis.get_gid():
        ax.spines['bottom'].set_color('red')

plt.tight_layout()
plt.show()

Output:

Comprehensive Guide to Matplotlib.axis.Axis.set_gid() Function in Python

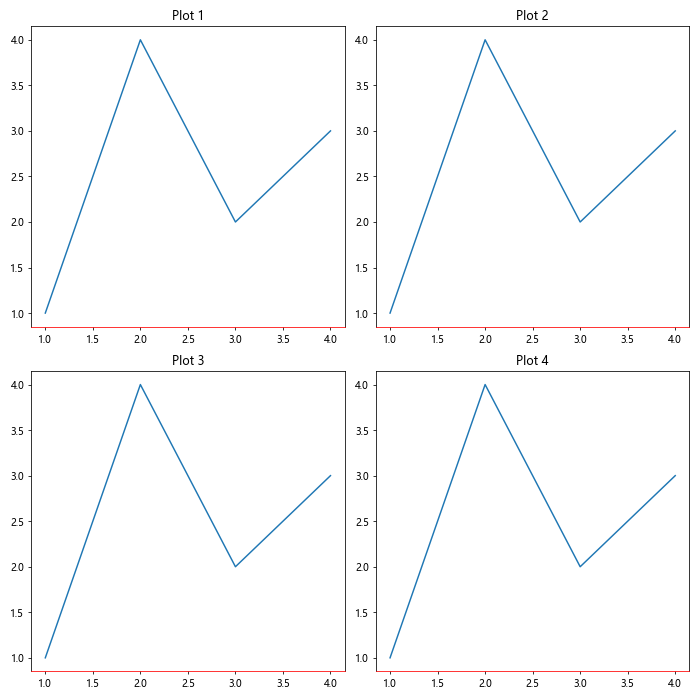
In this example, we create four subplots and use Matplotlib.axis.Axis.set_gid() to set unique gids for each axis. We then use these gids to change the color of all x-axes across all subplots.

Using Matplotlib.axis.Axis.set_gid() with Custom Tick Formatters

The Matplotlib.axis.Axis.set_gid() function can be combined with custom tick formatters to create more complex visualizations. Here’s an example:

import matplotlib.pyplot as plt
import matplotlib.ticker as ticker

fig, ax = plt.subplots()
ax.plot([1, 2, 3, 4], [1, 4, 2, 3])
ax.xaxis.set_gid('how2matplotlib.com_x_axis')
ax.yaxis.set_gid('how2matplotlib.com_y_axis')

def custom_formatter(x, pos):
    return f'Value: {x:.2f}'

for axis in fig.axes:
    if axis.yaxis.get_gid() == 'how2matplotlib.com_y_axis':
        axis.yaxis.set_major_formatter(ticker.FuncFormatter(custom_formatter))

plt.show()

Output:

Comprehensive Guide to Matplotlib.axis.Axis.set_gid() Function in Python

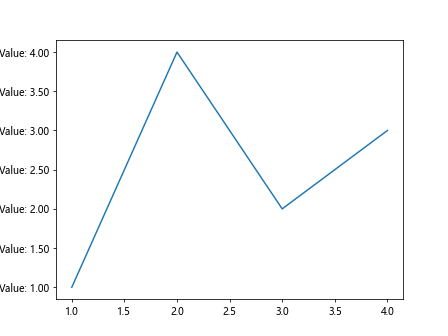
In this example, we use Matplotlib.axis.Axis.set_gid() to identify the y-axis and apply a custom tick formatter to it.

Using Matplotlib.axis.Axis.set_gid() with Logarithmic Scales

The Matplotlib.axis.Axis.set_gid() function can be useful when working with different scale types, such as logarithmic scales. Here’s an example:

import matplotlib.pyplot as plt
import numpy as np

fig, ax = plt.subplots()
x = np.logspace(0, 2, 100)
ax.semilogx(x, np.sqrt(x))
ax.xaxis.set_gid('how2matplotlib.com_log_x')
ax.yaxis.set_gid('how2matplotlib.com_linear_y')

# Add grid lines only to the x-axis
for axis in fig.axes:
    if axis.xaxis.get_gid() == 'how2matplotlib.com_log_x':
        axis.grid(True, axis='x', which='both', linestyle='--', color='gray')

plt.show()

Output:

Comprehensive Guide to Matplotlib.axis.Axis.set_gid() Function in Python

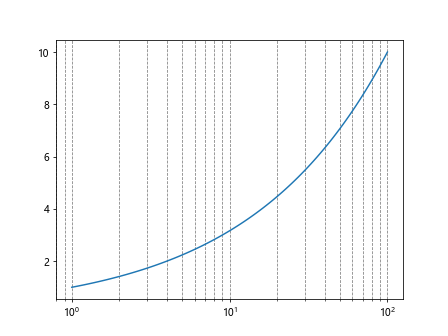
In this example, we create a semilog plot and use Matplotlib.axis.Axis.set_gid() to identify the logarithmic x-axis. We then use this gid to add grid lines only to the x-axis.

Best Practices for Using Matplotlib.axis.Axis.set_gid()

When using the Matplotlib.axis.Axis.set_gid() function, it’s important to follow some best practices to ensure your code is clean, efficient, and maintainable:

  1. Use descriptive gids: Choose gid names that clearly describe the axis or its purpose. For example, ‘how2matplotlib.com_temperature_x’ is more descriptive than ‘x1’.

  2. Be consistent: Use a consistent naming convention for your gids across your project.

  3. Document your gids: If you’re using many gids in a complex project, consider maintaining a list of gids and their purposes in your documentation.

  4. Avoid hardcoding: Instead of hardcoding gid strings throughout your code, consider using constants or a configuration file.

  5. Check for gid existence: Before manipulating an axis based on its gid, check if the gid exists to avoid errors.

Here’s an example that demonstrates these best practices:

import matplotlib.pyplot as plt

# Constants for gids
X_AXIS_GID = 'how2matplotlib.com_temperature_x'
Y_AXIS_GID = 'how2matplotlib.com_humidity_y'

fig, ax = plt.subplots()
ax.plot([1, 2, 3, 4], [30, 35, 32, 38], label='Temperature')
ax.plot([1, 2, 3, 4], [50, 55, 52, 58], label='Humidity')
ax.xaxis.set_gid(X_AXIS_GID)
ax.yaxis.set_gid(Y_AXIS_GID)

ax.set_xlabel('Time')
ax.set_ylabel('Value')
ax.legend()

# Function to safely manipulate axis based on gid
def set_axis_color(axes, gid, color):
    for axis in axes:
        if axis.xaxis.get_gid() == gid:
            axis.spines['bottom'].set_color(color)
        elif axis.yaxis.get_gid() == gid:
            axis.spines['left'].set_color(color)

set_axis_color(fig.axes, X_AXIS_GID, 'red')
set_axis_color(fig.axes, Y_AXIS_GID, 'blue')

plt.show()

Output:

Comprehensive Guide to Matplotlib.axis.Axis.set_gid() Function in Python

In this example, we use constants for gid names, create a function to safely manipulate axes based on their gids, and use descriptive names for our gids.

Common Pitfalls and How to Avoid Them

When using the Matplotlib.axis.Axis.set_gid() function, there are some common pitfalls that you should be aware of:

  1. Overwriting gids: If you set a gid for an axis that already has one, the old gid will be overwritten. Always check if a gid exists before setting a new one if you want to avoid this.

  2. Case sensitivity: Gids are case-sensitive. ‘How2matplotlib.com_x_axis’ and ‘how2matplotlib.com_x_axis’ are treated as different gids.

  3. Forgetting to set gids: If you forget to set a gid for an axis, any code that relies on that gid will fail silently.

  4. Using non-string gids: The gid should always be a string. Using other types may lead to unexpected behavior.

Here’s an example that demonstrates how to avoid these pitfalls:

import matplotlib.pyplot as plt

fig, ax = plt.subplots()
ax.plot([1, 2, 3, 4], [1, 4, 2, 3])

# Check if gid exists before setting
if ax.xaxis.get_gid() is None:
    ax.xaxis.set_gid('how2matplotlib.com_x_axis')
else:
    print(f"X-axis already has gid: {ax.xaxis.get_gid()}")

# Use lowercase for consistency
ax.yaxis.set_gid('how2matplotlib.com_y_axis')

# Always use string gids
try:
    ax.xaxis.set_gid(123)  # This will raise a TypeError
except TypeError:
    print("Gid must be a string")
    ax.xaxis.set_gid('123')

# Check if gid exists before manipulating
for axis in fig.axes:
    if axis.xaxis.get_gid() == 'how2matplotlib.com_x_axis':
        axis.spines['bottom'].set_color('red')
    elif axis.yaxis.get_gid() == 'how2matplotlib.com_y_axis':
        axis.spines['left'].set_color('blue')

plt.show()

Output:

Comprehensive Guide to Matplotlib.axis.Axis.set_gid() Function in Python

This example demonstrates how to check for existing gids, use consistent lowercase gids, handle non-string gid attempts, and safely manipulate axes based on their gids.

Matplotlib.axis.Axis.set_gid() in Complex Visualizations

The Matplotlib.axis.Axis.set_gid() function becomes particularly powerful when working with complex visualizations. Let’s explore some advanced scenarios where this function can be incredibly useful.

Using Matplotlib.axis.Axis.set_gid() with 3D Plots

The Matplotlib.axis.Axis.set_gid() function can also be used with 3D plots. Here’s an example:

import matplotlib.pyplot as plt
from mpl_toolkits.mplot3d import Axes3D
import numpy as np

fig = plt.figure()
ax = fig.add_subplot(111, projection='3d')

x = np.arange(-5, 5, 0.25)
y = np.arange(-5, 5, 0.25)
X, Y = np.meshgrid(x, y)
Z = np.sin(np.sqrt(X**2 + Y**2))

surf = ax.plot_surface(X, Y, Z)

ax.xaxis.set_gid('how2matplotlib.com_3d_x')
ax.yaxis.set_gid('how2matplotlib.com_3d_y')
ax.zaxis.set_gid('how2matplotlib.com_3d_z')

# Change color of z-axis
for axis in fig.axes:
    if axis.zaxis.get_gid() == 'how2matplotlib.com_3d_z':
        axis.zaxis.line.set_color('red')
        axis.zaxis.set_pane_color((0.8, 0.8, 1.0, 0.1))

plt.show()

Output:

Comprehensive Guide to Matplotlib.axis.Axis.set_gid() Function in Python

In this example, we create a 3D surface plot and use Matplotlib.axis.Axis.set_gid() to set gids for all three axes. We then use the gid of the z-axis to change its color and the color of its pane.

Using Matplotlib.axis.Axis.set_gid() with Polar Plots

The Matplotlib.axis.Axis.set_gid() function can also be used with polar plots. Here’s an example:

import matplotlib.pyplot as plt
import numpy as np

fig, ax = plt.subplots(subplot_kw=dict(projection='polar'))
r = np.arange(0, 2, 0.01)
theta = 2 * np.pi * r
ax.plot(theta, r)

ax.xaxis.set_gid('how2matplotlib.com_polar_theta')
ax.yaxis.set_gid('how2matplotlib.com_polar_r')

# Change color of radial axis
for axis in fig.axes:
    if axis.yaxis.get_gid() == 'how2matplotlib.com_polar_r':
        axis.yaxis.set_tick_params(colors='red')

plt.show()

Output:

Comprehensive Guide to Matplotlib.axis.Axis.set_gid() Function in Python

In this example, we create a polar plot and use Matplotlib.axis.Axis.set_gid() to set gids for the theta and r axes. We then use the gid of the r-axis to change the color of its tick labels.

Using Matplotlib.axis.Axis.set_gid() with Subplots and Shared Axes

The Matplotlib.axis.Axis.set_gid() function can be particularly useful when working with subplots that have shared axes. Here’s an example:

import matplotlib.pyplot as plt
import numpy as np

fig, (ax1, ax2) = plt.subplots(2, 1, sharex=True)

x = np.linspace(0, 2*np.pi, 100)
ax1.plot(x, np.sin(x))
ax2.plot(x, np.cos(x))

ax1.xaxis.set_gid('how2matplotlib.com_shared_x')
ax1.yaxis.set_gid('how2matplotlib.com_sin_y')
ax2.yaxis.set_gid('how2matplotlib.com_cos_y')

# Change color of shared x-axis
for axis in fig.axes:
    if axis.xaxis.get_gid() == 'how2matplotlib.com_shared_x':
        axis.xaxis.label.set_color('red')
        axis.tick_params(axis='x', colors='red')

plt.show()

Output:

Comprehensive Guide to Matplotlib.axis.Axis.set_gid() Function in Python

In this example, we create two subplots with a shared x-axis. We use Matplotlib.axis.Axis.set_gid() to set a gid for the shared x-axis and separate gids for the y-axes. We then use the gid of the shared x-axis to change its color.

Combining Matplotlib.axis.Axis.set_gid() with Other Matplotlib Features

The Matplotlib.axis.Axis.set_gid() function can be combined with other Matplotlib features to create even more powerful visualizations. Let’s explore some of these combinations.

Using Matplotlib.axis.Axis.set_gid() with Custom Ticks

You can combine the Matplotlib.axis.Axis.set_gid() function with custom ticks to create more informative plots. Here’s an example:

import matplotlib.pyplot as plt
import numpy as np

fig, ax = plt.subplots()
x = np.linspace(0, 2*np.pi, 100)
y = np.sin(x)
ax.plot(x, y)

ax.xaxis.set_gid('how2matplotlib.com_custom_x')
ax.yaxis.set_gid('how2matplotlib.com_custom_y')

# Custom ticks for x-axis
for axis in fig.axes:
    if axis.xaxis.get_gid() == 'how2matplotlib.com_custom_x':
        axis.set_xticks([0, np.pi/2, np.pi, 3*np.pi/2, 2*np.pi])
        axis.set_xticklabels(['0', 'π/2', 'π', '3π/2', '2π'])

plt.show()

Output:

Comprehensive Guide to Matplotlib.axis.Axis.set_gid() Function in Python

In this example, we use Matplotlib.axis.Axis.set_gid() to identify the x-axis and then set custom ticks and labels for it.

Using Matplotlib.axis.Axis.set_gid() with Annotations

The Matplotlib.axis.Axis.set_gid() function can be used in conjunction with annotations to create more informative plots. Here’s an example:

import matplotlib.pyplot as plt
import numpy as np

fig, ax = plt.subplots()
x = np.linspace(0, 10, 100)
y = np.sin(x)
ax.plot(x, y)

ax.xaxis.set_gid('how2matplotlib.com_annotated_x')
ax.yaxis.set_gid('how2matplotlib.com_annotated_y')

# Add annotation to y-axis
for axis in fig.axes:
    if axis.yaxis.get_gid() == 'how2matplotlib.com_annotated_y':
        axis.annotate('Peak', xy=(np.pi/2, 1), xytext=(4, 0.8),
                      arrowprops=dict(facecolor='black', shrink=0.05))

plt.show()

Output:

Comprehensive Guide to Matplotlib.axis.Axis.set_gid() Function in Python

In this example, we use Matplotlib.axis.Axis.set_gid() to identify the y-axis and then add an annotation to it.

Using Matplotlib.axis.Axis.set_gid() with Colorbars

The Matplotlib.axis.Axis.set_gid() function can also be used with colorbars. Here’s an example:

import matplotlib.pyplot as plt
import numpy as np

fig, ax = plt.subplots()
data = np.random.rand(10, 10)
im = ax.imshow(data)

ax.xaxis.set_gid('how2matplotlib.com_colorbar_x')
ax.yaxis.set_gid('how2matplotlib.com_colorbar_y')

cbar = fig.colorbar(im)
cbar.ax.yaxis.set_gid('how2matplotlib.com_colorbar_axis')

# Change colorbar tick color
for axis in fig.axes:
    if axis.yaxis.get_gid() == 'how2matplotlib.com_colorbar_axis':
        axis.yaxis.set_tick_params(colors='red')

plt.show()

Output:

Comprehensive Guide to Matplotlib.axis.Axis.set_gid() Function in Python

In this example, we create a heatmap with a colorbar and use Matplotlib.axis.Axis.set_gid() to set a gid for the colorbar’s axis. We then use this gid to change the color of the colorbar’s ticks.

Troubleshooting Common Issues with Matplotlib.axis.Axis.set_gid()

When working with the Matplotlib.axis.Axis.set_gid() function, you might encounter some issues. Here are some common problems and how to solve them:

  1. Gid not being recognized:
    If you set a gid but it’s not being recognized when you try to use it, make sure you’re checking for the gid on the correct axis object. Remember that x-axis and y-axis have separate gids.

  2. Changes not appearing:
    If you make changes based on a gid but don’t see the results, remember to call plt.draw() or fig.canvas.draw() to update the plot.

  3. Gid being overwritten:
    If you’re working with a complex plot and find that your gids are being overwritten, make sure you’re not accidentally setting the same gid multiple times.

Here’s an example that demonstrates how to handle these issues:

import matplotlib.pyplot as plt

fig, ax = plt.subplots()
ax.plot([1, 2, 3, 4], [1, 4, 2, 3])

# Set gids
ax.xaxis.set_gid('how2matplotlib.com_x')
ax.yaxis.set_gid('how2matplotlib.com_y')

# Check if gid is set correctly
print(f"X-axis gid: {ax.xaxis.get_gid()}")
print(f"Y-axis gid: {ax.yaxis.get_gid()}")

# Make changes based on gid
for axis in fig.axes:
    if axis.xaxis.get_gid() == 'how2matplotlib.com_x':
        axis.xaxis.label.set_color('red')
    if axis.yaxis.get_gid() == 'how2matplotlib.com_y':
        axis.yaxis.label.set_color('blue')

# Update the plot
fig.canvas.draw()

plt.show()

Output:

Comprehensive Guide to Matplotlib.axis.Axis.set_gid() Function in Python

This example demonstrates how to check if gids are set correctly, how to make changes based on gids, and how to update the plot to see the changes.

Conclusion

The Matplotlib.axis.Axis.set_gid() function is a powerful tool in the Matplotlib library that allows for precise control and manipulation of plot axes. By setting group ids for axes, you can easily identify and modify specific elements of your plots, making it easier to create complex and customized visualizations.

Throughout this comprehensive guide, we’ve explored various aspects of the Matplotlib.axis.Axis.set_gid() function, including:

  • Basic usage and understanding of the function
  • Benefits of using set_gid()
  • Advanced usage scenarios, including working with multiple subplots, 3D plots, and polar plots
  • Combining set_gid() with other Matplotlib features
  • Best practices for using set_gid()
  • Common pitfalls and how to avoid them
  • Troubleshooting common issues
Like(0)

Matplotlib Articles