Comprehensive Guide to Matplotlib.axis.Axis.set_figure() Function in Python
Matplotlib.axis.Axis.set_figure() function in Python is a crucial component of the Matplotlib library, specifically within the axis module. This function plays a vital role in managing and manipulating axis figures in data visualization. In this comprehensive guide, we’ll explore the Matplotlib.axis.Axis.set_figure() function in depth, covering its usage, parameters, and practical applications in various scenarios.
Understanding the Basics of Matplotlib.axis.Axis.set_figure()
The Matplotlib.axis.Axis.set_figure() function is designed to set the parent figure for an axis. This function is particularly useful when you need to associate an axis with a specific figure, especially in cases where you’re working with multiple figures or subplots. Let’s start with a simple example to illustrate its basic usage:
import matplotlib.pyplot as plt

# Create a new figure
fig = plt.figure(figsize=(8, 6))

# Create an axis
ax = plt.axes()

# Use set_figure() to associate the axis with the figure
ax.xaxis.set_figure(fig)
ax.yaxis.set_figure(fig)

# Plot some data
x = [1, 2, 3, 4, 5]
y = [2, 4, 6, 8, 10]
ax.plot(x, y, label='how2matplotlib.com')

plt.title('Basic Usage of Matplotlib.axis.Axis.set_figure()')
plt.legend()
plt.show()
Output:
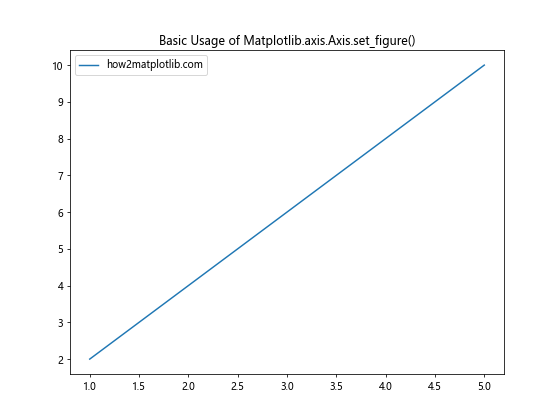
In this example, we create a figure and an axis, then use the Matplotlib.axis.Axis.set_figure() function to associate both the x-axis and y-axis with the figure. This ensures that the axis is properly linked to the figure for further manipulations.
Exploring the Parameters of Matplotlib.axis.Axis.set_figure()
The Matplotlib.axis.Axis.set_figure() function has a single parameter:
fig: This parameter accepts a Figure instance to which the axis should be associated.
Let’s look at an example that demonstrates how to use this parameter effectively:
import matplotlib.pyplot as plt

# Create two figures
fig1 = plt.figure(figsize=(8, 6))
fig2 = plt.figure(figsize=(10, 8))

# Create axes for both figures
ax1 = fig1.add_subplot(111)
ax2 = fig2.add_subplot(111)

# Use set_figure() to associate axes with figures
ax1.xaxis.set_figure(fig1)
ax1.yaxis.set_figure(fig1)
ax2.xaxis.set_figure(fig2)
ax2.yaxis.set_figure(fig2)

# Plot data on both figures
x = [1, 2, 3, 4, 5]
y1 = [2, 4, 6, 8, 10]
y2 = [1, 3, 5, 7, 9]

ax1.plot(x, y1, label='Figure 1 - how2matplotlib.com')
ax2.plot(x, y2, label='Figure 2 - how2matplotlib.com')

ax1.set_title('Figure 1 with Matplotlib.axis.Axis.set_figure()')
ax2.set_title('Figure 2 with Matplotlib.axis.Axis.set_figure()')

ax1.legend()
ax2.legend()

plt.show()
Output:
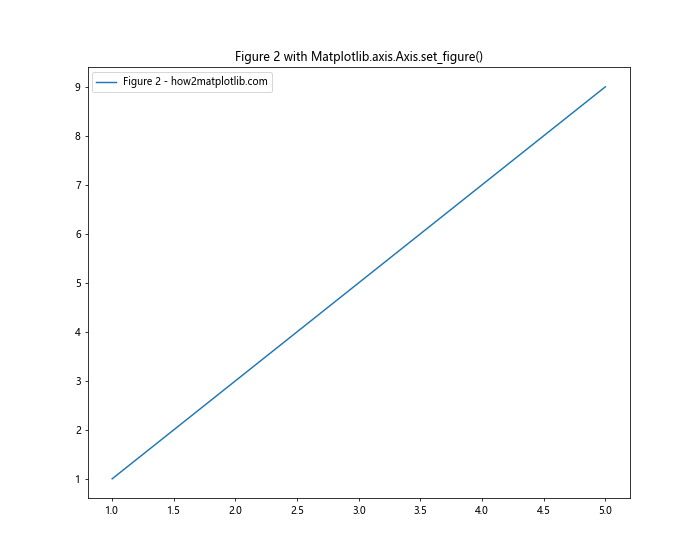
In this example, we create two separate figures and use Matplotlib.axis.Axis.set_figure() to associate different axes with each figure. This allows us to manage multiple figures independently.
Practical Applications of Matplotlib.axis.Axis.set_figure()
Now that we understand the basics, let’s explore some practical applications of the Matplotlib.axis.Axis.set_figure() function in various scenarios.
1. Creating Subplots with Shared Axes
One common use case for Matplotlib.axis.Axis.set_figure() is when creating subplots with shared axes. Here’s an example:
import matplotlib.pyplot as plt
import numpy as np

# Create a figure with subplots
fig, (ax1, ax2) = plt.subplots(2, 1, figsize=(8, 10), sharex=True)

# Generate data
x = np.linspace(0, 10, 100)
y1 = np.sin(x)
y2 = np.cos(x)

# Plot data on subplots
ax1.plot(x, y1, label='Sin - how2matplotlib.com')
ax2.plot(x, y2, label='Cos - how2matplotlib.com')

# Use set_figure() to ensure proper association
ax1.xaxis.set_figure(fig)
ax1.yaxis.set_figure(fig)
ax2.xaxis.set_figure(fig)
ax2.yaxis.set_figure(fig)

ax1.set_title('Subplot 1: Sin Function')
ax2.set_title('Subplot 2: Cos Function')

ax1.legend()
ax2.legend()

plt.tight_layout()
plt.show()
Output:
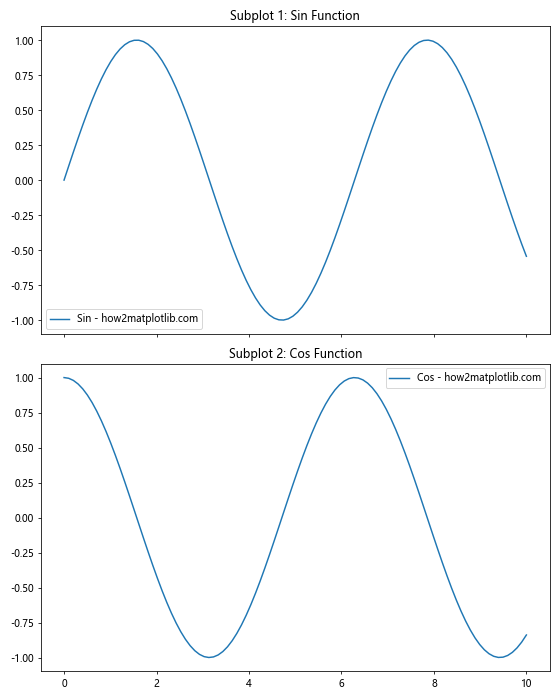
In this example, we create two subplots with a shared x-axis. The Matplotlib.axis.Axis.set_figure() function is used to ensure that both subplots are properly associated with the main figure.
2. Customizing Axis Properties
The Matplotlib.axis.Axis.set_figure() function can be particularly useful when you need to customize axis properties for specific figures. Here’s an example:
import matplotlib.pyplot as plt
import numpy as np

# Create two figures
fig1 = plt.figure(figsize=(8, 6))
fig2 = plt.figure(figsize=(8, 6))

# Create axes for both figures
ax1 = fig1.add_subplot(111)
ax2 = fig2.add_subplot(111)

# Use set_figure() to associate axes with figures
ax1.xaxis.set_figure(fig1)
ax1.yaxis.set_figure(fig1)
ax2.xaxis.set_figure(fig2)
ax2.yaxis.set_figure(fig2)

# Generate data
x = np.linspace(0, 10, 100)
y = np.sin(x)

# Plot data on both figures
ax1.plot(x, y, label='Figure 1 - how2matplotlib.com')
ax2.plot(x, y, label='Figure 2 - how2matplotlib.com')

# Customize axis properties for each figure
ax1.xaxis.set_ticks_position('top')
ax1.yaxis.set_ticks_position('left')
ax2.xaxis.set_ticks_position('bottom')
ax2.yaxis.set_ticks_position('right')

ax1.set_title('Figure 1: Custom Axis Positions')
ax2.set_title('Figure 2: Custom Axis Positions')

ax1.legend()
ax2.legend()

plt.show()
Output:
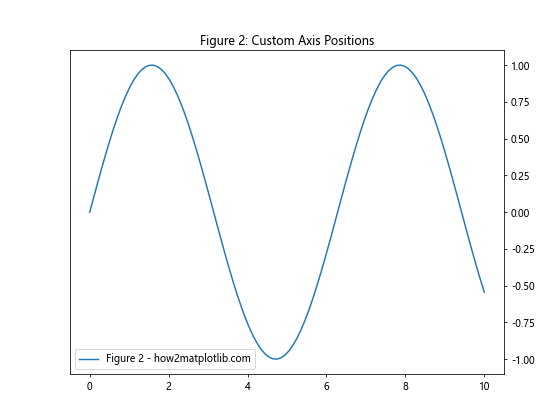
In this example, we create two figures with the same data but customize the axis positions differently for each figure using Matplotlib.axis.Axis.set_figure().
3. Managing Multiple Figures with Different Scales
The Matplotlib.axis.Axis.set_figure() function is particularly useful when working with multiple figures that have different scales. Here’s an example:
import matplotlib.pyplot as plt
import numpy as np

# Create two figures
fig1 = plt.figure(figsize=(8, 6))
fig2 = plt.figure(figsize=(8, 6))

# Create axes for both figures
ax1 = fig1.add_subplot(111)
ax2 = fig2.add_subplot(111)

# Use set_figure() to associate axes with figures
ax1.xaxis.set_figure(fig1)
ax1.yaxis.set_figure(fig1)
ax2.xaxis.set_figure(fig2)
ax2.yaxis.set_figure(fig2)

# Generate data
x = np.linspace(0, 10, 100)
y1 = np.sin(x)
y2 = 1000 * np.sin(x)

# Plot data on both figures
ax1.plot(x, y1, label='Small Scale - how2matplotlib.com')
ax2.plot(x, y2, label='Large Scale - how2matplotlib.com')

# Set different scales for each figure
ax1.set_ylim(-1.5, 1.5)
ax2.set_ylim(-1500, 1500)

ax1.set_title('Figure 1: Small Scale')
ax2.set_title('Figure 2: Large Scale')

ax1.legend()
ax2.legend()

plt.show()
Output:
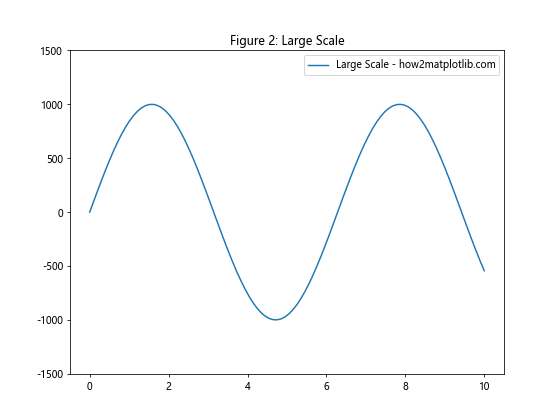
In this example, we create two figures with the same data but at different scales. The Matplotlib.axis.Axis.set_figure() function ensures that each axis is associated with the correct figure, allowing for independent scaling.
Advanced Techniques with Matplotlib.axis.Axis.set_figure()
Now that we’ve covered the basics and some practical applications, let’s explore some advanced techniques using the Matplotlib.axis.Axis.set_figure() function.
1. Creating Custom Axis Layouts
The Matplotlib.axis.Axis.set_figure() function can be used to create custom axis layouts that go beyond the standard subplot arrangements. Here’s an example:
import matplotlib.pyplot as plt
import numpy as np

# Create a figure
fig = plt.figure(figsize=(12, 8))

# Create custom axis positions
ax1 = fig.add_axes([0.1, 0.1, 0.4, 0.8])
ax2 = fig.add_axes([0.55, 0.5, 0.4, 0.4])
ax3 = fig.add_axes([0.55, 0.1, 0.4, 0.3])

# Use set_figure() to associate axes with the figure
ax1.xaxis.set_figure(fig)
ax1.yaxis.set_figure(fig)
ax2.xaxis.set_figure(fig)
ax2.yaxis.set_figure(fig)
ax3.xaxis.set_figure(fig)
ax3.yaxis.set_figure(fig)

# Generate data
x = np.linspace(0, 10, 100)
y1 = np.sin(x)
y2 = np.cos(x)
y3 = np.tan(x)

# Plot data on custom axes
ax1.plot(x, y1, label='Sin - how2matplotlib.com')
ax2.plot(x, y2, label='Cos - how2matplotlib.com')
ax3.plot(x, y3, label='Tan - how2matplotlib.com')

ax1.set_title('Custom Axis 1: Sin Function')
ax2.set_title('Custom Axis 2: Cos Function')
ax3.set_title('Custom Axis 3: Tan Function')

ax1.legend()
ax2.legend()
ax3.legend()

plt.show()
Output:
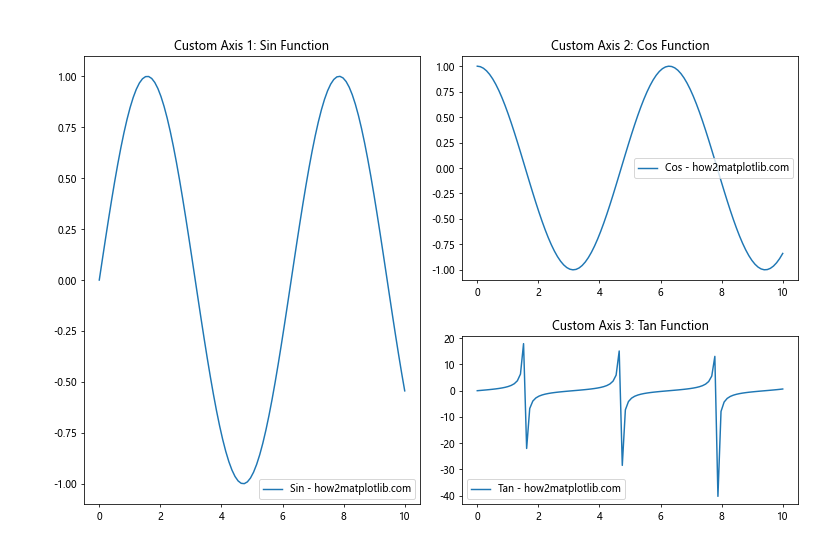
In this example, we create a custom layout with three axes of different sizes and positions. The Matplotlib.axis.Axis.set_figure() function ensures that each axis is properly associated with the main figure.
2. Implementing Interactive Axis Switching
The Matplotlib.axis.Axis.set_figure() function can be used to implement interactive axis switching between different figures. Here’s an example:
import matplotlib.pyplot as plt
import numpy as np
from matplotlib.widgets import Button

# Create two figures
fig1 = plt.figure(figsize=(8, 6))
fig2 = plt.figure(figsize=(8, 6))

# Create axes for both figures
ax1 = fig1.add_subplot(111)
ax2 = fig2.add_subplot(111)

# Use set_figure() to associate axes with figures
ax1.xaxis.set_figure(fig1)
ax1.yaxis.set_figure(fig1)
ax2.xaxis.set_figure(fig2)
ax2.yaxis.set_figure(fig2)

# Generate data
x = np.linspace(0, 10, 100)
y1 = np.sin(x)
y2 = np.cos(x)

# Plot data on both figures
line1, = ax1.plot(x, y1, label='Sin - how2matplotlib.com')
line2, = ax2.plot(x, y2, label='Cos - how2matplotlib.com')

ax1.set_title('Figure 1: Sin Function')
ax2.set_title('Figure 2: Cos Function')

ax1.legend()
ax2.legend()

# Create a button to switch between figures
button_ax = plt.axes([0.8, 0.05, 0.1, 0.075])
button = Button(button_ax, 'Switch')

# Function to switch between figures
def switch_figure(event):
    if plt.gcf() == fig1:
        plt.figure(fig2.number)
    else:
        plt.figure(fig1.number)
    plt.draw()

button.on_clicked(switch_figure)

plt.show()
Output:
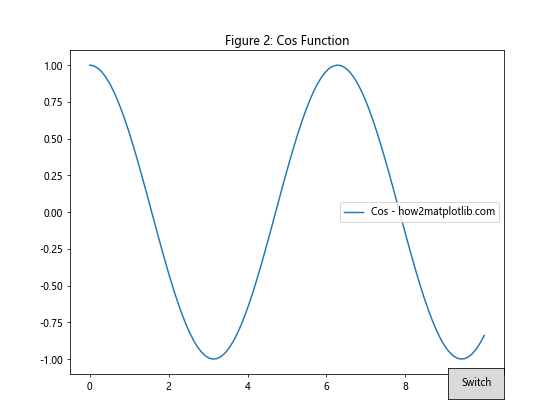
In this example, we create two figures with different plots and implement a button that allows the user to switch between them. The Matplotlib.axis.Axis.set_figure() function ensures that each axis remains associated with its respective figure during the switching process.
3. Creating Animated Plots with Multiple Figures
The Matplotlib.axis.Axis.set_figure() function can be useful when creating animated plots that involve multiple figures. Here’s an example:
import matplotlib.pyplot as plt
import numpy as np
from matplotlib.animation import FuncAnimation

# Create two figures
fig1 = plt.figure(figsize=(8, 6))
fig2 = plt.figure(figsize=(8, 6))

# Create axes for both figures
ax1 = fig1.add_subplot(111)
ax2 = fig2.add_subplot(111)

# Use set_figure() to associate axes with figures
ax1.xaxis.set_figure(fig1)
ax1.yaxis.set_figure(fig1)
ax2.xaxis.set_figure(fig2)
ax2.yaxis.set_figure(fig2)

# Initialize data
x = np.linspace(0, 2*np.pi, 100)
line1, = ax1.plot([], [], label='Sin - how2matplotlib.com')
line2, = ax2.plot([], [], label='Cos - how2matplotlib.com')

ax1.set_xlim(0, 2*np.pi)
ax1.set_ylim(-1.5, 1.5)
ax2.set_xlim(0, 2*np.pi)
ax2.set_ylim(-1.5, 1.5)

ax1.set_title('Animated Sin Function')
ax2.set_title('Animated Cos Function')

ax1.legend()
ax2.legend()

# Animation function
def animate(frame):
    y1 = np.sin(x + frame/10)
    y2 = np.cos(x + frame/10)
    line1.set_data(x, y1)
    line2.set_data(x, y2)
    return line1, line2

# Create animations for both figures
anim1 = FuncAnimation(fig1, animate, frames=100, interval=50, blit=True)
anim2 = FuncAnimation(fig2, animate, frames=100, interval=50, blit=True)

plt.show()
Output:
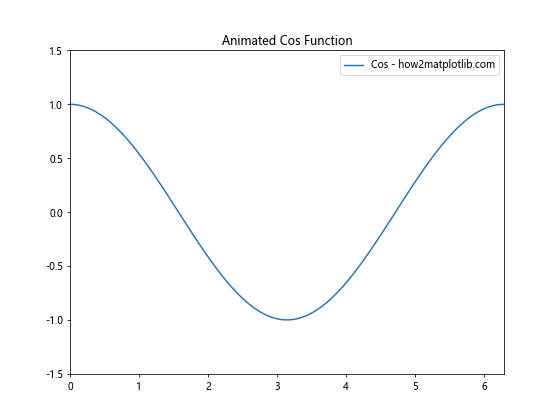
In this example, we create two animated plots on separate figures. The Matplotlib.axis.Axis.set_figure() function ensures that each axis remains associated with its respective figure throughout the animation process.
Best Practices for Using Matplotlib.axis.Axis.set_figure()
When working with the Matplotlib.axis.Axis.set_figure() function, it’s important to follow some best practices to ensure optimal results and avoid common pitfalls. Here are some guidelines to keep in mind:
- Always call Matplotlib.axis.Axis.set_figure() after creating the figure and axis objects to ensure proper association.
When2. When working with multiple figures, make sure to call Matplotlib.axis.Axis.set_figure() for each axis on each figure to avoid confusion.
Use Matplotlib.axis.Axis.set_figure() in conjunction with other axis manipulation functions to achieve the desired layout and appearance.
When creating custom layouts or complex visualizations, double-check that all axes are correctly associated with their intended figures.
Be mindful of memory usage when working with multiple figures, especially in interactive or animated plots.
Let’s look at an example that demonstrates these best practices: