Comprehensive Guide to Matplotlib.axis.Axis.set_default_intervals() Function in Python
Matplotlib.axis.Axis.set_default_intervals() function in Python is an essential tool for customizing the default intervals of axes in Matplotlib plots. This function allows developers to set the default intervals for both x and y axes, providing greater control over the appearance and scale of their visualizations. In this comprehensive guide, we’ll explore the Matplotlib.axis.Axis.set_default_intervals() function in depth, covering its usage, parameters, and practical applications through numerous examples.
Understanding the Matplotlib.axis.Axis.set_default_intervals() Function
The Matplotlib.axis.Axis.set_default_intervals() function is a method of the Axis class in Matplotlib. It is used to set the default intervals for an axis, which determines the initial range of values displayed on that axis when a plot is created. This function is particularly useful when you want to establish a consistent starting point for your plots or when you need to adjust the default view of your data.
Syntax of Matplotlib.axis.Axis.set_default_intervals()
The basic syntax of the Matplotlib.axis.Axis.set_default_intervals() function is as follows:
axis.set_default_intervals()
Where axis is an instance of the Matplotlib.axis.Axis class.
When to Use Matplotlib.axis.Axis.set_default_intervals()
The Matplotlib.axis.Axis.set_default_intervals() function is typically used in scenarios where you want to:
- Reset the axis limits to their default values
- Ensure consistent initial view across multiple plots
- Prepare an axis for new data after clearing previous content
Let’s explore these use cases with examples.
Example 1: Resetting Axis Limits
import matplotlib.pyplot as plt

fig, ax = plt.subplots()
ax.plot([1, 2, 3, 4], [1, 4, 2, 3], label='Data from how2matplotlib.com')
ax.set_xlim(0, 5)
ax.set_ylim(0, 6)

# Reset to default intervals
ax.xaxis.set_default_intervals()
ax.yaxis.set_default_intervals()

plt.title('Resetting Axis Limits with set_default_intervals()')
plt.legend()
plt.show()
Output:
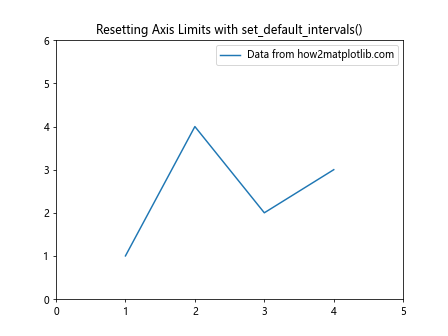
In this example, we first set custom limits for both x and y axes using set_xlim() and set_ylim(). Then, we use set_default_intervals() to reset both axes to their default intervals. This is useful when you want to revert to the original view after applying custom limits.
Example 2: Ensuring Consistent Initial View
import matplotlib.pyplot as plt
import numpy as np

def create_plot(data):
    fig, ax = plt.subplots()
    ax.plot(data, label='Data from how2matplotlib.com')
    ax.xaxis.set_default_intervals()
    ax.yaxis.set_default_intervals()
    plt.title('Consistent Initial View with set_default_intervals()')
    plt.legend()
    plt.show()

# Create plots with different data
create_plot(np.random.rand(10))
create_plot(np.random.rand(20) * 100)
This example demonstrates how to use set_default_intervals() to ensure a consistent initial view across multiple plots, even when the data ranges differ significantly. By calling set_default_intervals() for both axes in the create_plot() function, we establish a uniform starting point for all plots.
Example 3: Preparing Axis for New Data
import matplotlib.pyplot as plt

fig, ax = plt.subplots()

# Plot initial data
ax.plot([1, 2, 3], [1, 2, 3], label='Initial data from how2matplotlib.com')

# Clear the plot and reset intervals
ax.clear()
ax.xaxis.set_default_intervals()
ax.yaxis.set_default_intervals()

# Plot new data
ax.plot([4, 5, 6], [6, 5, 4], label='New data from how2matplotlib.com')

plt.title('Preparing Axis for New Data with set_default_intervals()')
plt.legend()
plt.show()
Output:
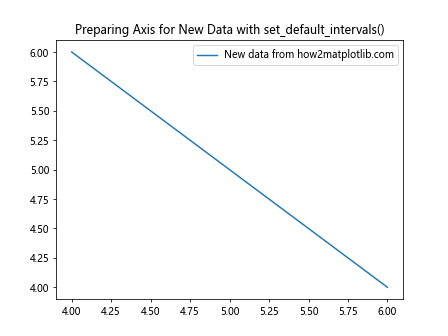
In this example, we first plot some initial data, then clear the plot using ax.clear(). After clearing, we use set_default_intervals() to reset both axes to their default intervals before plotting new data. This ensures that the new plot starts with a clean slate and appropriate axis ranges.
Advanced Usage of Matplotlib.axis.Axis.set_default_intervals()
While the basic usage of set_default_intervals() is straightforward, there are several advanced techniques and considerations to keep in mind when working with this function.
Combining with Other Axis Methods
The set_default_intervals() function can be effectively combined with other axis methods to achieve more complex customizations. Let’s explore some examples.
Example 4: Combining with set_ticks()
import matplotlib.pyplot as plt
import numpy as np

fig, ax = plt.subplots()

data = np.random.rand(10)
ax.plot(data, label='Random data from how2matplotlib.com')

ax.xaxis.set_default_intervals()
ax.yaxis.set_default_intervals()

ax.set_xticks(np.arange(0, 10, 2))
ax.set_yticks(np.arange(0, 1.1, 0.2))

plt.title('Combining set_default_intervals() with set_ticks()')
plt.legend()
plt.show()
Output:
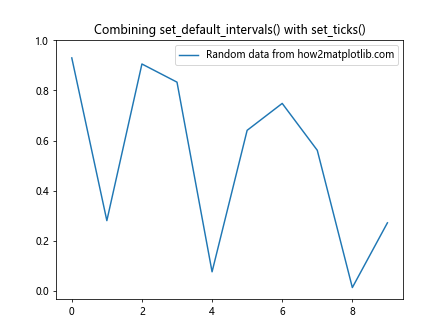
In this example, we first use set_default_intervals() to establish the default ranges for both axes. Then, we use set_xticks() and set_yticks() to customize the tick locations. This combination allows us to have a default range while still maintaining control over the tick positions.
Example 5: Using with set_scale()
import matplotlib.pyplot as plt
import numpy as np

fig, ax = plt.subplots()

data = np.exp(np.arange(10))
ax.plot(data, label='Exponential data from how2matplotlib.com')

ax.xaxis.set_default_intervals()
ax.yaxis.set_default_intervals()

ax.set_yscale('log')

plt.title('Using set_default_intervals() with Logarithmic Scale')
plt.legend()
plt.show()
Output:
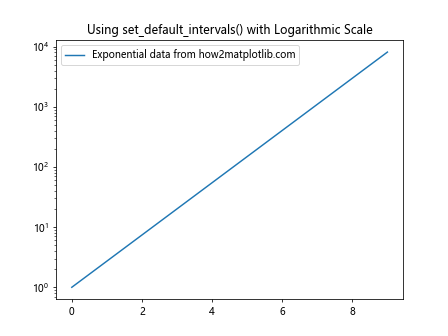
This example demonstrates how to use set_default_intervals() in conjunction with set_yscale() to create a plot with a logarithmic y-axis. We first set the default intervals and then change the y-axis scale to logarithmic, which is particularly useful for visualizing exponential data.
Handling Different Data Types
The set_default_intervals() function works with various data types and structures. Let’s look at how to use it with different kinds of data.
Example 6: DateTime Data
import matplotlib.pyplot as plt
import pandas as pd

dates = pd.date_range('2023-01-01', periods=10)
values = range(10)

fig, ax = plt.subplots()
ax.plot(dates, values, label='Time series data from how2matplotlib.com')

ax.xaxis.set_default_intervals()
ax.yaxis.set_default_intervals()

plt.title('Using set_default_intervals() with DateTime Data')
plt.legend()
plt.gcf().autofmt_xdate()  # Rotate and align the tick labels
plt.show()
Output:
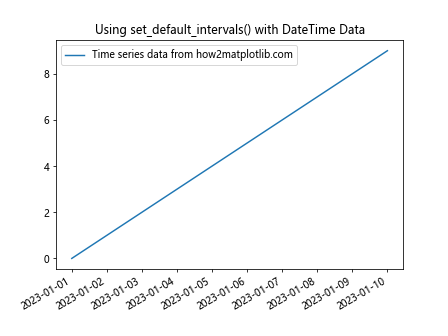
This example shows how to use set_default_intervals() with datetime data on the x-axis. After plotting the time series data, we apply set_default_intervals() to both axes to ensure appropriate default ranges.
Example 7: Categorical Data
import matplotlib.pyplot as plt

categories = ['A', 'B', 'C', 'D', 'E']
values = [3, 7, 2, 5, 8]

fig, ax = plt.subplots()
ax.bar(categories, values, label='Categorical data from how2matplotlib.com')

ax.xaxis.set_default_intervals()
ax.yaxis.set_default_intervals()

plt.title('Using set_default_intervals() with Categorical Data')
plt.legend()
plt.show()
Output:
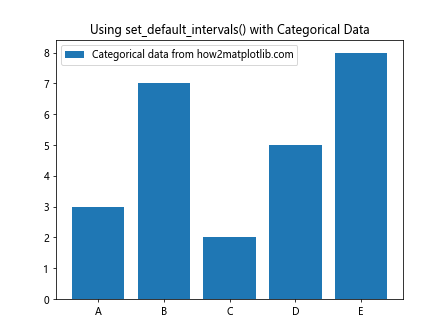
In this example, we demonstrate the use of set_default_intervals() with categorical data in a bar plot. Even though the x-axis represents categories rather than numerical values, set_default_intervals() ensures that the axis limits are set appropriately.
Best Practices and Considerations
When working with the Matplotlib.axis.Axis.set_default_intervals() function, there are several best practices and considerations to keep in mind to ensure optimal results.
1. Order of Operations
The order in which you call set_default_intervals() relative to other axis-modifying functions can impact the final appearance of your plot. Generally, it’s best to call set_default_intervals() before applying other customizations.
Example 8: Order of Operations
import matplotlib.pyplot as plt
import numpy as np

fig, (ax1, ax2) = plt.subplots(1, 2, figsize=(12, 5))

data = np.random.rand(10)

# Subplot 1: set_default_intervals() called first
ax1.xaxis.set_default_intervals()
ax1.yaxis.set_default_intervals()
ax1.plot(data, label='Data from how2matplotlib.com')
ax1.set_ylim(0, 1.5)
ax1.set_title('set_default_intervals() First')

# Subplot 2: set_default_intervals() called last
ax2.plot(data, label='Data from how2matplotlib.com')
ax2.set_ylim(0, 1.5)
ax2.xaxis.set_default_intervals()
ax2.yaxis.set_default_intervals()
ax2.set_title('set_default_intervals() Last')

plt.tight_layout()
plt.show()
Output:
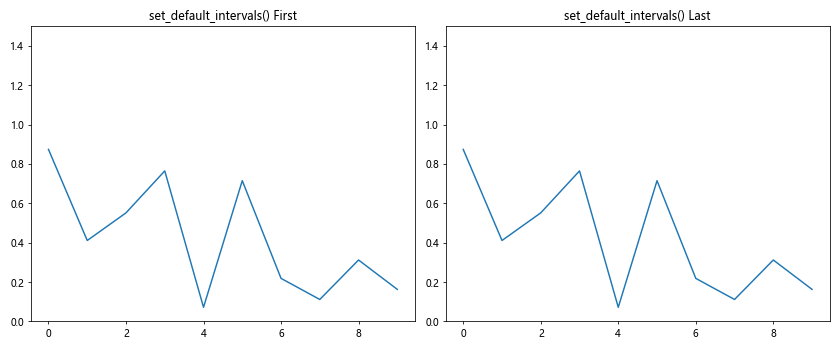
This example illustrates the difference in results when set_default_intervals() is called before or after other axis modifications. In the first subplot, the default intervals are set before plotting and adjusting the y-limit, while in the second subplot, they are set after these operations.
2. Consistency Across Subplots
When working with multiple subplots, it’s important to maintain consistency in how you apply set_default_intervals().
Example 9: Consistent Application Across Subplots
import matplotlib.pyplot as plt
import numpy as np

fig, axs = plt.subplots(2, 2, figsize=(12, 10))

for ax in axs.flat:
    data = np.random.rand(10)
    ax.plot(data, label='Data from how2matplotlib.com')
    ax.xaxis.set_default_intervals()
    ax.yaxis.set_default_intervals()
    ax.legend()

plt.suptitle('Consistent Application of set_default_intervals() Across Subplots')
plt.tight_layout()
plt.show()
Output:
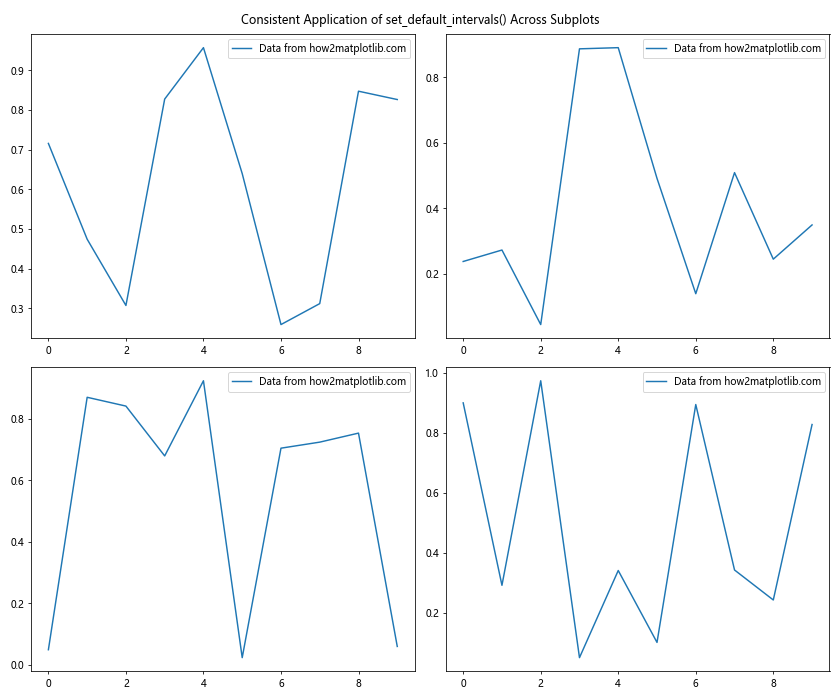
In this example, we create a 2×2 grid of subplots and apply set_default_intervals() consistently to each subplot. This ensures that all subplots have the same default axis ranges, promoting visual consistency across the entire figure.
3. Combining with Auto-scaling
While set_default_intervals() sets the initial view of the plot, it’s often useful to combine it with Matplotlib’s auto-scaling features for a more dynamic approach.
Example 10: Combining with Autoscale
import matplotlib.pyplot as plt
import numpy as np

fig, ax = plt.subplots()

data = np.random.rand(100) * 10
ax.plot(data, label='Data from how2matplotlib.com')

ax.xaxis.set_default_intervals()
ax.yaxis.set_default_intervals()

ax.autoscale(enable=True, axis='both', tight=True)

plt.title('Combining set_default_intervals() with Autoscale')
plt.legend()
plt.show()
Output:
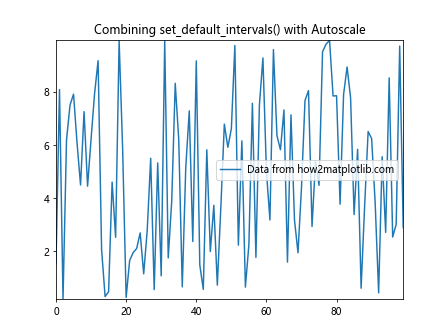
In this example, we first set the default intervals and then apply autoscale() to both axes. This combination allows the plot to start with default intervals but then adjust to fit the data tightly, providing an optimal view of the dataset.
Advanced Techniques with Matplotlib.axis.Axis.set_default_intervals()
As we delve deeper into the capabilities of the Matplotlib.axis.Axis.set_default_intervals() function, we can explore more advanced techniques and scenarios where this function proves particularly useful.
Dynamic Updating of Plots
One powerful application of set_default_intervals() is in creating dynamically updating plots. This is particularly useful for real-time data visualization or interactive plots.
Example 11: Dynamic Plot Updating
import matplotlib.pyplot as plt
import numpy as np

fig, ax = plt.subplots()
line, = ax.plot([], [], label='Dynamic data from how2matplotlib.com')
ax.set_xlim(0, 10)
ax.set_ylim(0, 1)

def update(frame):
    data = np.random.rand(frame + 1)
    line.set_data(range(frame + 1), data)
    if frame > 10:
        ax.xaxis.set_default_intervals()
        ax.yaxis.set_default_intervals()
    return line,

from matplotlib.animation import FuncAnimation
ani = FuncAnimation(fig, update, frames=20, interval=200, blit=True)

plt.title('Dynamic Plot with set_default_intervals()')
plt.legend()
plt.show()
Output:
In this example, we create an animation where new data points are added to the plot over time. Once the number of data points exceeds 10, we use set_default_intervals() to reset the axis limits, allowing the plot to expand dynamically as new data is added.
Handling Logarithmic Scales
When working with logarithmic scales, set_default_intervals() can be particularly useful in setting appropriate initial ranges.
Example 12: Logarithmic Scale with set_default_intervals()
import matplotlib.pyplot as plt
import numpy as np

fig, ax = plt.subplots()

data = np.logspace(0, 5, 20)
ax.plot(data, label='Log data from how2matplotlib.com')

ax.set_xscale('log')
ax.set_yscale('log')

ax.xaxis.set_default_intervals()
ax.yaxis.set_default_intervals()

plt.title('Logarithmic Scale with set_default_intervals()')
plt.legend()
plt.show()
Output:
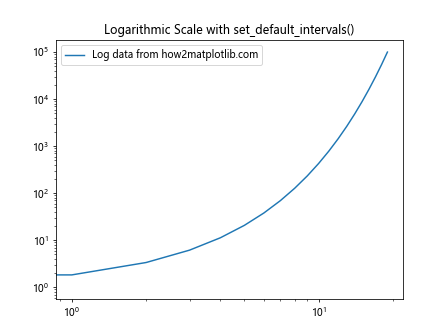
This example demonstrates how to use set_default_intervals() with logarithmic scales on both axes. After setting the scales to logarithmic, we apply set_default_intervals() to ensure that the initial view of the plot is appropriate for the logarithmic data.
Customizing Tick Locations and Labels
While set_default_intervals() sets the overall range of the axis, you can combine it with custom tick locations and labels for more precise control.
Example 13: Custom Ticks with set_default_intervals()
import matplotlib.pyplot as plt
import numpy as np

fig, ax = plt.subplots()

data = np.random.rand(10)
ax.plot(data, label='Data from how2matplotlib.com')

ax.xaxis.set_default_intervals()
ax.yaxis.set_default_intervals()

ax.set_xticks(np.arange(0, 10, 2))
ax.set_xticklabels(['A', 'B', 'C', 'D', 'E'])
ax.set_yticks(np.arange(0, 1.1, 0.2))
ax.set_yticklabels([f'{x:.1f}' for x in np.arange(0, 1.1, 0.2)])

plt.title('Custom Ticks with set_default_intervals()')
plt.legend()
plt.show()
Output:
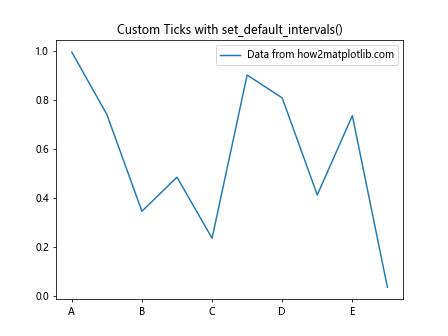
In this example, we first set the default intervals and then customize both the tick locations and labels. This approach allows for a combination of automatic range setting with precise control over how the axes are labeled.
Working with Date Axes
When dealing with time series data, set_default_intervals() can be particularly useful in setting appropriate date ranges.
Example 14: Date Axis with set_default_intervals()
import matplotlib.pyplot as plt
import pandas as pd
import numpy as np

dates = pd.date_range('2023-01-01', periods=100)
values = np.cumsum(np.random.randn(100))

fig, ax = plt.subplots(figsize=(10, 6))
ax.plot(dates, values, label='Time series from how2matplotlib.com')

ax.xaxis.set_default_intervals()
ax.yaxis.set_default_intervals()

plt.gcf().autofmt_xdate()  # Rotate and align the tick labels
ax.fmt_xdata = plt.DateFormatter('%Y-%m-%d')

plt.title('Date Axis with set_default_intervals()')
plt.legend()
plt.show()
This example shows how to use set_default_intervals() with a date axis. After plotting the time series data, we apply set_default_intervals() to both axes to ensure appropriate default ranges for the date and value axes.
Handling Multiple Y-axes
When working with plots that have multiple y-axes, set_default_intervals() can be applied to each axis independently.
Example 15: Multiple Y-axes with set_default_intervals()
import matplotlib.pyplot as plt
import numpy as np

fig, ax1 = plt.subplots()

t = np.arange(0.01, 10.0, 0.01)
s1 = np.exp(t)
ax1.plot(t, s1, 'b-', label='Exp data from how2matplotlib.com')
ax1.set_ylabel('exp', color='b')
ax1.xaxis.set_default_intervals()
ax1.yaxis.set_default_intervals()

ax2 = ax1.twinx()
s2 = np.sin(2 * np.pi * t)
ax2.plot(t, s2, 'r.', label='Sin data from how2matplotlib.com')
ax2.set_ylabel('sin', color='r')
ax2.yaxis.set_default_intervals()

plt.title('Multiple Y-axes with set_default_intervals()')
fig.legend(loc="upper right", bbox_to_anchor=(1,1), bbox_transform=ax1.transAxes)

plt.show()
Output:
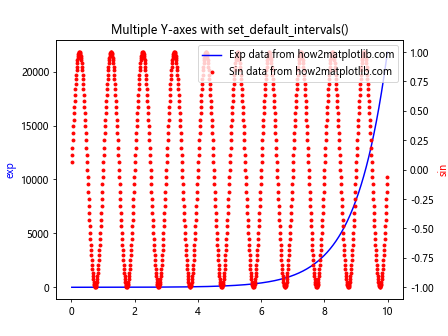
In this example, we create a plot with two y-axes. We apply set_default_intervals() to both the primary y-axis (ax1) and the secondary y-axis (ax2) independently, ensuring that each axis has appropriate default intervals.
Common Pitfalls and Troubleshooting
While the Matplotlib.axis.Axis.set_default_intervals() function is generally straightforward to use, there are some common pitfalls and issues that developers might encounter. Let’s explore these and discuss how to troubleshoot them.
1. Overriding Custom Limits
One common issue is that set_default_intervals() can override custom limits set by set_xlim() or set_ylim() if called afterwards.
Example 16: Avoiding Overriding Custom Limits
import matplotlib.pyplot as plt
import numpy as np

fig, (ax1, ax2) = plt.subplots(1, 2, figsize=(12, 5))

data = np.random.rand(10)

# Incorrect order: set_default_intervals() overrides custom limits
ax1.plot(data, label='Data from how2matplotlib.com')
ax1.set_ylim(0, 2)
ax1.xaxis.set_default_intervals()
ax1.yaxis.set_default_intervals()
ax1.set_title('Incorrect Order')

# Correct order: custom limits applied after set_default_intervals()
ax2.plot(data, label='Data from how2matplotlib.com')
ax2.xaxis.set_default_intervals()
ax2.yaxis.set_default_intervals()
ax2.set_ylim(0, 2)
ax2.set_title('Correct Order')

plt.tight_layout()
plt.show()
Output:
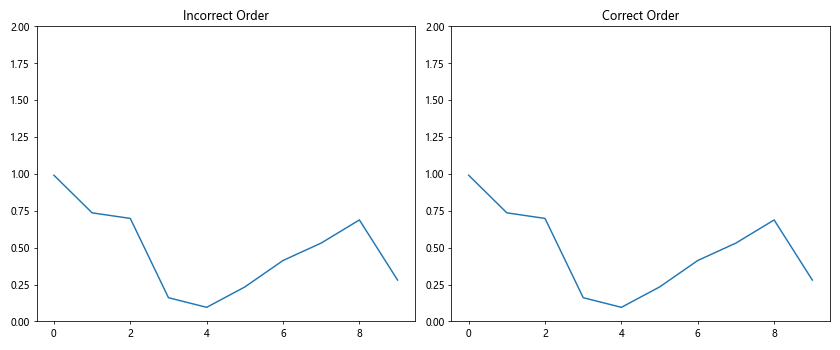
In this example, we demonstrate the correct order of operations to avoid overriding custom limits. Always apply set_default_intervals() before setting custom limits if you want the custom limits to take precedence.
2. Inconsistent Behavior with Different Plot Types
The effect of set_default_intervals() can vary depending on the type of plot you’re creating.
Example 17: Behavior with Different Plot Types
import matplotlib.pyplot as plt
import numpy as np

fig, (ax1, ax2) = plt.subplots(1, 2, figsize=(12, 5))

# Line plot
x = np.linspace(0, 10, 100)
y = np.sin(x)
ax1.plot(x, y, label='Sin data from how2matplotlib.com')
ax1.xaxis.set_default_intervals()
ax1.yaxis.set_default_intervals()
ax1.set_title('Line Plot')

# Bar plot
categories = ['A', 'B', 'C', 'D']
values = [3, 7, 2, 5]
ax2.bar(categories, values, label='Bar data from how2matplotlib.com')
ax2.xaxis.set_default_intervals()
ax2.yaxis.set_default_intervals()
ax2.set_title('Bar Plot')

plt.tight_layout()
plt.show()
Output:
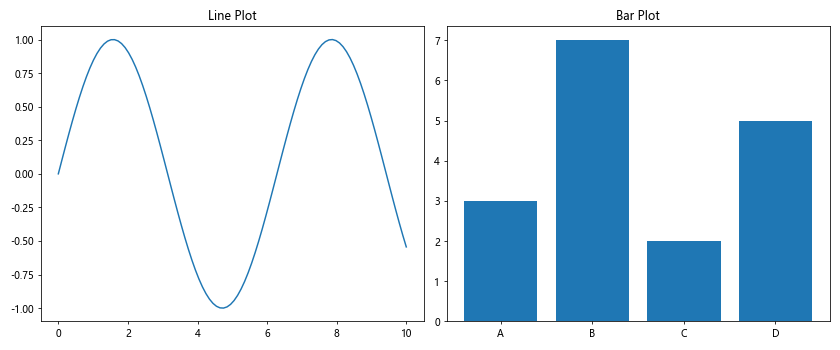
This example illustrates how set_default_intervals() behaves differently with a line plot versus a bar plot. For the line plot, it sets numerical intervals, while for the bar plot, it adjusts to accommodate the categorical data.
3. Issues with Log Scales
When working with logarithmic scales, set_default_intervals() might not always provide the expected results.
Example 18: Handling Log Scales
import matplotlib.pyplot as plt
import numpy as np

fig, (ax1, ax2) = plt.subplots(1, 2, figsize=(12, 5))

data = np.logspace(0, 5, 20)

# Without adjustments
ax1.plot(data, label='Log data from how2matplotlib.com')
ax1.set_yscale('log')
ax1.xaxis.set_default_intervals()
ax1.yaxis.set_default_intervals()
ax1.set_title('Log Scale Without Adjustments')

# With manual adjustments
ax2.plot(data, label='Log data from how2matplotlib.com')
ax2.set_yscale('log')
ax2.xaxis.set_default_intervals()
ax2.set_ylim(1, data.max() * 10)
ax2.set_title('Log Scale With Adjustments')

plt.tight_layout()
plt.show()
Output:
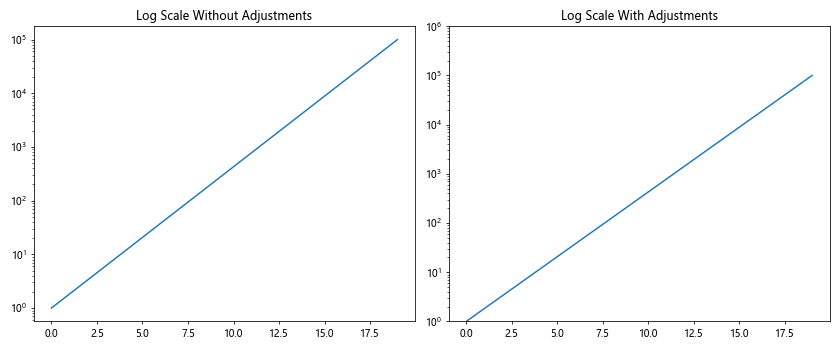
In this example, we show how set_default_intervals() might not provide ideal results with log scales. In the second subplot, we manually adjust the y-axis limits to better accommodate the logarithmic data.
Best Practices for Using Matplotlib.axis.Axis.set_default_intervals()
To make the most of the Matplotlib.axis.Axis.set_default_intervals() function, consider the following best practices:
- Order of Operations: Always call
set_default_intervals()before applying custom limits or scales if you want the custom settings to take precedence. Consistency: When working with multiple subplots or axes, apply
set_default_intervals()consistently to maintain visual harmony.Combine with Other Methods: Use
set_default_intervals()in conjunction with other Matplotlib methods likeautoscale(),set_xlim(), andset_ylim()for fine-tuned control.Check Plot Type: Be aware that the function’s behavior may vary depending on the type of plot you’re creating.
Handle Special Cases: For logarithmic scales or date axes, you may need to apply additional adjustments after using
set_default_intervals().
Example 19: Applying Best Practices
import matplotlib.pyplot as plt
import numpy as np

fig, axs = plt.subplots(2, 2, figsize=(12, 10))

data1 = np.random.rand(100)
data2 = np.exp(np.random.rand(100))

for ax in axs.flat:
    ax.xaxis.set_default_intervals()
    ax.yaxis.set_default_intervals()

axs[0, 0].plot(data1, label='Linear data from how2matplotlib.com')
axs[0, 0].set_title('Linear Scale')

axs[0, 1].plot(data2, label='Exp data from how2matplotlib.com')
axs[0, 1].set_yscale('log')
axs[0, 1].set_ylim(1, data2.max() * 2)
axs[0, 1].set_title('Log Scale')

axs[1, 0].scatter(data1, data2, label='Scatter from how2matplotlib.com')
axs[1, 0].set_title('Scatter Plot')

axs[1, 1].hist(data1, bins=20, label='Hist from how2matplotlib.com')
axs[1, 1].set_title('Histogram')

for ax in axs.flat:
    ax.legend()

plt.tight_layout()
plt.show()
Output:
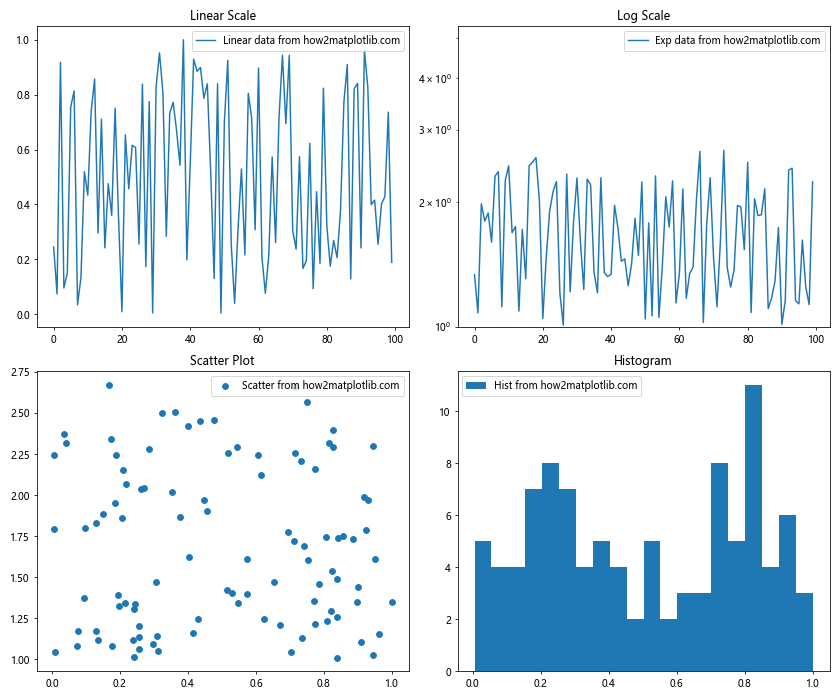
set_default_intervals() to all subplots, then make specific adjustments as needed for each plot type.