Comprehensive Guide to Matplotlib.axis.Axis.set_clip_box() Function in Python
Matplotlib.axis.Axis.set_clip_box() function in Python is a powerful tool for controlling the visibility of axis elements in your plots. This function allows you to set the clipping box for the axis, which determines the region where the axis and its components are visible. In this comprehensive guide, we’ll explore the Matplotlib.axis.Axis.set_clip_box() function in detail, covering its usage, parameters, and various applications in data visualization.
Understanding the Basics of Matplotlib.axis.Axis.set_clip_box()
The Matplotlib.axis.Axis.set_clip_box() function is part of the Matplotlib library, which is widely used for creating static, animated, and interactive visualizations in Python. This function specifically belongs to the Axis class, which represents a single axis in a plot. By using set_clip_box(), you can control the visibility of axis elements by specifying a clipping box.
Let’s start with a simple example to demonstrate the basic usage of Matplotlib.axis.Axis.set_clip_box():
import matplotlib.pyplot as plt
import numpy as np
from matplotlib.transforms import Bbox

# Create a figure and axis
fig, ax = plt.subplots()

# Generate some data
x = np.linspace(0, 10, 100)
y = np.sin(x)

# Plot the data
ax.plot(x, y, label='Sine wave')

# Create a clipping box
clip_box = Bbox([[2, -0.5], [8, 0.5]])

# Set the clipping box for the x-axis
ax.xaxis.set_clip_box(clip_box)

# Set the title and labels
ax.set_title('Matplotlib.axis.Axis.set_clip_box() Example - how2matplotlib.com')
ax.set_xlabel('X-axis')
ax.set_ylabel('Y-axis')

# Add a legend
ax.legend()

# Display the plot
plt.show()
Output:
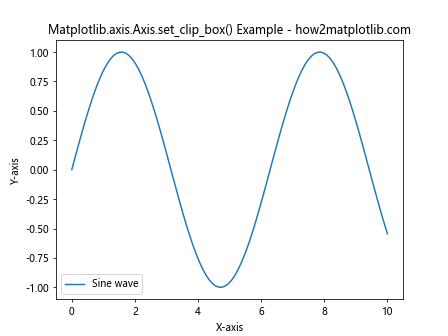
In this example, we create a simple sine wave plot and use Matplotlib.axis.Axis.set_clip_box() to set a clipping box for the x-axis. The clipping box is defined using a Bbox object, which specifies the lower-left and upper-right corners of the box. As a result, only the portion of the x-axis within the clipping box will be visible.
Parameters of Matplotlib.axis.Axis.set_clip_box()
The Matplotlib.axis.Axis.set_clip_box() function takes a single parameter:
clipbox: This parameter should be amatplotlib.transforms.Bboxobject, which defines the clipping box. The Bbox object represents a bounding box in data coordinates.
Understanding how to create and manipulate Bbox objects is crucial for effectively using the Matplotlib.axis.Axis.set_clip_box() function. Let’s explore this in more detail with another example:
import matplotlib.pyplot as plt
import numpy as np
from matplotlib.transforms import Bbox

# Create a figure and axis
fig, ax = plt.subplots()

# Generate some data
x = np.linspace(0, 10, 100)
y = np.cos(x)

# Plot the data
ax.plot(x, y, label='Cosine wave')

# Create a custom clipping box
custom_clip_box = Bbox([[3, -0.8], [7, 0.8]])

# Set the clipping box for both x and y axes
ax.xaxis.set_clip_box(custom_clip_box)
ax.yaxis.set_clip_box(custom_clip_box)

# Set the title and labels
ax.set_title('Custom Clipping Box - how2matplotlib.com')
ax.set_xlabel('X-axis')
ax.set_ylabel('Y-axis')

# Add a legend
ax.legend()

# Display the plot
plt.show()
Output:
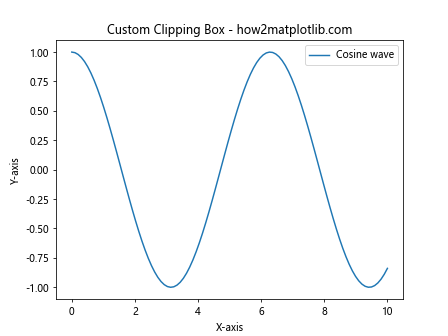
In this example, we create a custom clipping box using the Bbox class and apply it to both the x and y axes using Matplotlib.axis.Axis.set_clip_box(). This results in a plot where only the portion of the axes within the specified box is visible.
Applications of Matplotlib.axis.Axis.set_clip_box()
The Matplotlib.axis.Axis.set_clip_box() function has various applications in data visualization. Let’s explore some of these applications with examples:
1. Focusing on a Specific Region of Interest
One common use of Matplotlib.axis.Axis.set_clip_box() is to focus the viewer’s attention on a specific region of interest in the plot. Here’s an example:
import matplotlib.pyplot as plt
import numpy as np
from matplotlib.transforms import Bbox

# Create a figure and axis
fig, ax = plt.subplots()

# Generate some data
x = np.linspace(0, 10, 1000)
y = np.sin(x) * np.exp(-0.1 * x)

# Plot the data
ax.plot(x, y, label='Damped sine wave')

# Create a clipping box to focus on a specific region
focus_box = Bbox([[2, -0.2], [5, 0.6]])

# Set the clipping box for both axes
ax.xaxis.set_clip_box(focus_box)
ax.yaxis.set_clip_box(focus_box)

# Set the title and labels
ax.set_title('Focusing on a Region of Interest - how2matplotlib.com')
ax.set_xlabel('Time')
ax.set_ylabel('Amplitude')

# Add a legend
ax.legend()

# Display the plot
plt.show()
Output:
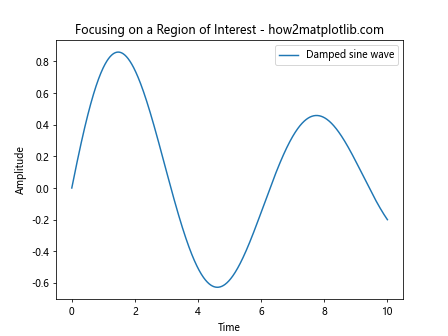
In this example, we use Matplotlib.axis.Axis.set_clip_box() to focus on a specific region of a damped sine wave. By setting the clipping box, we draw attention to the most interesting part of the plot.
2. Creating Partial Axis Labels
Another interesting application of Matplotlib.axis.Axis.set_clip_box() is to create partial axis labels. This can be useful when you want to emphasize certain parts of the axis while de-emphasizing others. Here’s an example:
import matplotlib.pyplot as plt
import numpy as np
from matplotlib.transforms import Bbox

# Create a figure and axis
fig, ax = plt.subplots()

# Generate some data
x = np.linspace(0, 10, 100)
y = np.random.normal(0, 1, 100).cumsum()

# Plot the data
ax.plot(x, y, label='Random walk')

# Create clipping boxes for partial axis labels
left_box = Bbox([[0, -10], [5, 10]])
right_box = Bbox([[8, -10], [10, 10]])

# Set the clipping boxes for the x-axis
ax.xaxis.set_clip_box(left_box)
ax.xaxis.set_clip_box(right_box)

# Set the title and labels
ax.set_title('Partial Axis Labels - how2matplotlib.com')
ax.set_xlabel('Time')
ax.set_ylabel('Value')

# Add a legend
ax.legend()

# Display the plot
plt.show()
Output:
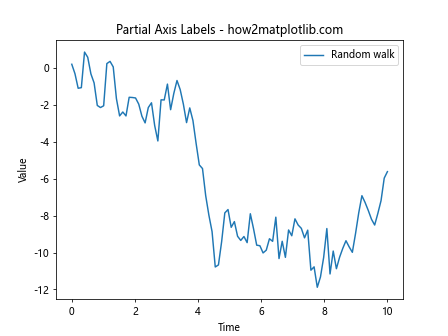
In this example, we use Matplotlib.axis.Axis.set_clip_box() to create partial axis labels on the x-axis. This technique can be useful for emphasizing specific ranges of data or creating a unique visual effect.
3. Combining Multiple Plots with Different Clipping Boxes
The Matplotlib.axis.Axis.set_clip_box() function can also be used to create complex visualizations by combining multiple plots with different clipping boxes. Here’s an example:
import matplotlib.pyplot as plt
import numpy as np
from matplotlib.transforms import Bbox

# Create a figure with multiple subplots
fig, (ax1, ax2) = plt.subplots(2, 1, figsize=(10, 8))

# Generate some data
x = np.linspace(0, 10, 100)
y1 = np.sin(x)
y2 = np.cos(x)

# Plot the data on both subplots
ax1.plot(x, y1, label='Sine wave')
ax2.plot(x, y2, label='Cosine wave')

# Create different clipping boxes for each subplot
clip_box1 = Bbox([[2, -0.5], [8, 0.5]])
clip_box2 = Bbox([[0, -0.5], [6, 0.5]])

# Set the clipping boxes for the x-axes
ax1.xaxis.set_clip_box(clip_box1)
ax2.xaxis.set_clip_box(clip_box2)

# Set titles and labels
ax1.set_title('Sine Wave with Clipping - how2matplotlib.com')
ax2.set_title('Cosine Wave with Clipping - how2matplotlib.com')
ax1.set_xlabel('X-axis')
ax2.set_xlabel('X-axis')
ax1.set_ylabel('Y-axis')
ax2.set_ylabel('Y-axis')

# Add legends
ax1.legend()
ax2.legend()

# Adjust layout and display the plot
plt.tight_layout()
plt.show()
Output:
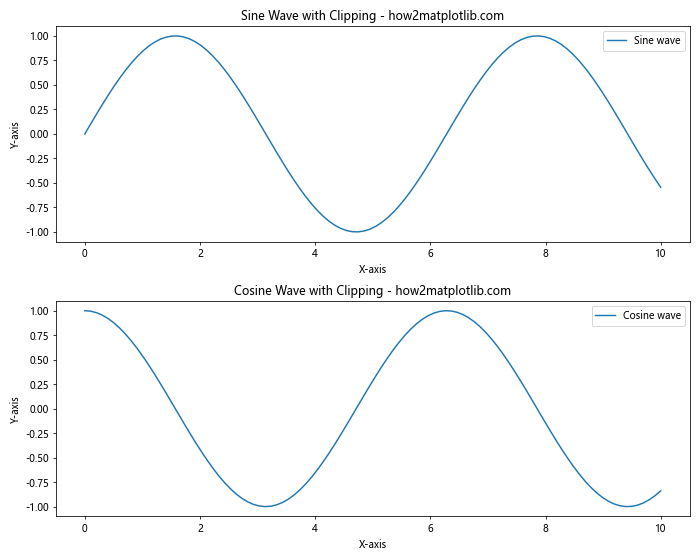
In this example, we create two subplots with different clipping boxes applied to their x-axes using Matplotlib.axis.Axis.set_clip_box(). This technique allows for creative comparisons between different datasets or visualization styles.
Advanced Techniques with Matplotlib.axis.Axis.set_clip_box()
Now that we’ve covered the basics and some applications of Matplotlib.axis.Axis.set_clip_box(), let’s explore some advanced techniques that can further enhance your plots.
1. Dynamic Clipping Boxes
You can create dynamic clipping boxes that change based on user input or data characteristics. Here’s an example that allows the user to interactively set the clipping box:
import matplotlib.pyplot as plt
import numpy as np
from matplotlib.transforms import Bbox
from matplotlib.widgets import RectangleSelector

def onselect(eclick, erelease):
    x1, y1 = eclick.xdata, eclick.ydata
    x2, y2 = erelease.xdata, erelease.ydata
    clip_box = Bbox([[min(x1, x2), min(y1, y2)], [max(x1, x2), max(y1, y2)]])
    ax.xaxis.set_clip_box(clip_box)
    ax.yaxis.set_clip_box(clip_box)
    fig.canvas.draw()

# Create a figure and axis
fig, ax = plt.subplots()

# Generate some data
x = np.linspace(0, 10, 100)
y = np.sin(x) * np.exp(-0.1 * x)

# Plot the data
ax.plot(x, y, label='Damped sine wave')

# Set up the RectangleSelector
rs = RectangleSelector(ax, onselect, useblit=True,
                       button=[1], minspanx=5, minspany=5,
                       spancoords='pixels', interactive=True)

# Set the title and labels
ax.set_title('Dynamic Clipping Box - how2matplotlib.com')
ax.set_xlabel('X-axis')
ax.set_ylabel('Y-axis')

# Add a legend
ax.legend()

# Display the plot
plt.show()
Output:
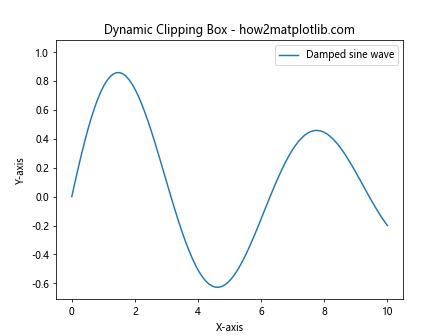
In this example, we use a RectangleSelector widget to allow the user to interactively select a region on the plot. The selected region is then used to create a dynamic clipping box using Matplotlib.axis.Axis.set_clip_box().
2. Combining Clipping Boxes with Transforms
You can combine clipping boxes with Matplotlib’s transform system to create more complex clipping regions. Here’s an example that uses a combination of data and figure coordinates:
import matplotlib.pyplot as plt
import numpy as np
from matplotlib.transforms import Bbox, blended_transform_factory

# Create a figure and axis
fig, ax = plt.subplots()

# Generate some data
x = np.linspace(0, 10, 100)
y = np.sin(x)

# Plot the data
ax.plot(x, y, label='Sine wave')

# Create a clipping box using a blend of data and figure coordinates
trans = blended_transform_factory(ax.transData, fig.transFigure)
clip_box = Bbox([[2, 0.2], [8, 0.8]])

# Set the clipping box for both axes
ax.xaxis.set_clip_box(clip_box.transformed(trans))
ax.yaxis.set_clip_box(clip_box.transformed(trans))

# Set the title and labels
ax.set_title('Clipping Box with Blended Transform - how2matplotlib.com')
ax.set_xlabel('X-axis')
ax.set_ylabel('Y-axis')

# Add a legend
ax.legend()

# Display the plot
plt.show()
Output:
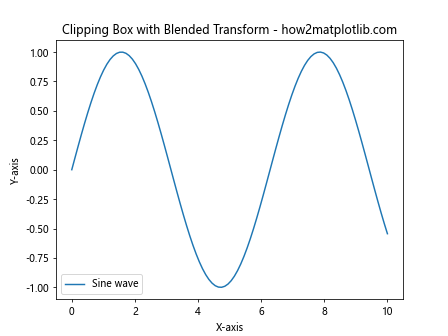
In this example, we use a blended transform to create a clipping box that combines data coordinates for the x-axis and figure coordinates for the y-axis. This allows for more flexible and precise control over the clipping region.
3. Animating Clipping Boxes
You can create animated visualizations by dynamically updating the clipping box. Here’s an example that animates the clipping box to create a sliding window effect:
import matplotlib.pyplot as plt
import numpy as np
from matplotlib.transforms import Bbox
from matplotlib.animation import FuncAnimation

# Create a figure and axis
fig, ax = plt.subplots()

# Generate some data
x = np.linspace(0, 10, 1000)
y = np.sin(2 * np.pi * x) + np.random.normal(0, 0.1, 1000)

# Plot the data
line, = ax.plot(x, y, label='Noisy sine wave')

# Set up the initial clipping box
clip_box = Bbox([[0, -1.5], [2, 1.5]])
ax.xaxis.set_clip_box(clip_box)
ax.yaxis.set_clip_box(clip_box)

# Animation update function
def update(frame):
    clip_box.x0 = frame
    clip_box.x1 = frame + 2
    ax.xaxis.set_clip_box(clip_box)
    ax.yaxis.set_clip_box(clip_box)
    ax.set_xlim(frame, frame + 2)
    return line,

# Create the animation
anim = FuncAnimation(fig, update, frames=np.linspace(0, 8, 100),
                     interval=50, blit=True)

# Set the title and labels
ax.set_title('Animated Clipping Box - how2matplotlib.com')
ax.set_xlabel('X-axis')
ax.set_ylabel('Y-axis')

# Add a legend
ax.legend()

# Display the animated plot
plt.show()
Output:
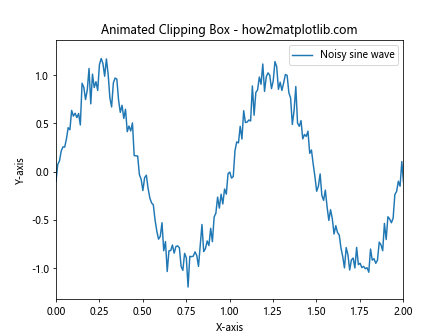
In this example, we create an animation that updates the clipping box in each frame, creating a sliding window effect over the data. This technique can be useful for visualizing time-series data or creating dynamic focus effects in your plots.
Best Practices for Using Matplotlib.axis.Axis.set_clip_box()
When working with Matplotlib.axis.Axis.set_clip_box(), it’s important to keep some best practices in mind to ensure your visualizations are effective and efficient:
- Use appropriate coordinate systems: Make sure you understand the difference between data coordinates, axes coordinates, and figure coordinates when defining your clipping boxes.
Consider the aspect ratio: When setting clipping boxes, be mindful of the aspect ratio of your plot to avoid distortion.
Combine with other Matplotlib features: Matplotlib.axis.Axis.set_clip_box() can be powerful when combined with other Matplotlib features like transforms, colormaps, and annotations.
Test on different datasets: Ensure your clipping boxes work well with various datasets and plot types.
Document your usage: When using Matplotlib.axis.Axis.set_clip_box() in complex visualizations, add comments to explain the purpose and effect of each clipping box.
Here’s an example that demonstrates some of these best practices: