Comprehensive Guide to Matplotlib.axis.Axis.set_clip_on() Function in Python
Matplotlib.axis.Axis.set_clip_on() function in Python is a powerful tool for controlling the clipping behavior of axis elements in Matplotlib plots. This function allows you to determine whether the axis and its associated components should be clipped to the plotting area or extend beyond it. Understanding and utilizing the Matplotlib.axis.Axis.set_clip_on() function can greatly enhance your ability to create customized and visually appealing plots.
In this comprehensive guide, we’ll explore the Matplotlib.axis.Axis.set_clip_on() function in depth, covering its syntax, usage, and various applications. We’ll provide numerous examples to illustrate how this function can be used to manipulate axis clipping in different scenarios.
Understanding the Basics of Matplotlib.axis.Axis.set_clip_on()
The Matplotlib.axis.Axis.set_clip_on() function is a method of the Axis class in Matplotlib. It is used to set the clipping behavior of the axis and its associated elements. When clipping is enabled (set to True), the axis and its components are confined within the plotting area. When disabled (set to False), they can extend beyond the plot boundaries.
Let’s start with a basic example to demonstrate the usage of Matplotlib.axis.Axis.set_clip_on():
import matplotlib.pyplot as plt

# Create a figure and axis
fig, ax = plt.subplots()

# Plot some data
ax.plot([0, 1, 2, 3], [0, 1, 0, 1], label='Data from how2matplotlib.com')

# Set clip_on to False for the x-axis
ax.xaxis.set_clip_on(False)

# Set clip_on to True for the y-axis (default behavior)
ax.yaxis.set_clip_on(True)

plt.title('Matplotlib.axis.Axis.set_clip_on() Example')
plt.legend()
plt.show()
Output:
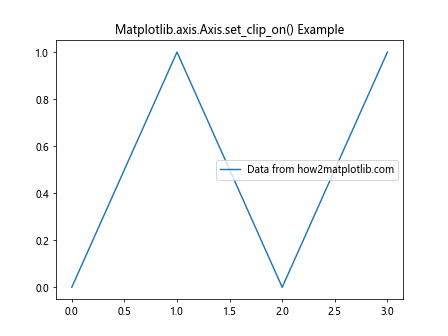
In this example, we create a simple line plot and use Matplotlib.axis.Axis.set_clip_on() to disable clipping for the x-axis while keeping it enabled for the y-axis. This allows the x-axis elements to extend beyond the plot area if necessary.
Exploring the Parameters of Matplotlib.axis.Axis.set_clip_on()
The Matplotlib.axis.Axis.set_clip_on() function has a simple syntax with only one parameter:
Axis.set_clip_on(b)
Where:
bis a boolean value (True or False) that determines whether clipping should be enabled or disabled.
Let’s look at an example that demonstrates how to use this parameter:
import matplotlib.pyplot as plt

fig, (ax1, ax2) = plt.subplots(1, 2, figsize=(10, 4))

# Plot with clipping enabled (default)
ax1.plot([0, 1, 2, 3], [0, 1, 0, 1], label='Data from how2matplotlib.com')
ax1.set_title('Clipping Enabled')

# Plot with clipping disabled
ax2.plot([0, 1, 2, 3], [0, 1, 0, 1], label='Data from how2matplotlib.com')
ax2.xaxis.set_clip_on(False)
ax2.yaxis.set_clip_on(False)
ax2.set_title('Clipping Disabled')

plt.tight_layout()
plt.show()
Output:
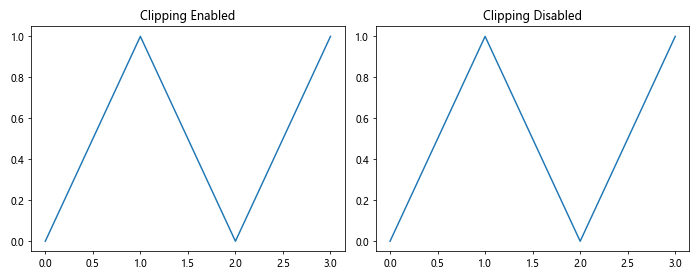
In this example, we create two subplots side by side. The left subplot has the default clipping behavior (enabled), while the right subplot has clipping disabled for both x and y axes using Matplotlib.axis.Axis.set_clip_on().
Applying Matplotlib.axis.Axis.set_clip_on() to Different Plot Types
The Matplotlib.axis.Axis.set_clip_on() function can be applied to various types of plots. Let’s explore how it affects different plot types:
Line Plots
import matplotlib.pyplot as plt
import numpy as np

fig, (ax1, ax2) = plt.subplots(1, 2, figsize=(10, 4))

x = np.linspace(0, 10, 100)
y = np.sin(x)

# Line plot with clipping enabled
ax1.plot(x, y, label='Sin wave from how2matplotlib.com')
ax1.set_title('Line Plot (Clipping Enabled)')

# Line plot with clipping disabled
ax2.plot(x, y, label='Sin wave from how2matplotlib.com')
ax2.xaxis.set_clip_on(False)
ax2.yaxis.set_clip_on(False)
ax2.set_title('Line Plot (Clipping Disabled)')

plt.tight_layout()
plt.show()
Output:
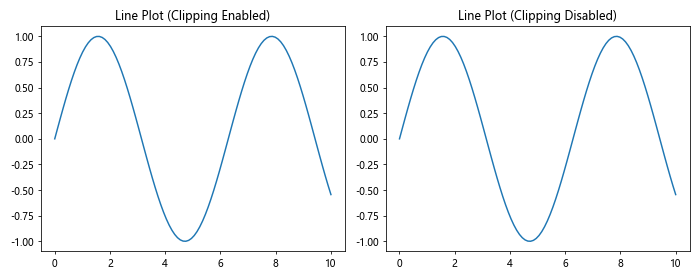
In this example, we create two line plots of a sine wave. The left plot has default clipping, while the right plot has clipping disabled using Matplotlib.axis.Axis.set_clip_on().
Scatter Plots
import matplotlib.pyplot as plt
import numpy as np

fig, (ax1, ax2) = plt.subplots(1, 2, figsize=(10, 4))

x = np.random.rand(50)
y = np.random.rand(50)

# Scatter plot with clipping enabled
ax1.scatter(x, y, label='Random data from how2matplotlib.com')
ax1.set_title('Scatter Plot (Clipping Enabled)')

# Scatter plot with clipping disabled
ax2.scatter(x, y, label='Random data from how2matplotlib.com')
ax2.xaxis.set_clip_on(False)
ax2.yaxis.set_clip_on(False)
ax2.set_title('Scatter Plot (Clipping Disabled)')

plt.tight_layout()
plt.show()
Output:
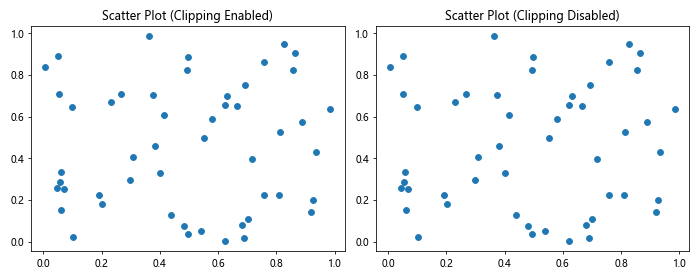
This example demonstrates the effect of Matplotlib.axis.Axis.set_clip_on() on scatter plots. The left plot uses default clipping, while the right plot has clipping disabled for both axes.
Bar Plots
import matplotlib.pyplot as plt
import numpy as np

fig, (ax1, ax2) = plt.subplots(1, 2, figsize=(10, 4))

categories = ['A', 'B', 'C', 'D']
values = [3, 7, 2, 5]

# Bar plot with clipping enabled
ax1.bar(categories, values, label='Data from how2matplotlib.com')
ax1.set_title('Bar Plot (Clipping Enabled)')

# Bar plot with clipping disabled
ax2.bar(categories, values, label='Data from how2matplotlib.com')
ax2.xaxis.set_clip_on(False)
ax2.yaxis.set_clip_on(False)
ax2.set_title('Bar Plot (Clipping Disabled)')

plt.tight_layout()
plt.show()
Output:
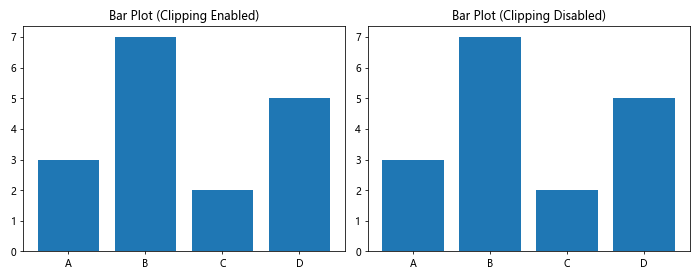
This example shows how Matplotlib.axis.Axis.set_clip_on() affects bar plots. The left plot uses default clipping, while the right plot has clipping disabled for both axes.
Customizing Axis Appearance with Matplotlib.axis.Axis.set_clip_on()
The Matplotlib.axis.Axis.set_clip_on() function can be used in combination with other axis customization methods to create unique and visually appealing plots. Let’s explore some examples:
Extending Tick Marks
import matplotlib.pyplot as plt
import numpy as np

fig, ax = plt.subplots(figsize=(8, 6))

x = np.linspace(0, 10, 100)
y = np.sin(x)

ax.plot(x, y, label='Sin wave from how2matplotlib.com')

# Extend tick marks beyond plot area
ax.xaxis.set_clip_on(False)
ax.yaxis.set_clip_on(False)

# Customize tick marks
ax.tick_params(axis='both', which='major', length=10, width=2, color='red')
ax.tick_params(axis='both', which='minor', length=5, width=1, color='blue')

ax.set_title('Extended Tick Marks using Matplotlib.axis.Axis.set_clip_on()')
plt.legend()
plt.show()
Output:
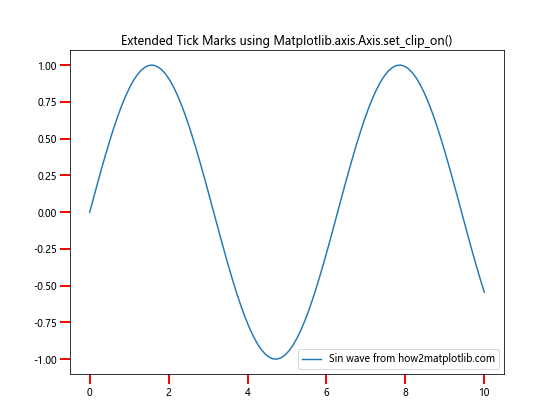
In this example, we use Matplotlib.axis.Axis.set_clip_on() to allow tick marks to extend beyond the plot area. We then customize the appearance of the tick marks using tick_params().
Creating Overlapping Axes
import matplotlib.pyplot as plt
import numpy as np

fig, ax1 = plt.subplots(figsize=(8, 6))

x = np.linspace(0, 10, 100)
y1 = np.sin(x)
y2 = np.cos(x)

# Plot sin wave on primary axis
ax1.plot(x, y1, 'b-', label='Sin wave from how2matplotlib.com')
ax1.set_xlabel('X-axis')
ax1.set_ylabel('Sin(x)', color='b')
ax1.tick_params(axis='y', labelcolor='b')

# Create secondary axis
ax2 = ax1.twinx()
ax2.plot(x, y2, 'r-', label='Cos wave from how2matplotlib.com')
ax2.set_ylabel('Cos(x)', color='r')
ax2.tick_params(axis='y', labelcolor='r')

# Disable clipping for both axes
ax1.xaxis.set_clip_on(False)
ax1.yaxis.set_clip_on(False)
ax2.yaxis.set_clip_on(False)

plt.title('Overlapping Axes using Matplotlib.axis.Axis.set_clip_on()')
fig.legend(loc='upper right', bbox_to_anchor=(1, 1), bbox_transform=ax1.transAxes)

plt.show()
Output:
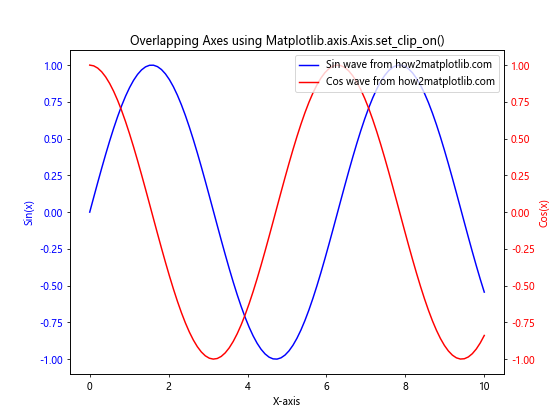
This example demonstrates how to create overlapping axes using Matplotlib.axis.Axis.set_clip_on(). We plot a sine wave on the primary axis and a cosine wave on a secondary axis, then disable clipping for both axes to allow them to overlap.
Advanced Applications of Matplotlib.axis.Axis.set_clip_on()
Let’s explore some advanced applications of the Matplotlib.axis.Axis.set_clip_on() function:
Creating Broken Axes
import matplotlib.pyplot as plt
import numpy as np

fig, (ax1, ax2) = plt.subplots(2, 1, sharex=True, figsize=(8, 6))
fig.subplots_adjust(hspace=0.05)

x = np.linspace(0, 10, 100)
y = np.exp(x)

# Plot data on both axes
ax1.plot(x, y, label='Exp function from how2matplotlib.com')
ax2.plot(x, y, label='Exp function from how2matplotlib.com')

# Set different y-axis limits
ax1.set_ylim(0, 1000)
ax2.set_ylim(8000, 22000)

# Hide the bottom ticks of the top plot and top ticks of the bottom plot
ax1.tick_params(bottom=False)
ax2.tick_params(top=False)

# Disable clipping
ax1.spines['bottom'].set_visible(False)
ax2.spines['top'].set_visible(False)
ax1.xaxis.set_clip_on(False)
ax2.xaxis.set_clip_on(False)

# Add break lines
d = 0.01
kwargs = dict(transform=ax1.transAxes, color='k', clip_on=False)
ax1.plot((-d, +d), (-d, +d), **kwargs)
ax1.plot((1-d, 1+d), (-d, +d), **kwargs)
kwargs.update(transform=ax2.transAxes)
ax2.plot((-d, +d), (1-d, 1+d), **kwargs)
ax2.plot((1-d, 1+d), (1-d, 1+d), **kwargs)

plt.suptitle('Broken Axes using Matplotlib.axis.Axis.set_clip_on()')
plt.show()
Output:
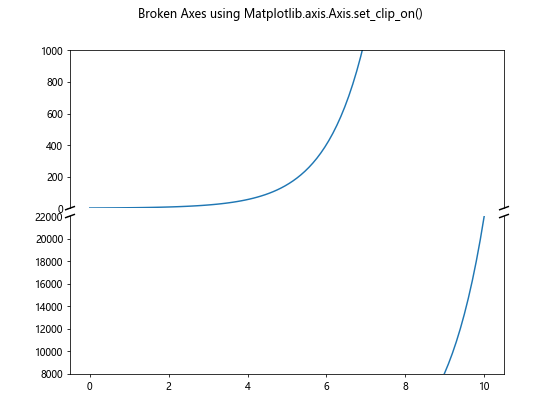
In this example, we create a plot with broken axes to display data with a large range. We use Matplotlib.axis.Axis.set_clip_on() to allow the break lines to extend beyond the plot area.
Creating Circular Plots
import matplotlib.pyplot as plt
import numpy as np

fig, ax = plt.subplots(figsize=(8, 8), subplot_kw=dict(projection='polar'))

r = np.linspace(0, 1, 100)
theta = 2 * np.pi * r

ax.plot(theta, r, label='Spiral from how2matplotlib.com')
ax.set_rmax(1.5)
ax.set_rticks([0.5, 1, 1.5])
ax.set_rlabel_position(-22.5)
ax.grid(True)

# Disable clipping to allow labels outside the plot
ax.xaxis.set_clip_on(False)
ax.yaxis.set_clip_on(False)

plt.title('Circular Plot using Matplotlib.axis.Axis.set_clip_on()')
plt.legend(loc='upper left', bbox_to_anchor=(1.05, 1))
plt.show()
Output:
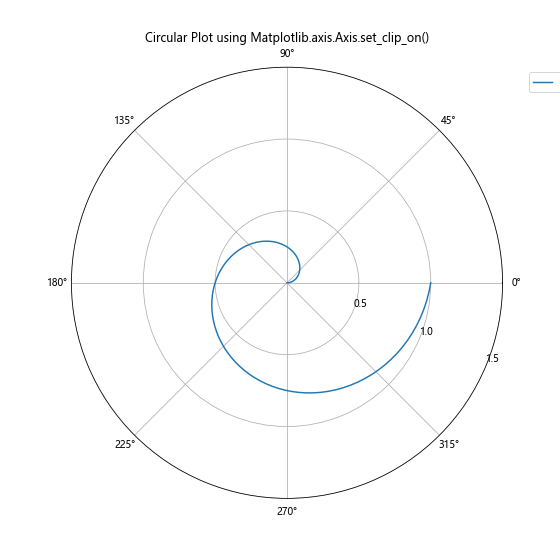
This example demonstrates how to create a circular plot using polar coordinates. We use Matplotlib.axis.Axis.set_clip_on() to allow labels and legend to appear outside the circular plot area.
Combining Matplotlib.axis.Axis.set_clip_on() with Other Matplotlib Features
The Matplotlib.axis.Axis.set_clip_on() function can be combined with other Matplotlib features to create more complex and informative visualizations. Let’s explore some examples:
Adding Annotations
import matplotlib.pyplot as plt
import numpy as np

fig, ax = plt.subplots(figsize=(8, 6))

x = np.linspace(0, 10, 100)
y = np.sin(x)

ax.plot(x, y, label='Sin wave from how2matplotlib.com')

# Add annotation
ax.annotate('Peak', xy=(np.pi/2, 1), xytext=(np.pi/2, 1.5),
            arrowprops=dict(facecolor='black', shrink=0.05))

# Disable clipping to allow annotation outside plot area
ax.xaxis.set_clip_on(False)
ax.yaxis.set_clip_on(False)

plt.title('Annotation with Matplotlib.axis.Axis.set_clip_on()')
plt.legend()
plt.show()
Output:
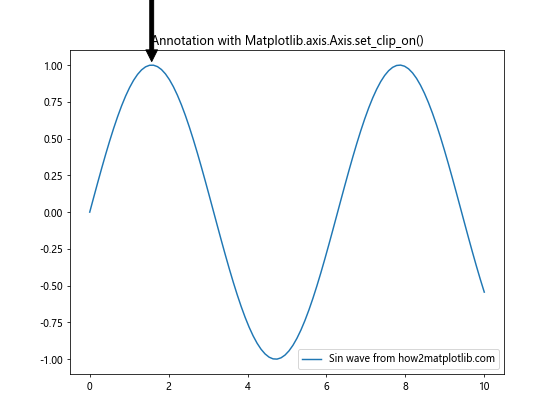
In this example, we add an annotation to highlight a specific point on the plot. By using Matplotlib.axis.Axis.set_clip_on(), we allow the annotation to extend beyond the plot area if necessary.
Combining with Colorbar
import matplotlib.pyplot as plt
import numpy as np

fig, ax = plt.subplots(figsize=(8, 6))

x = np.linspace(0, 10, 100)
y = np.linspace(0, 10, 100)
X, Y = np.meshgrid(x, y)
Z = np.sin(X) * np.cos(Y)

c = ax.pcolormesh(X, Y, Z, cmap='viridis', shading='auto')
cbar = fig.colorbar(c, ax=ax)
cbar.set_label('Z values from how2matplotlib.com')

# Disable clipping for axes and colorbar
ax.xaxis.set_clip_on(False)
ax.yaxis.set_clip_on(False)
cbar.ax.yaxis.set_clip_on(False)

plt.title('Colorbar with Matplotlib.axis.Axis.set_clip_on()')
plt.show()
Output:
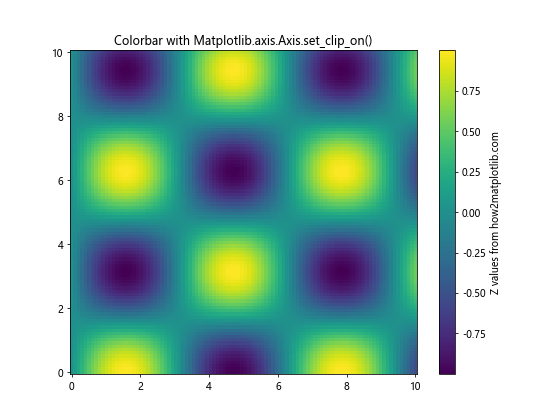
In this example, we create a 2D color plot with a colorbar. By using Matplotlib.axis.Axis.set_clip_on(), we ensure that the colorbar labels and ticks are not clipped.
Best Practices for Using Matplotlib.axis.Axis.set_clip_on()
When working with the Matplotlib.axis.Axis.set_clip_on() function, it’s important to keep some best practices in mind:
- Use sparingly: While disabling clipping can create interesting visual effects, it should be used judiciously to avoid cluttered or confusing plots.
Consider the plot type: Some plot types may benefit more from disabled clipping than others. For example, it can be particularly useful for polar plots or plots with annotations.
Be mindful of overlapping elements: When disabling clipping, ensure that plot elements don’t unintentionally overlap or obscure each other.
Combine with other customization options: Matplotlib.axis.Axis.set_clip_on() works well in combination with other axis and plot customization methods to create unique visualizations.
Test different configurations: Experiment with enabling and disabling clipping for different axes to find the best visual representation for your data.
Let’s look at an example that demonstrates these best practices: