Comprehensive Guide to Matplotlib.axis.Axis.set_clip_path() Function in Python
Matplotlib.axis.Axis.set_clip_path() function in Python is a powerful tool for customizing the appearance of your plots. This function allows you to set a clipping path for an axis, which can be used to create unique and visually appealing charts. In this comprehensive guide, we’ll explore the Matplotlib.axis.Axis.set_clip_path() function in detail, providing numerous examples and explanations to help you master this feature.
Understanding the Basics of Matplotlib.axis.Axis.set_clip_path()
The Matplotlib.axis.Axis.set_clip_path() function is part of the Matplotlib library, which is widely used for creating static, animated, and interactive visualizations in Python. This particular function is specifically designed to work with axis objects, allowing you to define a clipping path that determines which parts of the axis are visible.
Let’s start with a simple example to demonstrate how to use the Matplotlib.axis.Axis.set_clip_path() function:
import matplotlib.pyplot as plt
import numpy as np
from matplotlib.patches import Circle

fig, ax = plt.subplots(figsize=(8, 6))
ax.set_title("How to use Matplotlib.axis.Axis.set_clip_path() - how2matplotlib.com")

# Create a circular clipping path
circle = Circle((0.5, 0.5), 0.4, transform=ax.transAxes, fill=False)
ax.add_patch(circle)

# Set the clipping path for both x and y axes
ax.xaxis.set_clip_path(circle)
ax.yaxis.set_clip_path(circle)

# Plot some data
x = np.linspace(0, 10, 100)
y = np.sin(x)
ax.plot(x, y)

plt.show()
Output:
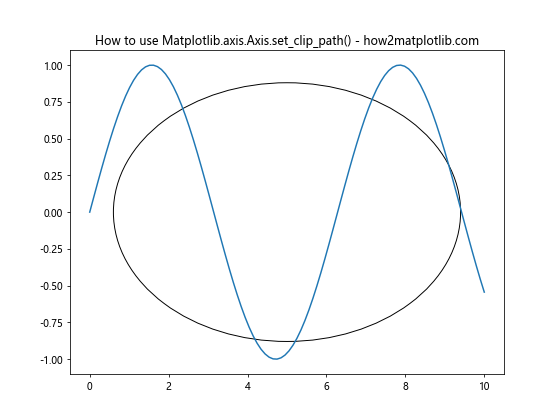
In this example, we create a circular clipping path using the Circle patch and apply it to both the x and y axes using the Matplotlib.axis.Axis.set_clip_path() function. This results in a plot where the axes are only visible within the circular region.
Advanced Usage of Matplotlib.axis.Axis.set_clip_path()
The Matplotlib.axis.Axis.set_clip_path() function offers more advanced capabilities beyond simple shapes. You can create complex clipping paths using various Matplotlib patches or even custom paths. Let’s explore some more advanced examples:
Using a Rectangle as a Clipping Path
import matplotlib.pyplot as plt
import numpy as np
from matplotlib.patches import Rectangle

fig, ax = plt.subplots(figsize=(8, 6))
ax.set_title("Rectangle Clipping with Matplotlib.axis.Axis.set_clip_path() - how2matplotlib.com")

# Create a rectangular clipping path
rect = Rectangle((0.2, 0.2), 0.6, 0.6, transform=ax.transAxes, fill=False)
ax.add_patch(rect)

# Set the clipping path for both x and y axes
ax.xaxis.set_clip_path(rect)
ax.yaxis.set_clip_path(rect)

# Plot some data
x = np.linspace(0, 10, 100)
y = np.cos(x)
ax.plot(x, y)

plt.show()
Output:
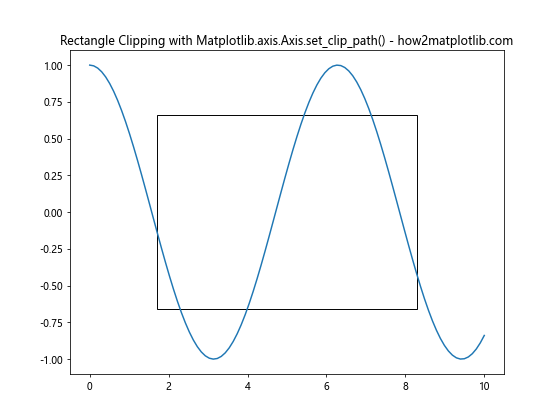
In this example, we use a Rectangle patch as the clipping path, resulting in axes that are only visible within the rectangular region.
Creating a Custom Polygon Clipping Path
import matplotlib.pyplot as plt
import numpy as np
from matplotlib.path import Path
from matplotlib.patches import PathPatch

fig, ax = plt.subplots(figsize=(8, 6))
ax.set_title("Custom Polygon Clipping with Matplotlib.axis.Axis.set_clip_path() - how2matplotlib.com")

# Create a custom polygon clipping path
verts = [(0.2, 0.2), (0.8, 0.2), (0.5, 0.8), (0.2, 0.2)]
codes = [Path.MOVETO, Path.LINETO, Path.LINETO, Path.CLOSEPOLY]
path = Path(verts, codes)
patch = PathPatch(path, transform=ax.transAxes, fill=False)
ax.add_patch(patch)

# Set the clipping path for both x and y axes
ax.xaxis.set_clip_path(patch)
ax.yaxis.set_clip_path(patch)

# Plot some data
x = np.linspace(0, 10, 100)
y = np.tan(x)
ax.plot(x, y)

plt.show()
Output:
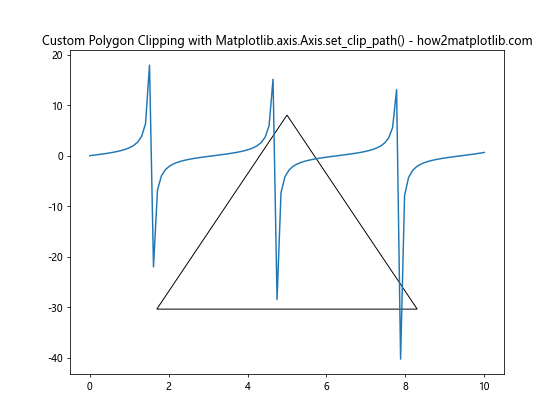
This example demonstrates how to create a custom polygon clipping path using the Path and PathPatch classes, resulting in axes that are only visible within the triangular region.
Combining Matplotlib.axis.Axis.set_clip_path() with Other Matplotlib Features
The Matplotlib.axis.Axis.set_clip_path() function can be combined with other Matplotlib features to create even more interesting and informative visualizations. Let’s explore some examples:
Clipping Multiple Plots
import matplotlib.pyplot as plt
import numpy as np
from matplotlib.patches import Ellipse

fig, (ax1, ax2) = plt.subplots(1, 2, figsize=(12, 6))
fig.suptitle("Multiple Plots with Matplotlib.axis.Axis.set_clip_path() - how2matplotlib.com")

# Create elliptical clipping paths
ellipse1 = Ellipse((0.5, 0.5), 0.8, 0.6, transform=ax1.transAxes, fill=False)
ellipse2 = Ellipse((0.5, 0.5), 0.6, 0.8, transform=ax2.transAxes, fill=False)

ax1.add_patch(ellipse1)
ax2.add_patch(ellipse2)

# Set the clipping paths for both axes
ax1.xaxis.set_clip_path(ellipse1)
ax1.yaxis.set_clip_path(ellipse1)
ax2.xaxis.set_clip_path(ellipse2)
ax2.yaxis.set_clip_path(ellipse2)

# Plot some data
x = np.linspace(0, 10, 100)
ax1.plot(x, np.sin(x))
ax2.plot(x, np.cos(x))

plt.show()
Output:
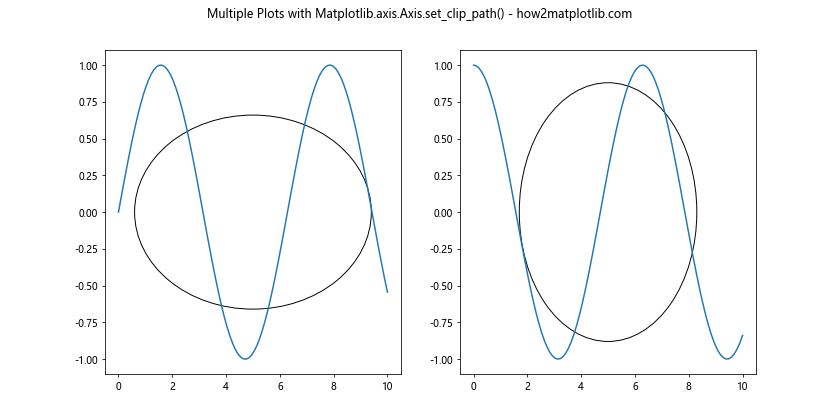
This example demonstrates how to apply different clipping paths to multiple subplots, creating a visually interesting comparison between two plots.
Combining Clipping with Fill Between
import matplotlib.pyplot as plt
import numpy as np
from matplotlib.patches import Circle

fig, ax = plt.subplots(figsize=(8, 6))
ax.set_title("Clipping with Fill Between using Matplotlib.axis.Axis.set_clip_path() - how2matplotlib.com")

# Create a circular clipping path
circle = Circle((0.5, 0.5), 0.4, transform=ax.transAxes, fill=False)
ax.add_patch(circle)

# Set the clipping path for both x and y axes
ax.xaxis.set_clip_path(circle)
ax.yaxis.set_clip_path(circle)

# Plot some data with fill between
x = np.linspace(0, 10, 100)
y1 = np.sin(x)
y2 = np.cos(x)
ax.fill_between(x, y1, y2, alpha=0.3)
ax.plot(x, y1, label='sin(x)')
ax.plot(x, y2, label='cos(x)')

ax.legend()
plt.show()
Output:
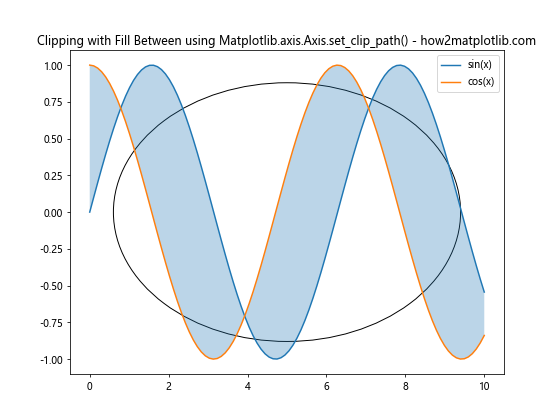
In this example, we combine the Matplotlib.axis.Axis.set_clip_path() function with the fill_between() function to create a visually appealing plot with a circular clipping region.
Customizing Axis Appearance with Matplotlib.axis.Axis.set_clip_path()
The Matplotlib.axis.Axis.set_clip_path() function can be used to create unique axis appearances. Let’s explore some examples:
Creating a Circular Plot
import matplotlib.pyplot as plt
import numpy as np
from matplotlib.patches import Circle

fig, ax = plt.subplots(figsize=(8, 8))
ax.set_title("Circular Plot with Matplotlib.axis.Axis.set_clip_path() - how2matplotlib.com")

# Create a circular clipping path
circle = Circle((0.5, 0.5), 0.45, transform=ax.transAxes, fill=False)
ax.add_patch(circle)

# Set the clipping path for both x and y axes
ax.xaxis.set_clip_path(circle)
ax.yaxis.set_clip_path(circle)

# Plot some data
theta = np.linspace(0, 2*np.pi, 100)
r = np.random.rand(100) * 0.4 + 0.1
ax.scatter(r*np.cos(theta), r*np.sin(theta))

ax.set_xlim(-0.5, 0.5)
ax.set_ylim(-0.5, 0.5)
ax.set_aspect('equal')

plt.show()
Output:
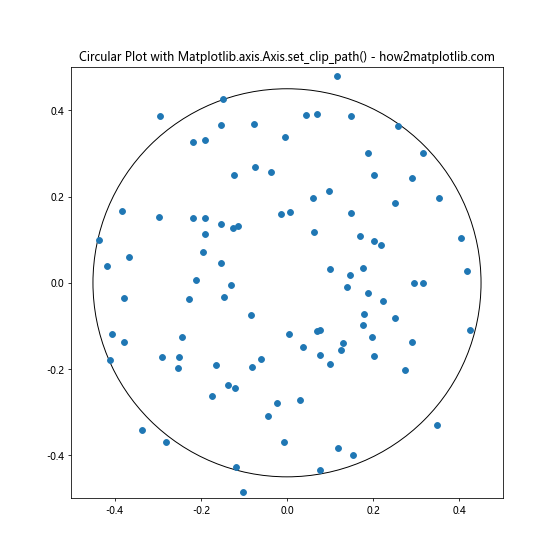
This example creates a circular plot by using a circular clipping path and adjusting the axis limits and aspect ratio.
Creating a Star-shaped Plot
import matplotlib.pyplot as plt
import numpy as np
from matplotlib.path import Path
from matplotlib.patches import PathPatch

fig, ax = plt.subplots(figsize=(8, 8))
ax.set_title("Star-shaped Plot with Matplotlib.axis.Axis.set_clip_path() - how2matplotlib.com")

# Create a star-shaped clipping path
n_points = 5
angles = np.linspace(0, 2*np.pi, n_points, endpoint=False)
outer_radius, inner_radius = 0.5, 0.2
outer_points = np.array([outer_radius * np.cos(angles), outer_radius * np.sin(angles)]).T
inner_points = np.array([inner_radius * np.cos(angles + np.pi/n_points),
                         inner_radius * np.sin(angles + np.pi/n_points)]).T
points = np.empty((n_points*2, 2))
points[0::2] = outer_points
points[1::2] = inner_points

codes = [Path.MOVETO] + [Path.LINETO] * (len(points) - 2) + [Path.CLOSEPOLY]
path = Path(points, codes)
patch = PathPatch(path, transform=ax.transAxes, fill=False)
ax.add_patch(patch)

# Set the clipping path for both x and y axes
ax.xaxis.set_clip_path(patch)
ax.yaxis.set_clip_path(patch)

# Plot some data
x = np.linspace(-0.5, 0.5, 100)
y = np.linspace(-0.5, 0.5, 100)
X, Y = np.meshgrid(x, y)
Z = np.sin(np.sqrt(X**2 + Y**2) * 10)
ax.contourf(X, Y, Z)

ax.set_xlim(-0.5, 0.5)
ax.set_ylim(-0.5, 0.5)
ax.set_aspect('equal')

plt.show()
Output:
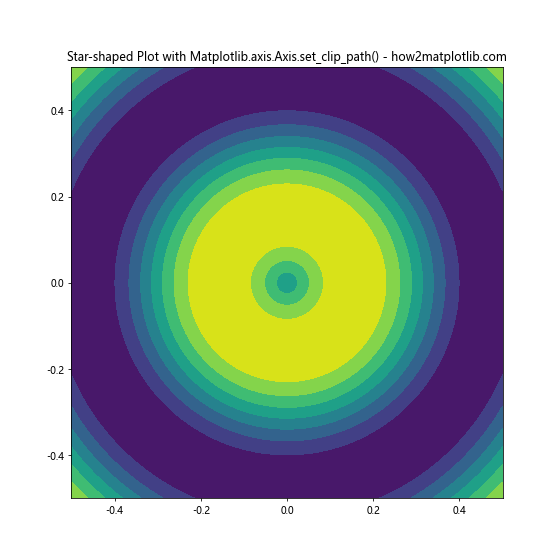
This example creates a star-shaped plot by defining a custom star-shaped path and using it as the clipping path for the axes.
Applying Matplotlib.axis.Axis.set_clip_path() to Different Plot Types
The Matplotlib.axis.Axis.set_clip_path() function can be applied to various types of plots. Let’s explore some examples:
Clipping a Bar Plot
import matplotlib.pyplot as plt
import numpy as np
from matplotlib.patches import Ellipse

fig, ax = plt.subplots(figsize=(8, 6))
ax.set_title("Clipped Bar Plot with Matplotlib.axis.Axis.set_clip_path() - how2matplotlib.com")

# Create an elliptical clipping path
ellipse = Ellipse((0.5, 0.5), 0.8, 0.6, transform=ax.transAxes, fill=False)
ax.add_patch(ellipse)

# Set the clipping path for both x and y axes
ax.xaxis.set_clip_path(ellipse)
ax.yaxis.set_clip_path(ellipse)

# Create a bar plot
categories = ['A', 'B', 'C', 'D', 'E']
values = np.random.rand(5) * 10
ax.bar(categories, values)

plt.show()
Output:
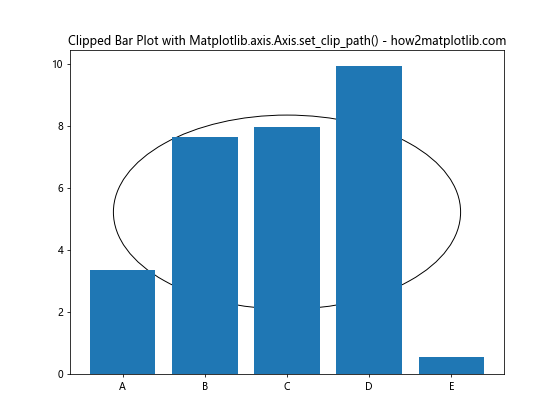
This example demonstrates how to apply a clipping path to a bar plot, creating an interesting visual effect.
Clipping a Scatter Plot
import matplotlib.pyplot as plt
import numpy as np
from matplotlib.patches import Rectangle

fig, ax = plt.subplots(figsize=(8, 6))
ax.set_title("Clipped Scatter Plot with Matplotlib.axis.Axis.set_clip_path() - how2matplotlib.com")

# Create a rectangular clipping path
rect = Rectangle((0.1, 0.1), 0.8, 0.8, transform=ax.transAxes, fill=False)
ax.add_patch(rect)

# Set the clipping path for both x and y axes
ax.xaxis.set_clip_path(rect)
ax.yaxis.set_clip_path(rect)

# Create a scatter plot
x = np.random.rand(100)
y = np.random.rand(100)
colors = np.random.rand(100)
sizes = np.random.rand(100) * 200
ax.scatter(x, y, c=colors, s=sizes, alpha=0.5)

plt.show()
Output:
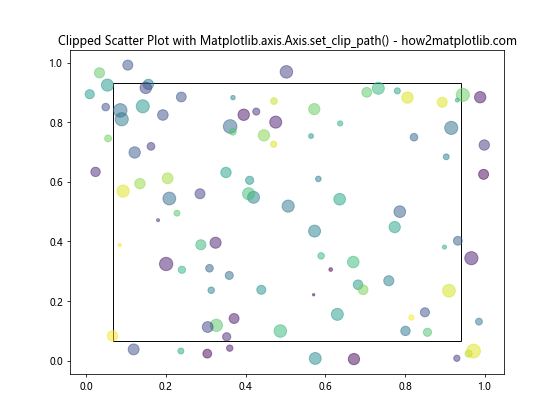
This example shows how to apply a clipping path to a scatter plot, creating a visually appealing effect with partially visible data points.
Advanced Techniques with Matplotlib.axis.Axis.set_clip_path()
Let’s explore some advanced techniques using the Matplotlib.axis.Axis.set_clip_path() function:
Animated Clipping Path
import matplotlib.pyplot as plt
import numpy as np
from matplotlib.animation import FuncAnimation
from matplotlib.patches import Circle

fig, ax = plt.subplots(figsize=(8, 6))
ax.set_title("Animated Clipping Path with Matplotlib.axis.Axis.set_clip_path() - how2matplotlib.com")

# Create initial circular clipping path
circle = Circle((0.5, 0.5), 0.1, transform=ax.transAxes, fill=False)
ax.add_patch(circle)

# Set the initial clipping path for both x and y axes
ax.xaxis.set_clip_path(circle)
ax.yaxis.set_clip_path(circle)

# Plot some data
x = np.linspace(0, 10, 100)
y = np.sin(x)
line, = ax.plot(x, y)

def update(frame):
    # Update the circle radius
    circle.set_radius(0.1 + 0.3 * np.sin(frame / 10))

    # Update the clipping path for both axes
    ax.xaxis.set_clip_path(circle)
    ax.yaxis.set_clip_path(circle)

    return line, circle

ani = FuncAnimation(fig, update, frames=100, blit=True)
plt.show()
Output:
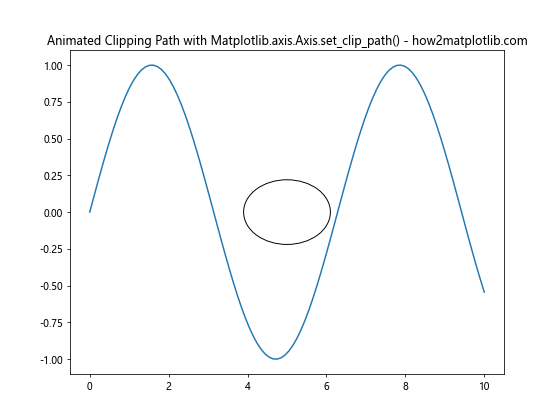
This example creates an animated plot where the clipping path changes size over time, creating a pulsating effect.
Multiple Clipping Paths
import matplotlib.pyplot as plt
import numpy as np
from matplotlib.patches import Circle, Rectangle

fig, ax = plt.subplots(figsize=(8, 6))
ax.set_title("Multiple Clipping Paths with Matplotlib.axis.Axis.set_clip_path() - how2matplotlib.com")

# Create multiple clipping paths
circle = Circle((0.3, 0.7), 0.2, transform=ax.transAxes, fill=False)
rect = Rectangle((0.6, 0.2), 0.3, 0.3, transform=ax.transAxes, fill=False)
ax.add_patch(circle)
ax.add_patch(rect)

# Set different clipping paths for x and y axes
ax.xaxis.set_clip_path(circle)
ax.yaxis.set_clip_path(rect)

# Plot some data
x = np.linspace(0, 10, 100)
y = np.sin(x) * np.cos(x)
ax.plot(x, y)

plt.show()
Output:
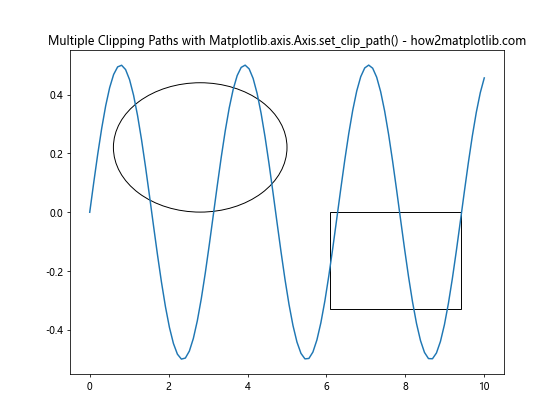
This example demonstrates how to apply different clipping paths to the x and y axes, creating a unique visual effect.
Practical Applications of Matplotlib.axis.Axis.set_clip_path()
The Matplotlib.axis.Axis.set_clip_path() function has several practical applications in data visualization. Let’s explore some of these:
Creating a Magnifying Glass Effect
import matplotlib.pyplot as plt
import numpy as np
from matplotlib.patches import Circle

fig, ax = plt.subplots(figsize=(10, 8))
ax.set_title("Magnifying Glass Effect with Matplotlib.axis.Axis.set_clip_path() - how2matplotlib.com")

# Generate data
x = np.linspace(0, 10, 1000)
y = np.sin(x) + np.random.normal(0, 0.1, 1000)

# Plot the main data
ax.plot(x, y, alpha=0.5)

# Create a magnified inset
axins = ax.inset_axes([0.5, 0.5, 0.47, 0.47])
axins.plot(x, y)
axins.set_xlim(4, 6)
axins.set_ylim(-0.5, 1.5)

# Create a circular clipping path for the inset
circle = Circle((0.5, 0.5), 0.48, transform=axins.transAxes, fill=False)
axins.add_patch(circle)

# Set the clipping path for both x and y axes of the inset
axins.xaxis.set_clip_path(circle)
axins.yaxis.set_clip_path(circle)

# Add connecting lines
ax.indicate_inset_zoom(axins, edgecolor="black")

plt.show()
Output:
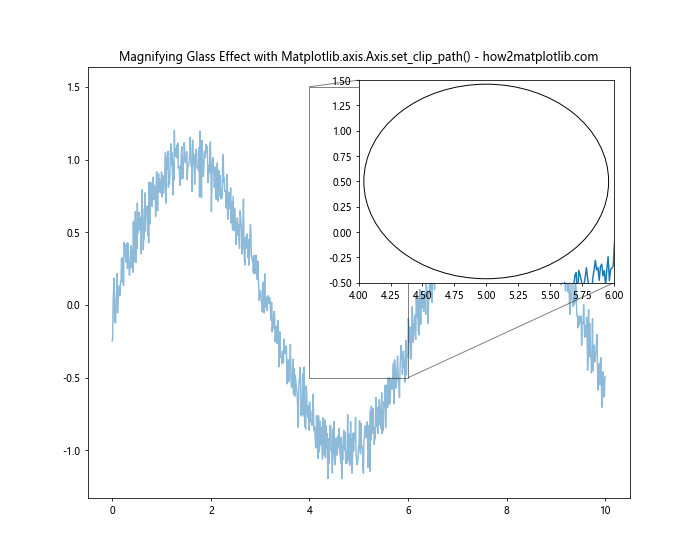
This example creates a magnifying glass effect by using the Matplotlib.axis.Axis.set_clip_path() function on an inset axis, providing a detailed view of a specific part of the data.
Creating a Radar Chart with Clipped Axes
import matplotlib.pyplot as plt
import numpy as np
from matplotlib.patches import Circle
from matplotlib.path import Path
from matplotlib.projections.polar import PolarAxes
from matplotlib.projections import register_projection

class RadarAxes(PolarAxes):
    name = 'radar'

    def __init__(self, *args, **kwargs):
        super().__init__(*args, **kwargs)
        self.set_theta_zero_location('N')

    def fill(self, *args, closed=True, **kwargs):
        return super().fill(*args, closed=closed, **kwargs)

    def plot(self, *args, **kwargs):
        lines = super().plot(*args, **kwargs)
        for line in lines:
            self._close_line(line)
        return lines

    def _close_line(self, line):
        x, y = line.get_data()
        if x[0] != x[-1]:
            x = np.concatenate((x, [x[0]]))
            y = np.concatenate((y, [y[0]]))
            line.set_data(x, y)

register_projection(RadarAxes)

fig, ax = plt.subplots(figsize=(8, 8), subplot_kw=dict(projection='radar'))
ax.set_title("Radar Chart with Clipped Axes using Matplotlib.axis.Axis.set_clip_path() - how2matplotlib.com")

# Create a circular clipping path
circle = Circle((0.5, 0.5), 0.49, transform=ax.transAxes, fill=False)
ax.add_patch(circle)

# Set the clipping path for both x and y axes
ax.xaxis.set_clip_path(circle)
ax.yaxis.set_clip_path(circle)

# Plot data
categories = ['A', 'B', 'C', 'D', 'E', 'F']
values = np.random.rand(6)
angles = np.linspace(0, 2*np.pi, len(categories), endpoint=False)
values = np.concatenate((values, [values[0]]))
angles = np.concatenate((angles, [angles[0]]))

ax.plot(angles, values)
ax.fill(angles, values, alpha=0.25)
ax.set_thetagrids(angles[:-1] * 180/np.pi, categories)

plt.show()
Output:
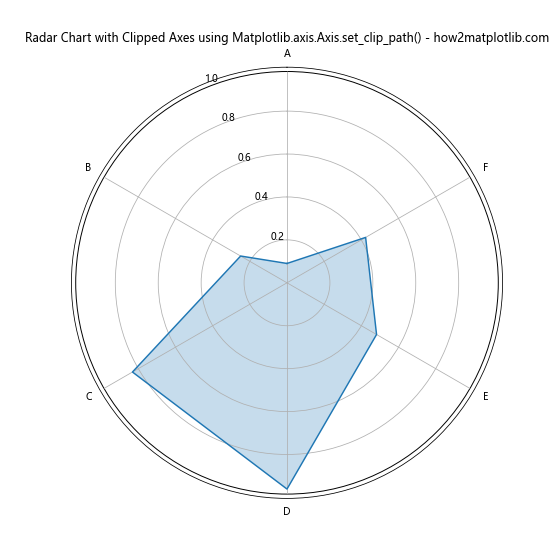
This example creates a radar chart with clipped axes using the Matplotlib.axis.Axis.set_clip_path() function, resulting in a visually appealing and informative visualization.
Best Practices for Using Matplotlib.axis.Axis.set_clip_path()
When working with the Matplotlib.axis.Axis.set_clip_path() function, it’s important to keep some best practices in mind:
- Choose appropriate clipping paths: Select clipping paths that enhance the visual appeal of your plot without obscuring important data.
Maintain aspect ratio: When using circular or symmetrical clipping paths, ensure that the plot’s aspect ratio is set to ‘equal’ to prevent distortion.
Combine with other Matplotlib features: Experiment with combining the Matplotlib.axis.Axis.set_clip_path() function with other Matplotlib features to create unique and informative visualizations.
Consider performance: Complex clipping paths may impact rendering performance, especially for large datasets. Use simpler paths when working with big data.
Test different plot types: The Matplotlib.axis.Axis.set_clip_path() function can be applied to various plot types, so experiment with different chart styles to find the most effective visualization for your data.
Troubleshooting Common Issues with Matplotlib.axis.Axis.set_clip_path()
When using the Matplotlib.axis.Axis.set_clip_path() function, you may encounter some common issues. Here are some tips for troubleshooting: