Comprehensive Guide to Matplotlib.axis.Tick.set_url() Function in Python
Matplotlib.axis.Tick.set_url() function in Python is a powerful tool for adding interactivity to your plots. This function allows you to associate a URL with a tick on an axis, enabling users to click on the tick and be directed to a specified web page. In this comprehensive guide, we’ll explore the Matplotlib.axis.Tick.set_url() function in depth, covering its usage, parameters, and various applications in data visualization.
Understanding the Matplotlib.axis.Tick.set_url() Function
The Matplotlib.axis.Tick.set_url() function is part of the Matplotlib library, which is widely used for creating static, animated, and interactive visualizations in Python. This particular function is associated with the Tick objects in Matplotlib, which represent the individual tick marks on an axis.
Let’s start with a basic example to illustrate how to use the Matplotlib.axis.Tick.set_url() function:
import matplotlib.pyplot as plt

fig, ax = plt.subplots()
ax.plot([1, 2, 3, 4], [1, 4, 2, 3])

# Get the x-axis ticks
xticks = ax.get_xticks()

# Set URL for the first tick
ax.xaxis.get_major_ticks()[0].set_url("https://how2matplotlib.com")

plt.show()
Output:

In this example, we create a simple line plot and then use the Matplotlib.axis.Tick.set_url() function to set a URL for the first tick on the x-axis. When the plot is displayed in an interactive environment that supports hyperlinks, clicking on the first tick will direct the user to the specified URL.
Parameters of Matplotlib.axis.Tick.set_url() Function
The Matplotlib.axis.Tick.set_url() function has a single parameter:
url(str): The URL to be associated with the tick.
It’s important to note that the Matplotlib.axis.Tick.set_url() function doesn’t return any value. It modifies the Tick object in-place.
Applying Matplotlib.axis.Tick.set_url() to Multiple Ticks
You can apply the Matplotlib.axis.Tick.set_url() function to multiple ticks on an axis. Here’s an example that sets different URLs for each tick on the x-axis:
import matplotlib.pyplot as plt

fig, ax = plt.subplots()
ax.plot([1, 2, 3, 4], [1, 4, 2, 3])

# Get the x-axis ticks
xticks = ax.get_xticks()

# Set URLs for all ticks
urls = [f"https://how2matplotlib.com/section{i}" for i in range(len(xticks))]
for tick, url in zip(ax.xaxis.get_major_ticks(), urls):
    tick.set_url(url)

plt.show()
Output:

In this example, we create a list of URLs and then use a loop to set a unique URL for each tick on the x-axis using the Matplotlib.axis.Tick.set_url() function.
Combining Matplotlib.axis.Tick.set_url() with Custom Tick Labels
The Matplotlib.axis.Tick.set_url() function can be combined with custom tick labels to create more informative and interactive plots. Here’s an example:
import matplotlib.pyplot as plt

fig, ax = plt.subplots()
ax.plot([1, 2, 3, 4], [1, 4, 2, 3])

# Custom tick labels and URLs
labels = ["A", "B", "C", "D"]
urls = [f"https://how2matplotlib.com/section{label}" for label in labels]

# Set custom labels and URLs
ax.set_xticks(range(1, 5))
ax.set_xticklabels(labels)
for tick, url in zip(ax.xaxis.get_major_ticks(), urls):
    tick.set_url(url)

plt.show()
Output:
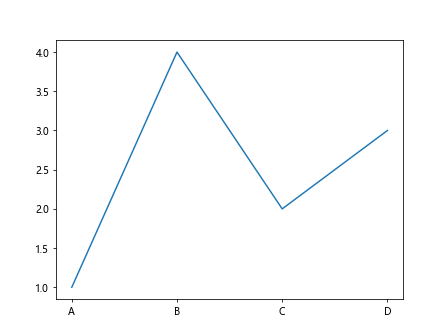
In this example, we set custom tick labels and associate each label with a unique URL using the Matplotlib.axis.Tick.set_url() function.
Applying Matplotlib.axis.Tick.set_url() to Y-axis Ticks
While we’ve focused on x-axis ticks so far, the Matplotlib.axis.Tick.set_url() function can also be applied to y-axis ticks. Here’s an example:
import matplotlib.pyplot as plt

fig, ax = plt.subplots()
ax.plot([1, 2, 3, 4], [1, 4, 2, 3])

# Set URLs for y-axis ticks
yticks = ax.get_yticks()
for i, tick in enumerate(ax.yaxis.get_major_ticks()):
    tick.set_url(f"https://how2matplotlib.com/y_value/{yticks[i]}")

plt.show()
Output:
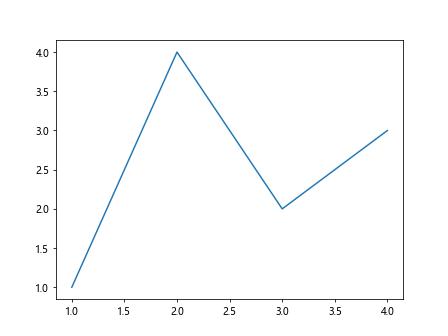
In this example, we use the Matplotlib.axis.Tick.set_url() function to set URLs for the y-axis ticks based on their values.
Combining Matplotlib.axis.Tick.set_url() with Subplots
The Matplotlib.axis.Tick.set_url() function can be used with subplots to create complex, interactive visualizations. Here’s an example:
import matplotlib.pyplot as plt

fig, (ax1, ax2) = plt.subplots(1, 2, figsize=(10, 5))

ax1.plot([1, 2, 3, 4], [1, 4, 2, 3])
ax2.plot([1, 2, 3, 4], [3, 2, 4, 1])

# Set URLs for x-axis ticks in both subplots
for i, ax in enumerate([ax1, ax2]):
    for j, tick in enumerate(ax.xaxis.get_major_ticks()):
        tick.set_url(f"https://how2matplotlib.com/subplot{i+1}/xtick{j+1}")

plt.tight_layout()
plt.show()
Output:
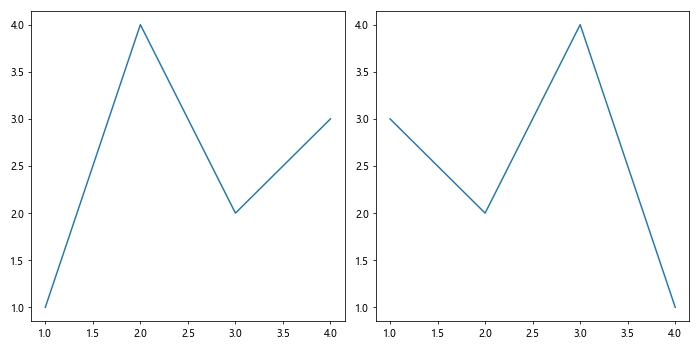
In this example, we create two subplots and use the Matplotlib.axis.Tick.set_url() function to set unique URLs for the x-axis ticks in each subplot.
Security Considerations when Using Matplotlib.axis.Tick.set_url()
When using the Matplotlib.axis.Tick.set_url() function, especially in web applications or public-facing dashboards, it’s important to consider security implications:
- URL Validation: Always validate and sanitize the URLs you’re setting to prevent potential security vulnerabilities like open redirects.
User Input: If the URLs are based on user input in any way, be sure to properly sanitize and validate that input to prevent potential injection attacks.
HTTPS: When possible, use HTTPS URLs to ensure secure connections when users click on the ticks.
Same-Origin Policy: Be aware of browser security policies like the Same-Origin Policy, which may affect how URLs are opened when clicked.
Here’s an example of how you might implement some basic URL validation: