Comprehensive Guide to Matplotlib.axis.Tick.set_visible() Function in Python
Matplotlib.axis.Tick.set_visible() function in Python is a powerful tool for customizing the appearance of tick marks on plot axes. This function allows you to control the visibility of individual ticks, providing fine-grained control over your data visualizations. In this comprehensive guide, we’ll explore the Matplotlib.axis.Tick.set_visible() function in depth, covering its usage, parameters, and various applications in data visualization.
Understanding the Matplotlib.axis.Tick.set_visible() Function
The Matplotlib.axis.Tick.set_visible() function is a method of the Tick class in Matplotlib’s axis module. It is used to set the visibility of a specific tick mark on an axis. This function is particularly useful when you want to selectively show or hide certain tick marks without affecting the entire axis.
Let’s start with a simple example to demonstrate the basic usage of Matplotlib.axis.Tick.set_visible():
import matplotlib.pyplot as plt

# Create a simple plot
fig, ax = plt.subplots()
ax.plot([1, 2, 3, 4], [1, 4, 2, 3])

# Get the first tick on the x-axis
first_tick = ax.xaxis.get_major_ticks()[0]

# Use Matplotlib.axis.Tick.set_visible() to hide the first tick
first_tick.set_visible(False)

plt.title("How to use Matplotlib.axis.Tick.set_visible() - how2matplotlib.com")
plt.show()
Output:
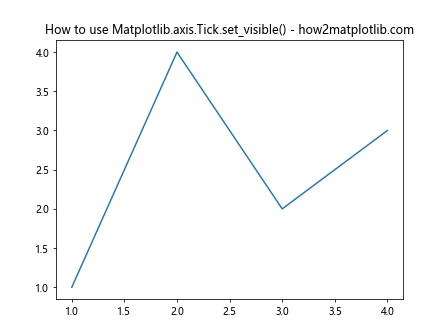
In this example, we create a simple line plot and then use Matplotlib.axis.Tick.set_visible() to hide the first tick on the x-axis. The function takes a boolean argument: True to show the tick, and False to hide it.
Syntax and Parameters of Matplotlib.axis.Tick.set_visible()
The syntax for the Matplotlib.axis.Tick.set_visible() function is straightforward:
Tick.set_visible(visible)
Where:
visibleis a boolean value. If True, the tick will be visible. If False, the tick will be hidden.
It’s important to note that Matplotlib.axis.Tick.set_visible() affects both the tick mark and its label. If you want to control these elements separately, you’ll need to use other methods, which we’ll discuss later in this article.
Accessing Ticks in Matplotlib
Before we can use Matplotlib.axis.Tick.set_visible(), we need to understand how to access individual ticks. Matplotlib provides several methods to do this:
- Using
get_major_ticks()orget_minor_ticks():
import matplotlib.pyplot as plt

fig, ax = plt.subplots()
ax.plot([1, 2, 3, 4], [1, 4, 2, 3])

# Access major ticks
major_ticks = ax.xaxis.get_major_ticks()

# Use Matplotlib.axis.Tick.set_visible() on the second major tick
major_ticks[1].set_visible(False)

plt.title("Accessing ticks with get_major_ticks() - how2matplotlib.com")
plt.show()
Output:
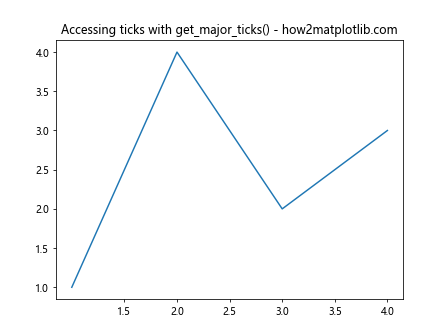
In this example, we use get_major_ticks() to access all major ticks on the x-axis, and then use Matplotlib.axis.Tick.set_visible() to hide the second tick.
- Using
get_ticklabels():
import matplotlib.pyplot as plt

fig, ax = plt.subplots()
ax.plot([1, 2, 3, 4], [1, 4, 2, 3])

# Access tick labels
tick_labels = ax.xaxis.get_ticklabels()

# Use Matplotlib.axis.Tick.set_visible() on the third tick label
tick_labels[2].set_visible(False)

plt.title("Accessing ticks with get_ticklabels() - how2matplotlib.com")
plt.show()
Output:
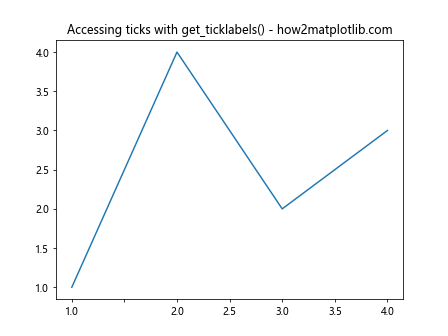
Here, we use get_ticklabels() to access the tick labels, and then use Matplotlib.axis.Tick.set_visible() to hide the third tick label.
Applying Matplotlib.axis.Tick.set_visible() to Multiple Ticks
Often, you might want to apply Matplotlib.axis.Tick.set_visible() to multiple ticks at once. Here’s how you can do that:
import matplotlib.pyplot as plt

fig, ax = plt.subplots()
ax.plot([1, 2, 3, 4, 5, 6], [1, 4, 2, 3, 5, 2])

# Get all major ticks on the x-axis
major_ticks = ax.xaxis.get_major_ticks()

# Use Matplotlib.axis.Tick.set_visible() to hide every second tick
for i, tick in enumerate(major_ticks):
    if i % 2 == 1:
        tick.set_visible(False)

plt.title("Hiding every second tick - how2matplotlib.com")
plt.show()
Output:
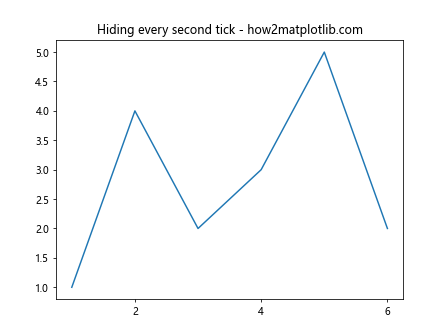
In this example, we use a loop to iterate through all major ticks and use Matplotlib.axis.Tick.set_visible() to hide every second tick.
Using Matplotlib.axis.Tick.set_visible() with Different Plot Types
Matplotlib.axis.Tick.set_visible() can be used with various types of plots. Let’s explore some examples:
- Bar plot:
import matplotlib.pyplot as plt

fig, ax = plt.subplots()
ax.bar(['A', 'B', 'C', 'D', 'E'], [1, 4, 2, 3, 5])

# Get all major ticks on the x-axis
major_ticks = ax.xaxis.get_major_ticks()

# Use Matplotlib.axis.Tick.set_visible() to hide specific ticks
major_ticks[1].set_visible(False)
major_ticks[3].set_visible(False)

plt.title("Using Matplotlib.axis.Tick.set_visible() with bar plot - how2matplotlib.com")
plt.show()
Output:
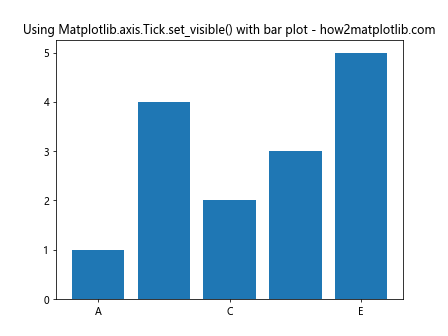
In this bar plot example, we use Matplotlib.axis.Tick.set_visible() to hide the second and fourth ticks.
- Scatter plot:
import matplotlib.pyplot as plt
import numpy as np

fig, ax = plt.subplots()
x = np.linspace(0, 10, 50)
y = np.sin(x)
ax.scatter(x, y)

# Get all major ticks on the y-axis
major_ticks = ax.yaxis.get_major_ticks()

# Use Matplotlib.axis.Tick.set_visible() to hide ticks in the middle
for i, tick in enumerate(major_ticks):
    if i > 1 and i < len(major_ticks) - 2:
        tick.set_visible(False)

plt.title("Using Matplotlib.axis.Tick.set_visible() with scatter plot - how2matplotlib.com")
plt.show()
Output:
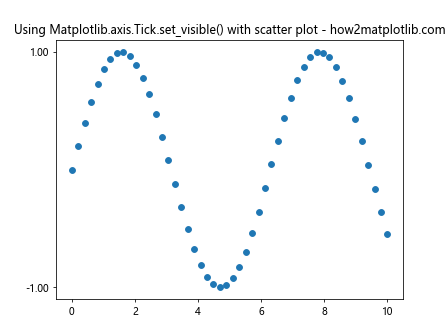
In this scatter plot, we use Matplotlib.axis.Tick.set_visible() to hide the ticks in the middle of the y-axis.
Advanced Applications of Matplotlib.axis.Tick.set_visible()
Now that we've covered the basics, let's explore some more advanced applications of Matplotlib.axis.Tick.set_visible():
- Creating a custom tick visibility pattern:
import matplotlib.pyplot as plt
import numpy as np

fig, ax = plt.subplots()
x = np.linspace(0, 10, 100)
y = np.sin(x)
ax.plot(x, y)

# Get all major ticks on the x-axis
major_ticks = ax.xaxis.get_major_ticks()

# Create a custom visibility pattern
visibility_pattern = [True, False, False, True, False] * 2

# Apply the pattern using Matplotlib.axis.Tick.set_visible()
for tick, visible in zip(major_ticks, visibility_pattern):
    tick.set_visible(visible)

plt.title("Custom tick visibility pattern - how2matplotlib.com")
plt.show()
Output:
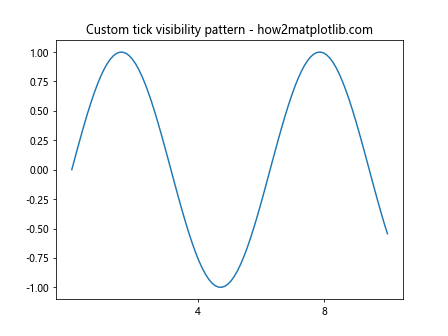
In this example, we create a custom visibility pattern and apply it to the x-axis ticks using Matplotlib.axis.Tick.set_visible().
- Dynamically adjusting tick visibility based on data:
import matplotlib.pyplot as plt
import numpy as np

fig, ax = plt.subplots()
x = np.linspace(0, 10, 100)
y = np.sin(x)
ax.plot(x, y)

# Get all major ticks on the y-axis
major_ticks = ax.yaxis.get_major_ticks()

# Dynamically adjust tick visibility based on y values
for tick in major_ticks:
    tick_value = tick.get_loc()
    if abs(tick_value) < 0.5:
        tick.set_visible(False)
    else:
        tick.set_visible(True)

plt.title("Dynamic tick visibility based on data - how2matplotlib.com")
plt.show()
Output:
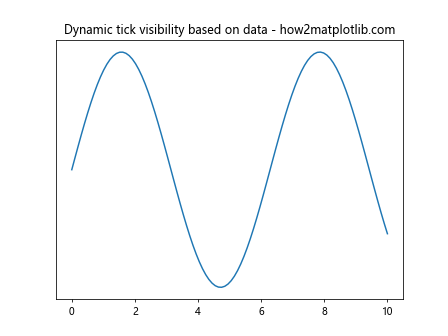
In this advanced example, we use Matplotlib.axis.Tick.set_visible() to dynamically hide ticks on the y-axis that are close to zero.
Handling Tick Visibility in Subplots
When working with subplots, you might want to apply Matplotlib.axis.Tick.set_visible() differently to each subplot. Here's an example:
import matplotlib.pyplot as plt
import numpy as np

fig, (ax1, ax2) = plt.subplots(2, 1, sharex=True)

x = np.linspace(0, 10, 100)
ax1.plot(x, np.sin(x))
ax2.plot(x, np.cos(x))

# Get major ticks for both subplots
ticks1 = ax1.xaxis.get_major_ticks()
ticks2 = ax2.xaxis.get_major_ticks()

# Use Matplotlib.axis.Tick.set_visible() differently for each subplot
for i, (tick1, tick2) in enumerate(zip(ticks1, ticks2)):
    if i % 2 == 0:
        tick1.set_visible(False)
    else:
        tick2.set_visible(False)

plt.suptitle("Handling tick visibility in subplots - how2matplotlib.com")
plt.show()
Output:
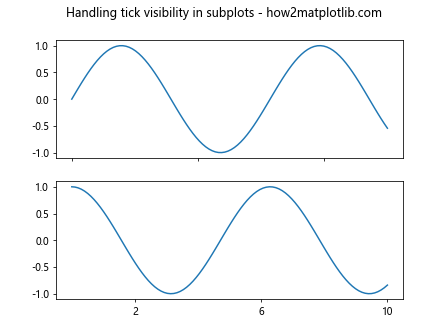
In this example, we create two subplots and use Matplotlib.axis.Tick.set_visible() to hide alternating ticks on each subplot.
Combining Matplotlib.axis.Tick.set_visible() with Locators and Formatters
Matplotlib's locators and formatters can be used in conjunction with Matplotlib.axis.Tick.set_visible() for more precise control over tick placement and appearance:
import matplotlib.pyplot as plt
import matplotlib.ticker as ticker

fig, ax = plt.subplots()
ax.plot([1, 2, 3, 4, 5], [1, 4, 2, 3, 5])

# Set a MultipleLocator
ax.xaxis.set_major_locator(ticker.MultipleLocator(0.5))

# Get all major ticks on the x-axis
major_ticks = ax.xaxis.get_major_ticks()

# Use Matplotlib.axis.Tick.set_visible() to hide every second tick
for i, tick in enumerate(major_ticks):
    if i % 2 == 1:
        tick.set_visible(False)

plt.title("Combining Matplotlib.axis.Tick.set_visible() with MultipleLocator - how2matplotlib.com")
plt.show()
Output:
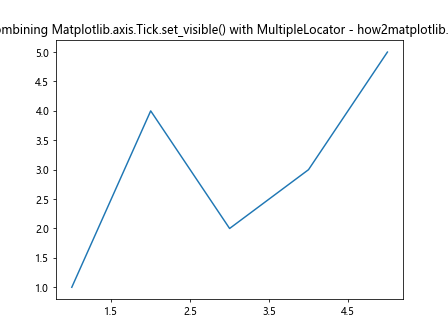
In this example, we use a MultipleLocator to set tick locations every 0.5 units, and then use Matplotlib.axis.Tick.set_visible() to hide every second tick.
Handling Tick Visibility in 3D Plots
Matplotlib.axis.Tick.set_visible() can also be used with 3D plots. Here's an example:
import matplotlib.pyplot as plt
from mpl_toolkits.mplot3d import Axes3D
import numpy as np

fig = plt.figure()
ax = fig.add_subplot(111, projection='3d')

x = np.linspace(-5, 5, 100)
y = np.linspace(-5, 5, 100)
X, Y = np.meshgrid(x, y)
Z = np.sin(np.sqrt(X**2 + Y**2))

ax.plot_surface(X, Y, Z)

# Get major ticks for all axes
xticks = ax.xaxis.get_major_ticks()
yticks = ax.yaxis.get_major_ticks()
zticks = ax.zaxis.get_major_ticks()

# Use Matplotlib.axis.Tick.set_visible() to hide every second tick on each axis
for ticks in [xticks, yticks, zticks]:
    for i, tick in enumerate(ticks):
        if i % 2 == 1:
            tick.set_visible(False)

plt.title("Tick visibility in 3D plots - how2matplotlib.com")
plt.show()
Output:
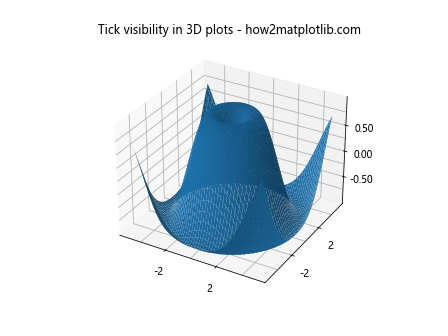
In this 3D plot example, we use Matplotlib.axis.Tick.set_visible() to hide every second tick on all three axes.
Animating Tick Visibility
You can create interesting animations by dynamically changing tick visibility. Here's an example:
import matplotlib.pyplot as plt
import matplotlib.animation as animation
import numpy as np

fig, ax = plt.subplots()
x = np.linspace(0, 10, 100)
line, = ax.plot(x, np.sin(x))

# Get all major ticks on the x-axis
major_ticks = ax.xaxis.get_major_ticks()

def animate(frame):
    # Use Matplotlib.axis.Tick.set_visible() to create a moving pattern
    for i, tick in enumerate(major_ticks):
        tick.set_visible((i + frame) % 3 == 0)
    return line,

ani = animation.FuncAnimation(fig, animate, frames=30, interval=200, blit=True)

plt.title("Animating tick visibility - how2matplotlib.com")
plt.show()
Output:
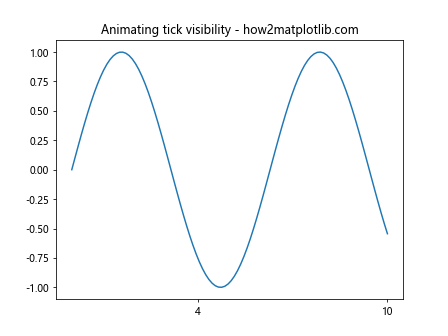
In this animation, we use Matplotlib.axis.Tick.set_visible() to create a moving pattern of tick visibility.
Best Practices for Using Matplotlib.axis.Tick.set_visible()
When using Matplotlib.axis.Tick.set_visible(), keep these best practices in mind:
- Use sparingly: While hiding ticks can clean up your plot, be careful not to remove too much information.
Consider readability: Ensure that hiding certain ticks doesn't make your plot harder to interpret.
Combine with other methods: Use Matplotlib.axis.Tick.set_visible() in conjunction with other customization methods for best results.
Be consistent: If you're hiding ticks, try to do so in a consistent pattern that makes sense for your data.
Document your changes: If you're hiding ticks in a non-standard way, consider adding a note to your plot explaining why.
Troubleshooting Common Issues with Matplotlib.axis.Tick.set_visible()
When working with Matplotlib.axis.Tick.set_visible(), you might encounter some common issues. Here's how to troubleshoot them: