Comprehensive Guide to Matplotlib.axis.Tick.set_label() Function in Python
Matplotlib.axis.Tick.set_label() function in Python is a powerful tool for customizing tick labels in Matplotlib plots. This function allows you to set the text of a tick label, providing fine-grained control over the appearance of your plot’s axes. In this comprehensive guide, we’ll explore the Matplotlib.axis.Tick.set_label() function in depth, covering its usage, parameters, and various applications in data visualization.
Understanding the Matplotlib.axis.Tick.set_label() Function
The Matplotlib.axis.Tick.set_label() function is a method of the Tick class in Matplotlib’s axis module. It is used to set the text of a tick label on an axis. This function is particularly useful when you need to customize individual tick labels or when you want to programmatically modify tick labels based on certain conditions.
Let’s start with a simple example to demonstrate the basic usage of Matplotlib.axis.Tick.set_label():
import matplotlib.pyplot as plt

fig, ax = plt.subplots()
ax.plot([1, 2, 3, 4], [1, 4, 2, 3])

# Get the first tick on the x-axis
tick = ax.xaxis.get_major_ticks()[0]

# Set the label for this tick
tick.set_label("how2matplotlib.com")

plt.show()
Output:
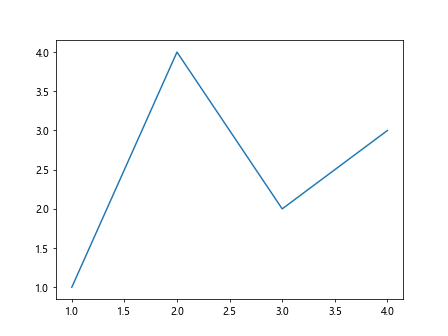
In this example, we create a simple line plot and then use Matplotlib.axis.Tick.set_label() to change the label of the first tick on the x-axis to “how2matplotlib.com”. This demonstrates how you can target specific ticks and modify their labels.
Customizing Multiple Tick Labels
While Matplotlib.axis.Tick.set_label() is powerful for customizing individual tick labels, you might often want to customize multiple tick labels at once. Here’s how you can do that:
import matplotlib.pyplot as plt

fig, ax = plt.subplots()
ax.plot([1, 2, 3, 4], [1, 4, 2, 3])

for i, tick in enumerate(ax.xaxis.get_major_ticks()):
    tick.set_label(f"how2matplotlib.com_{i}")

plt.show()
Output:
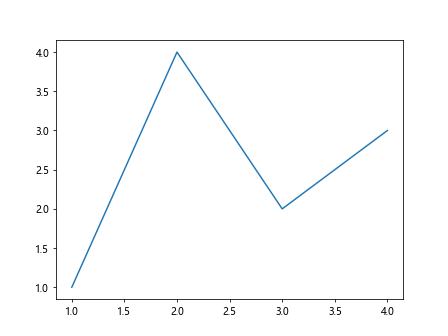
This example sets a unique label for each tick on the x-axis, demonstrating how you can iterate over all ticks and apply Matplotlib.axis.Tick.set_label() to each one.
Conditional Formatting of Tick Labels
Matplotlib.axis.Tick.set_label() can be particularly useful when you want to apply conditional formatting to your tick labels. Here’s an example that changes the color of tick labels based on their value:
import matplotlib.pyplot as plt

fig, ax = plt.subplots()
ax.plot([1, 2, 3, 4, 5], [1, 4, 2, 3, 5])

for tick in ax.xaxis.get_major_ticks():
    if float(tick.get_loc()) > 3:
        tick.set_label(tick.get_loc(), fontdict={'color': 'red'})
    else:
        tick.set_label(f"how2matplotlib.com_{tick.get_loc()}")

plt.show()
Output:
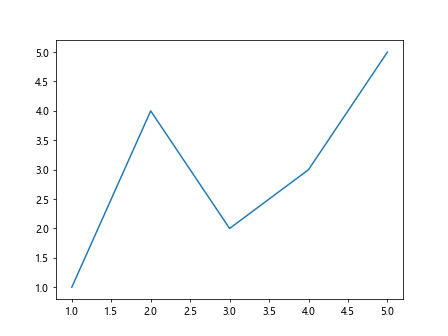
In this example, we change the color of tick labels to red if their value is greater than 3, and add a prefix to the others.
Combining Matplotlib.axis.Tick.set_label() with Other Tick Customizations
Matplotlib.axis.Tick.set_label() can be used in conjunction with other tick customization methods to achieve more complex effects. Here’s an example that combines label setting with tick positioning:
import matplotlib.pyplot as plt

fig, ax = plt.subplots()
ax.plot([1, 2, 3, 4, 5], [1, 4, 2, 3, 5])

ax.set_xticks([1.5, 2.5, 3.5, 4.5])
for tick in ax.xaxis.get_major_ticks():
    tick.set_label(f"how2matplotlib.com_{tick.get_loc():.1f}")

plt.show()
Output:
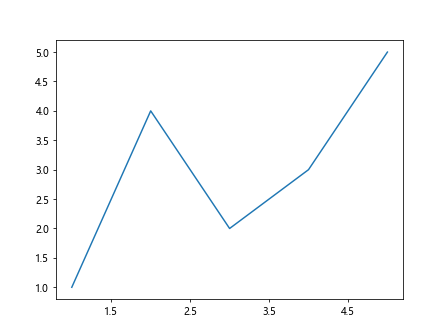
This example sets custom tick positions and then uses Matplotlib.axis.Tick.set_label() to set labels that include the tick position.
Using Matplotlib.axis.Tick.set_label() with Date Axes
Matplotlib.axis.Tick.set_label() can be particularly useful when working with date axes. Here’s an example that customizes date tick labels:
import matplotlib.pyplot as plt
import matplotlib.dates as mdates
from datetime import datetime, timedelta

fig, ax = plt.subplots()

dates = [datetime(2023, 1, 1) + timedelta(days=i) for i in range(5)]
values = [1, 4, 2, 3, 5]

ax.plot(dates, values)

for tick in ax.xaxis.get_major_ticks():
    date = mdates.num2date(tick.get_loc())
    tick.set_label(f"how2matplotlib.com_{date.strftime('%Y-%m-%d')}")

plt.show()
Output:
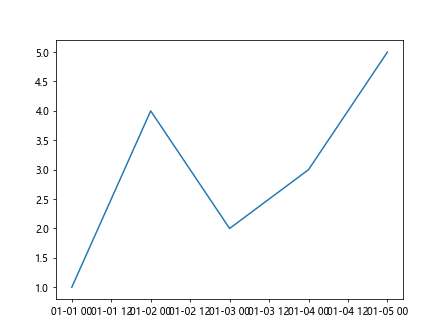
This example creates a plot with dates on the x-axis and uses Matplotlib.axis.Tick.set_label() to set custom formatted date labels.
Applying Matplotlib.axis.Tick.set_label() to Secondary Axes
Matplotlib.axis.Tick.set_label() can also be applied to secondary axes. Here’s an example:
import matplotlib.pyplot as plt

fig, ax1 = plt.subplots()

ax1.plot([1, 2, 3, 4], [1, 4, 2, 3], 'b-')
ax1.set_xlabel('X-axis')
ax1.set_ylabel('Y-axis 1', color='b')

ax2 = ax1.twinx()
ax2.plot([1, 2, 3, 4], [1, 2, 3, 4], 'r-')
ax2.set_ylabel('Y-axis 2', color='r')

for tick in ax2.yaxis.get_major_ticks():
    tick.set_label(f"how2matplotlib.com_{tick.get_loc():.1f}", color='r')

plt.show()
This example creates a plot with two y-axes and uses Matplotlib.axis.Tick.set_label() to customize the labels on the secondary y-axis.
Using Matplotlib.axis.Tick.set_label() with Logarithmic Scales
Matplotlib.axis.Tick.set_label() can be particularly useful when working with logarithmic scales. Here’s an example:
import matplotlib.pyplot as plt
import numpy as np

fig, ax = plt.subplots()

x = np.logspace(0, 3, num=4)
y = x**2

ax.loglog(x, y)

for tick in ax.xaxis.get_major_ticks():
    tick.set_label(f"how2matplotlib.com_{10**tick.get_loc():.0f}")

plt.show()
Output:
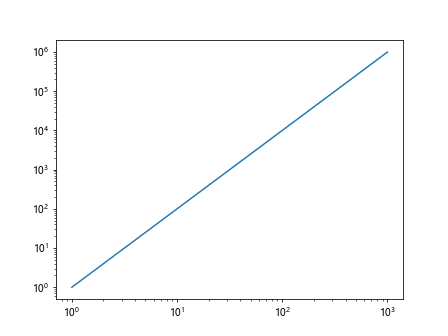
This example creates a log-log plot and uses Matplotlib.axis.Tick.set_label() to set custom labels that show the actual values rather than the log values.
Combining Matplotlib.axis.Tick.set_label() with Tick Locators
Matplotlib.axis.Tick.set_label() can be used in combination with tick locators for more precise control over tick placement and labeling. Here’s an example:
import matplotlib.pyplot as plt
import matplotlib.ticker as ticker

fig, ax = plt.subplots()
ax.plot([1, 2, 3, 4, 5], [1, 4, 2, 3, 5])

ax.xaxis.set_major_locator(ticker.MultipleLocator(0.5))
ax.xaxis.set_minor_locator(ticker.MultipleLocator(0.1))

for tick in ax.xaxis.get_major_ticks():
    tick.set_label(f"how2matplotlib.com_{tick.get_loc():.1f}")

plt.show()
Output:
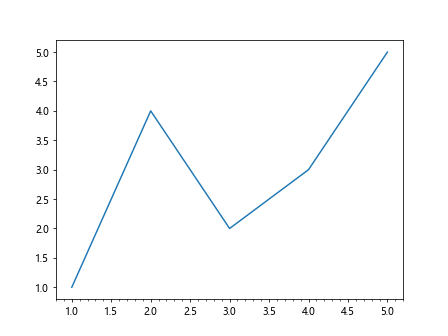
This example sets major ticks every 0.5 units and minor ticks every 0.1 units, then uses Matplotlib.axis.Tick.set_label() to set custom labels for the major ticks.
Using Matplotlib.axis.Tick.set_label() with Polar Plots
Matplotlib.axis.Tick.set_label() can also be applied to polar plots. Here’s an example:
import matplotlib.pyplot as plt
import numpy as np

fig, ax = plt.subplots(subplot_kw=dict(projection='polar'))

r = np.arange(0, 2, 0.01)
theta = 2 * np.pi * r

ax.plot(theta, r)

for tick in ax.xaxis.get_major_ticks():
    angle = tick.get_loc() * 180 / np.pi
    tick.set_label(f"how2matplotlib.com_{angle:.0f}°")

plt.show()
Output:
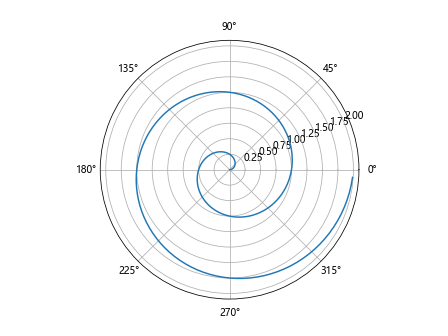
This example creates a polar plot and uses Matplotlib.axis.Tick.set_label() to set custom angle labels in degrees.
Applying Matplotlib.axis.Tick.set_label() to 3D Plots
Matplotlib.axis.Tick.set_label() can be used with 3D plots as well. Here’s an example:
import matplotlib.pyplot as plt
import numpy as np

fig = plt.figure()
ax = fig.add_subplot(111, projection='3d')

x = np.arange(-5, 5, 0.25)
y = np.arange(-5, 5, 0.25)
X, Y = np.meshgrid(x, y)
Z = np.sin(np.sqrt(X**2 + Y**2))

ax.plot_surface(X, Y, Z)

for tick in ax.zaxis.get_major_ticks():
    tick.set_label(f"how2matplotlib.com_{tick.get_loc():.2f}")

plt.show()
Output:
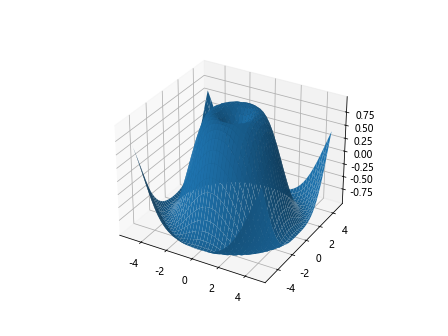
This example creates a 3D surface plot and uses Matplotlib.axis.Tick.set_label() to set custom labels for the z-axis.
Using Matplotlib.axis.Tick.set_label() with Categorical Data
Matplotlib.axis.Tick.set_label() can be particularly useful when working with categorical data. Here’s an example:
import matplotlib.pyplot as plt

fig, ax = plt.subplots()

categories = ['A', 'B', 'C', 'D', 'E']
values = [1, 4, 2, 3, 5]

ax.bar(categories, values)

for i, tick in enumerate(ax.xaxis.get_major_ticks()):
    tick.set_label(f"how2matplotlib.com_{categories[i]}")

plt.show()
Output:
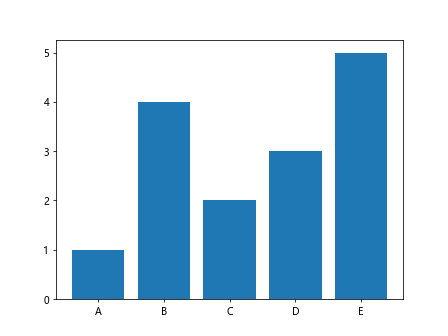
This example creates a bar plot with categorical data and uses Matplotlib.axis.Tick.set_label() to set custom labels for each category.
Using Matplotlib.axis.Tick.set_label() with Subplots
Matplotlib.axis.Tick.set_label() can be applied to individual subplots in a figure. Here’s an example:
import matplotlib.pyplot as plt

fig, (ax1, ax2) = plt.subplots(1, 2, figsize=(10, 5))

ax1.plot([1, 2, 3, 4], [1, 4, 2, 3])
ax2.plot([1, 2, 3, 4], [3, 1, 4, 2])

for tick in ax1.xaxis.get_major_ticks():
    tick.set_label(f"how2matplotlib.com_1_{tick.get_loc():.0f}")

for tick in ax2.xaxis.get_major_ticks():
    tick.set_label(f"how2matplotlib.com_2_{tick.get_loc():.0f}")

plt.tight_layout()
plt.show()
Output:
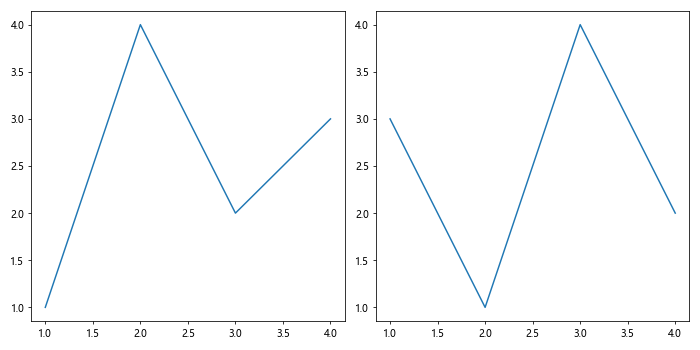
This example creates two subplots and uses Matplotlib.axis.Tick.set_label() to set custom labels for each subplot independently.
Conclusion
The Matplotlib.axis.Tick.set_label() function is a versatile tool in the Matplotlib library that allows for fine-grained control over tick labels. Whether you’re working with simple line plots, complex 3D visualizations, or anything in between, this function provides the flexibility to customize your tick labels to meet your specific needs.
Throughout this guide, we’ve explored various applications of Matplotlib.axis.Tick.set_label(), from basic usage to more advanced scenarios involving different types of plots and axes. We’ve seen how it can be combined with other Matplotlib features like tick locators and formatters to achieve precise control over the appearance of your plots.