Comprehensive Guide to Matplotlib.axis.Tick.set_gid() Function in Python
Matplotlib.axis.Tick.set_gid() function in Python is an essential tool for customizing and identifying specific tick elements in Matplotlib plots. This function allows you to set a unique group id (gid) for a tick object, which can be particularly useful for styling, selecting, or manipulating specific ticks in your visualizations. In this comprehensive guide, we’ll explore the Matplotlib.axis.Tick.set_gid() function in depth, covering its usage, benefits, and providing numerous examples to help you master this powerful feature.
Understanding the Matplotlib.axis.Tick.set_gid() Function
The Matplotlib.axis.Tick.set_gid() function is a method of the Tick class in Matplotlib’s axis module. It is used to set a group id (gid) for a specific tick object. This gid can be used later for various purposes, such as selecting the tick for styling or manipulation in SVG outputs.
Let’s start with a basic example of how to use the Matplotlib.axis.Tick.set_gid() function:
import matplotlib.pyplot as plt

fig, ax = plt.subplots()
ax.plot([1, 2, 3, 4], [1, 4, 2, 3])

# Get the first x-axis tick
tick = ax.xaxis.get_major_ticks()[0]

# Set the gid for the tick
tick.set_gid('how2matplotlib.com_first_tick')

plt.show()
Output:
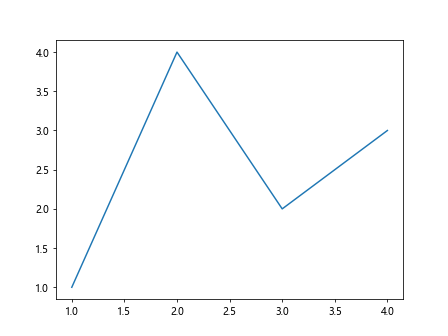
In this example, we create a simple line plot and then access the first major tick on the x-axis. We use the Matplotlib.axis.Tick.set_gid() function to set a unique gid for this tick. This gid can be used later for various purposes, such as styling or selecting the tick in SVG outputs.
Benefits of Using Matplotlib.axis.Tick.set_gid()
The Matplotlib.axis.Tick.set_gid() function offers several advantages when working with Matplotlib plots:
- Identification: It allows you to uniquely identify specific ticks, making it easier to manipulate them later.
- Styling: You can use the gid to apply specific styles to individual ticks in SVG outputs.
- Interactivity: When creating interactive plots, you can use the gid to associate specific behaviors with particular ticks.
- SVG manipulation: The gid can be used to select and modify ticks in SVG outputs using external tools or scripts.
Applying Matplotlib.axis.Tick.set_gid() to Different Tick Types
The Matplotlib.axis.Tick.set_gid() function can be applied to both major and minor ticks on both x and y axes. Let’s explore how to use this function with different tick types:
Setting gid for Major X-axis Ticks
import matplotlib.pyplot as plt

fig, ax = plt.subplots()
ax.plot([1, 2, 3, 4], [1, 4, 2, 3])

# Set gid for all major x-axis ticks
for i, tick in enumerate(ax.xaxis.get_major_ticks()):
    tick.set_gid(f'how2matplotlib.com_x_major_tick_{i}')

plt.show()
Output:

In this example, we iterate through all major x-axis ticks and set a unique gid for each one using the Matplotlib.axis.Tick.set_gid() function.
Advanced Usage of Matplotlib.axis.Tick.set_gid()
Now that we’ve covered the basics, let’s explore some more advanced applications of the Matplotlib.axis.Tick.set_gid() function:
Conditional gid Assignment
You can use conditional statements to assign gids based on certain criteria:
import matplotlib.pyplot as plt
import numpy as np
fig, ax = plt.subplots()
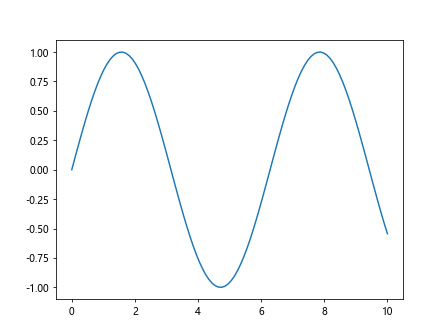
x = np.linspace(0, 10, 100)
ax.plot(x, np.sin(x))
for tick in ax.xaxis.get_major_ticks():
if tick.get_loc() % 2 == 0:
tick.set_gid('how2matplotlib.com_even_tick')
else:
tick.set_gid('how2matplotlib.com_odd_tick')
plt.show()
Output:

In this example, we use the Matplotlib.axis.Tick.set_gid() function to assign different gids to even and odd ticks on the x-axis.
Using gids with Custom Tick Formatters
You can combine the Matplotlib.axis.Tick.set_gid() function with custom tick formatters for more complex tick labeling:
import matplotlib.pyplot as plt
import matplotlib.ticker as ticker

def custom_formatter(x, pos):
    if x.is_integer():
        return f'{int(x)}°'
    else:
        return f'{x:.1f}°'

fig, ax = plt.subplots()
ax.plot([0, 90, 180, 270, 360], [0, 1, 0, -1, 0])

ax.xaxis.set_major_formatter(ticker.FuncFormatter(custom_formatter))

for tick in ax.xaxis.get_major_ticks():
    if tick.get_loc() % 90 == 0:
        tick.set_gid('how2matplotlib.com_right_angle')
    else:
        tick.set_gid('how2matplotlib.com_other_angle')

plt.show()
Output:
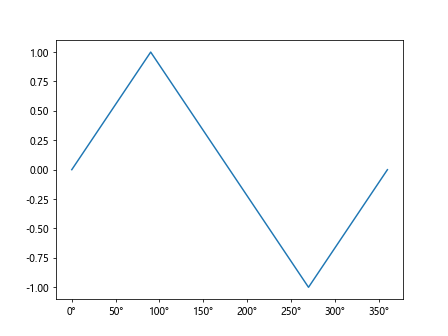
This example demonstrates how to use the Matplotlib.axis.Tick.set_gid() function in conjunction with a custom tick formatter to create a more informative angle plot.
Matplotlib.axis.Tick.set_gid() in Multi-plot Figures
The Matplotlib.axis.Tick.set_gid() function can also be useful when working with multi-plot figures. Let’s explore how to use it in this context:
Setting gids in Subplots
import matplotlib.pyplot as plt
import numpy as np

fig, (ax1, ax2) = plt.subplots(2, 1, sharex=True)

x = np.linspace(0, 10, 100)
ax1.plot(x, np.sin(x))
ax2.plot(x, np.cos(x))

for i, ax in enumerate([ax1, ax2]):
    for j, tick in enumerate(ax.yaxis.get_major_ticks()):
        tick.set_gid(f'how2matplotlib.com_subplot_{i}_ytick_{j}')

plt.show()
Output:
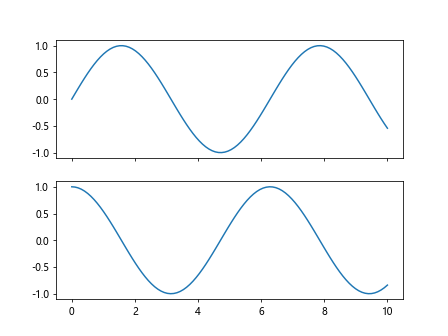
In this example, we use the Matplotlib.axis.Tick.set_gid() function to set unique gids for y-axis ticks in each subplot.
Using gids in GridSpec Layouts
import matplotlib.pyplot as plt
import matplotlib.gridspec as gridspec

fig = plt.figure(figsize=(10, 6))
gs = gridspec.GridSpec(2, 2)

ax1 = fig.add_subplot(gs[0, 0])
ax2 = fig.add_subplot(gs[0, 1])
ax3 = fig.add_subplot(gs[1, :])

axes = [ax1, ax2, ax3]

for i, ax in enumerate(axes):
    ax.plot([1, 2, 3, 4], [1, 4, 2, 3])
    for j, tick in enumerate(ax.xaxis.get_major_ticks()):
        tick.set_gid(f'how2matplotlib.com_gridspec_ax{i}_xtick_{j}')

plt.tight_layout()
plt.show()
Output:
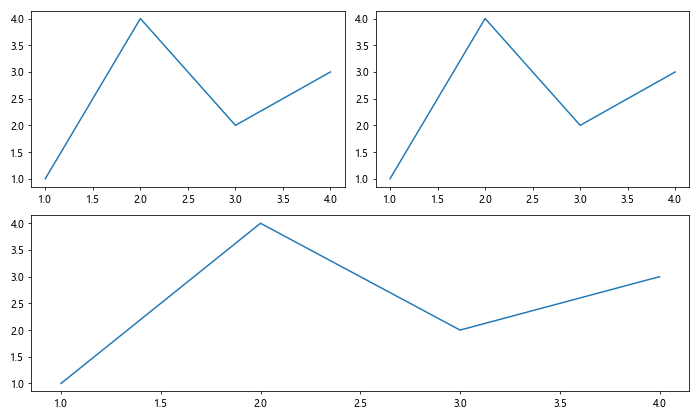
This example shows how to use the Matplotlib.axis.Tick.set_gid() function with a GridSpec layout to set unique gids for x-axis ticks in different subplots.
Matplotlib.axis.Tick.set_gid() and Tick Styling
The Matplotlib.axis.Tick.set_gid() function can be particularly useful when you want to apply specific styles to certain ticks. While the styling itself is typically done in CSS when working with SVG outputs, setting gids allows you to target specific ticks for styling.
Preparing Ticks for Custom Styling
import matplotlib.pyplot as plt
import numpy as np

fig, ax = plt.subplots()
x = np.linspace(0, 10, 100)
ax.plot(x, np.sin(x))

for tick in ax.xaxis.get_major_ticks():
    if tick.get_loc() % 2 == 0:
        tick.set_gid('how2matplotlib.com_even_tick')
        tick.label1.set_gid('how2matplotlib.com_even_tick_label')
    else:
        tick.set_gid('how2matplotlib.com_odd_tick')
        tick.label1.set_gid('how2matplotlib.com_odd_tick_label')

plt.show()
Output:

In this example, we use the Matplotlib.axis.Tick.set_gid() function to set different gids for even and odd ticks, as well as their labels. This setup allows for easy styling of these elements in SVG outputs.
Matplotlib.axis.Tick.set_gid() in Interactive Plots
When creating interactive plots, the Matplotlib.axis.Tick.set_gid() function can be used to associate specific behaviors with particular ticks. Here’s an example of how you might use this in conjunction with the mplcursors library:
import matplotlib.pyplot as plt
import numpy as np
import mplcursors

fig, ax = plt.subplots()
x = np.linspace(0, 10, 100)
ax.plot(x, np.sin(x))

for i, tick in enumerate(ax.xaxis.get_major_ticks()):
    tick.set_gid(f'how2matplotlib.com_xtick_{i}')

cursor = mplcursors.cursor(hover=True)

@cursor.connect("add")
def on_add(sel):
    if sel.artist.get_gid() and sel.artist.get_gid().startswith('how2matplotlib.com_xtick_'):
        sel.annotation.set_text(f"X-tick: {sel.target[0]:.2f}")

plt.show()
Output:
In this example, we use the Matplotlib.axis.Tick.set_gid() function to set unique gids for x-axis ticks. We then use mplcursors to create an interactive hover effect that displays the x-value when hovering over a tick.
Matplotlib.axis.Tick.set_gid() and Custom Tick Locations
The Matplotlib.axis.Tick.set_gid() function can be particularly useful when working with custom tick locations. Let’s explore an example:
import matplotlib.pyplot as plt
import numpy as np

fig, ax = plt.subplots()
x = np.linspace(0, 10, 100)
ax.plot(x, np.sin(x))

custom_ticks = [0, np.pi/2, np.pi, 3*np.pi/2, 2*np.pi]
ax.set_xticks(custom_ticks)

for i, tick in enumerate(ax.xaxis.get_major_ticks()):
    tick.set_gid(f'how2matplotlib.com_custom_tick_{i}')
    if i % 2 == 0:
        tick.label1.set_color('red')

plt.show()
Output:
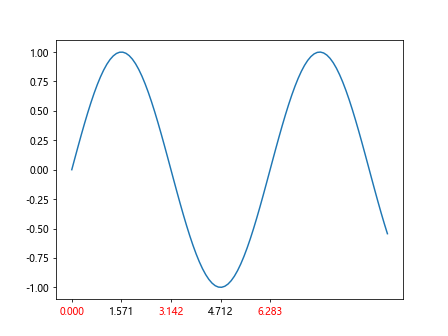
In this example, we set custom tick locations and use the Matplotlib.axis.Tick.set_gid() function to assign unique gids to each tick. We also demonstrate how to style specific ticks based on their index.
Matplotlib.axis.Tick.set_gid() in 3D Plots
The Matplotlib.axis.Tick.set_gid() function can also be used with 3D plots. Here’s an example:
import matplotlib.pyplot as plt
import numpy as np
from mpl_toolkits.mplot3d import Axes3D

fig = plt.figure()
ax = fig.add_subplot(111, projection='3d')

x = np.linspace(-5, 5, 100)
y = np.linspace(-5, 5, 100)
X, Y = np.meshgrid(x, y)
Z = np.sin(np.sqrt(X**2 + Y**2))

ax.plot_surface(X, Y, Z)

for axis in [ax.xaxis, ax.yaxis, ax.zaxis]:
    for i, tick in enumerate(axis.get_major_ticks()):
        tick.set_gid(f'how2matplotlib.com_3d_{axis.axis_name}_tick_{i}')

plt.show()
Output:
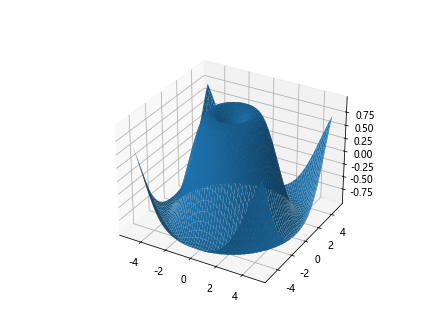
In this example, we create a 3D surface plot and use the Matplotlib.axis.Tick.set_gid() function to set unique gids for ticks on all three axes.
Matplotlib.axis.Tick.set_gid() and Logarithmic Scales
The Matplotlib.axis.Tick.set_gid() function can be particularly useful when working with logarithmic scales. Here’s an example:
import matplotlib.pyplot as plt
import numpy as np

fig, ax = plt.subplots()
x = np.logspace(0, 3, 100)
y = x**2

ax.loglog(x, y)

for axis in [ax.xaxis, ax.yaxis]:
    for i, tick in enumerate(axis.get_major_ticks()):
        tick.set_gid(f'how2matplotlib.com_log_{axis.axis_name}_tick_{i}')
        if i % 3 == 0:
            tick.label1.set_fontweight('bold')

plt.show()
Output:
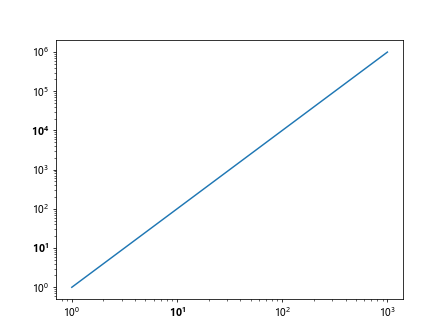
In this example, we create a log-log plot and use the Matplotlib.axis.Tick.set_gid() function to set unique gids for ticks on both axes. We also demonstrate how to style specific ticks based on their index.
Matplotlib.axis.Tick.set_gid() in Polar Plots
The Matplotlib.axis.Tick.set_gid() function can also be applied to polar plots. Here’s an example:
import matplotlib.pyplot as plt
import numpy as np

fig, ax = plt.subplots(subplot_kw=dict(projection='polar'))
r = np.linspace(0, 1, 100)
theta = 2 * np.pi * r

ax.plot(theta, r)

for i, tick in enumerate(ax.xaxis.get_major_ticks()):
    tick.set_gid(f'how2matplotlib.com_polar_theta_tick_{i}')

for i, tick in enumerate(ax.yaxis.get_major_ticks()):
    tick.set_gid(f'how2matplotlib.com_polar_r_tick_{i}')

plt.show()
Output:
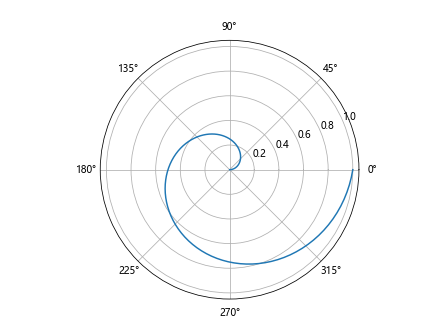
In this example, we create a polar plot and use the Matplotlib.axis.Tick.set_gid() function to set unique gids for both angular (theta) and radial (r) ticks.
Matplotlib.axis.Tick.set_gid() and Custom Tick Locators
The Matplotlib.axis.Tick.set_gid() function can be combined with custom tick locators for more precise control over tick placement and identification. Here’s an example:
import matplotlib.pyplot as plt
import matplotlib.ticker as ticker
import numpy as np

class CustomLocator(ticker.Locator):
    def __init__(self, base=1.0):
        self.base = base

    def __call__(self):
        vmin, vmax = self.axis.get_view_interval()
        return np.arange(np.ceil(vmin / self.base) * self.base,
                         np.floor(vmax / self.base) * self.base + 0.5 * self.base,
                         self.base)

fig, ax = plt.subplots()
x = np.linspace(0, 10, 100)
ax.plot(x, np.sin(x))

ax.xaxis.set_major_locator(CustomLocator(base=np.pi/2))

for i, tick in enumerate(ax.xaxis.get_major_ticks()):
    tick.set_gid(f'how2matplotlib.com_custom_locator_tick_{i}')

plt.show()
In this example, we define a custom tick locator that places ticks at multiples of π/2. We then use the Matplotlib.axis.Tick.set_gid() function to assign unique gids to each of these custom-placed ticks.
Matplotlib.axis.Tick.set_gid() in Animations
The Matplotlib.axis.Tick.set_gid() function can also be useful when creating animations. Here’s an example of how you might use it in an animated plot:
import matplotlib.pyplot as plt
import matplotlib.animation as animation
import numpy as np

fig, ax = plt.subplots()
x = np.linspace(0, 2*np.pi, 100)
line, = ax.plot(x, np.sin(x))

def animate(i):
    line.set_ydata(np.sin(x + i/10))
    for j, tick in enumerate(ax.xaxis.get_major_ticks()):
        tick.set_gid(f'how2matplotlib.com_animated_tick_{j}_{i}')
    return line,

ani = animation.FuncAnimation(fig, animate, frames=100, blit=True)
plt.show()
In this animation, we use the Matplotlib.axis.Tick.set_gid() function to update the gids of the x-axis ticks in each frame. This could be useful for tracking or styling specific ticks during the animation.
Matplotlib.axis.Tick.set_gid() and Tick Visibility
The Matplotlib.axis.Tick.set_gid() function can be combined with tick visibility settings for more complex tick management:
import matplotlib.pyplot as plt
import numpy as np

fig, ax = plt.subplots()
x = np.linspace(0, 10, 100)
ax.plot(x, np.sin(x))

for i, tick in enumerate(ax.xaxis.get_major_ticks()):
    tick.set_gid(f'how2matplotlib.com_xtick_{i}')
    if i % 2 == 0:
        tick.set_visible(False)
    else:
        tick.label1.set_fontweight('bold')

plt.show()
In this example, we use the Matplotlib.axis.Tick.set_gid() function to set gids for all ticks, but we also manipulate their visibility and style based on their index.
Matplotlib.axis.Tick.set_gid() in Colorbar Ticks
The Matplotlib.axis.Tick.set_gid() function can also be applied to colorbar ticks. Here’s an example:
import matplotlib.pyplot as plt
import numpy as np

fig, ax = plt.subplots()
data = np.random.rand(10, 10)
im = ax.imshow(data)

cbar = fig.colorbar(im)
for i, tick in enumerate(cbar.ax.yaxis.get_major_ticks()):
    tick.set_gid(f'how2matplotlib.com_colorbar_tick_{i}')

plt.show()
In this example, we create a colorbar for an image plot and use the Matplotlib.axis.Tick.set_gid() function to set unique gids for each tick on the colorbar.
Matplotlib.axis.Tick.set_gid() and Tick Parameters
The Matplotlib.axis.Tick.set_gid() function can be used in conjunction with tick parameter settings for fine-grained control over tick appearance:
import matplotlib.pyplot as plt
import numpy as np

fig, ax = plt.subplots()
x = np.linspace(0, 10, 100)
ax.plot(x, np.sin(x))

ax.tick_params(axis='x', which='major', length=10, width=2, color='red', pad=15)

for i, tick in enumerate(ax.xaxis.get_major_ticks()):
    tick.set_gid(f'how2matplotlib.com_custom_param_tick_{i}')

plt.show()
In this example, we set custom tick parameters and then use the Matplotlib.axis.Tick.set_gid() function to assign unique gids to each tick.
Matplotlib.axis.Tick.set_gid() in Shared Axis Plots
The Matplotlib.axis.Tick.set_gid() function can be particularly useful when working with shared axis plots:
import matplotlib.pyplot as plt
import numpy as np

fig, (ax1, ax2) = plt.subplots(2, 1, sharex=True)
x = np.linspace(0, 10, 100)

ax1.plot(x, np.sin(x))
ax2.plot(x, np.cos(x))

for i, tick in enumerate(ax2.xaxis.get_major_ticks()):
    tick.set_gid(f'how2matplotlib.com_shared_xtick_{i}')

plt.show()
In this example, we create two subplots with a shared x-axis and use the Matplotlib.axis.Tick.set_gid() function to set unique gids for the shared x-axis ticks.
Conclusion
The Matplotlib.axis.Tick.set_gid() function is a powerful tool for customizing and identifying specific tick elements in Matplotlib plots. Throughout this comprehensive guide, we’ve explored various applications of this function, from basic usage to advanced techniques in different types of plots and scenarios.
By using the Matplotlib.axis.Tick.set_gid() function, you can:
- Uniquely identify specific ticks for later manipulation or styling
- Enhance the interactivity of your plots
- Improve the accessibility and selectability of tick elements in SVG outputs
- Create more complex and customized tick arrangements
Whether you’re working with simple line plots, complex 3D visualizations, or animated graphs, the Matplotlib.axis.Tick.set_gid() function provides a flexible way to manage and customize your tick elements. By mastering this function, you’ll be able to create more sophisticated and tailored visualizations that meet your specific needs.