How to Rotate Colorbar Tick Labels in Matplotlib
Rotation of colorbar tick labels in Matplotlib is an essential skill for data visualization enthusiasts. This article will delve deep into the various aspects of rotating colorbar tick labels in Matplotlib, providing you with a thorough understanding of the topic. We’ll explore different methods, techniques, and best practices for achieving the perfect rotation of colorbar tick labels in your Matplotlib plots.
Understanding Colorbars and Tick Labels in Matplotlib
Before we dive into the rotation of colorbar tick labels in Matplotlib, let’s first understand what colorbars and tick labels are in the context of data visualization.
A colorbar in Matplotlib is a visual representation of the mapping between color values and data values in a plot. It serves as a legend for color-coded plots, helping viewers interpret the data represented by different colors. Tick labels on a colorbar are the textual or numerical annotations that indicate specific values along the colorbar.
Rotation of colorbar tick labels in Matplotlib becomes necessary when the default horizontal orientation of labels causes overlapping or readability issues, especially with long labels or limited space.
Let’s start with a basic example of creating a colorbar with default tick labels:
import matplotlib.pyplot as plt
import numpy as np

# Create sample data
data = np.random.rand(10, 10)

# Create a figure and axis
fig, ax = plt.subplots(figsize=(8, 6))

# Create a color-mapped plot
im = ax.imshow(data, cmap='viridis')

# Add a colorbar
cbar = plt.colorbar(im)

# Set the title
plt.title("Colorbar with Default Tick Labels - how2matplotlib.com")

# Show the plot
plt.show()
Output:
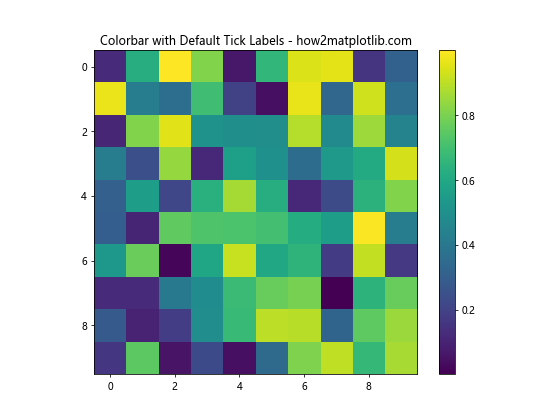
In this example, we create a simple color-mapped plot with a colorbar. The tick labels on the colorbar are in their default horizontal orientation. Now, let’s explore how to rotate these labels.
Basic Rotation of Colorbar Tick Labels in Matplotlib
The simplest way to achieve rotation of colorbar tick labels in Matplotlib is by using the set_yticklabels() method of the colorbar object. This method allows you to rotate the labels by specifying the rotation angle.
Here’s an example demonstrating the basic rotation of colorbar tick labels in Matplotlib:
import matplotlib.pyplot as plt
import numpy as np

# Create sample data
data = np.random.rand(10, 10)

# Create a figure and axis
fig, ax = plt.subplots(figsize=(8, 6))

# Create a color-mapped plot
im = ax.imshow(data, cmap='viridis')

# Add a colorbar
cbar = plt.colorbar(im)

# Rotate the colorbar tick labels
cbar.ax.set_yticklabels(cbar.ax.get_yticklabels(), rotation=45)

# Set the title
plt.title("Rotated Colorbar Tick Labels - how2matplotlib.com")

# Show the plot
plt.show()
Output:
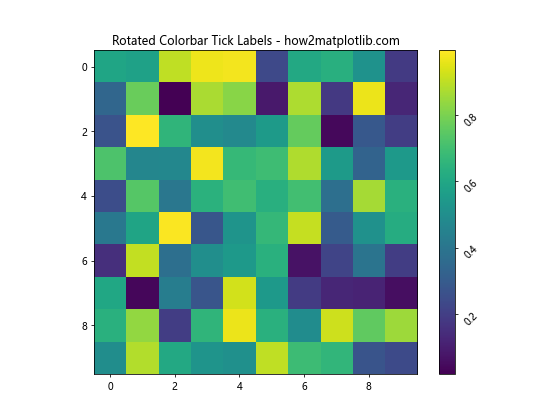
In this example, we use cbar.ax.set_yticklabels() to rotate the colorbar tick labels by 45 degrees. The get_yticklabels() method retrieves the current tick labels, which we then pass back to set_yticklabels() with the desired rotation.
Advanced Techniques for Rotation of Colorbar Tick Labels in Matplotlib
While the basic method works well for simple cases, there are more advanced techniques for rotation of colorbar tick labels in Matplotlib that offer greater control and flexibility.
Using tick_params for Rotation
The tick_params() method provides a more comprehensive way to modify tick properties, including label rotation. Here’s an example:
import matplotlib.pyplot as plt
import numpy as np

# Create sample data
data = np.random.rand(10, 10)

# Create a figure and axis
fig, ax = plt.subplots(figsize=(8, 6))

# Create a color-mapped plot
im = ax.imshow(data, cmap='coolwarm')

# Add a colorbar
cbar = plt.colorbar(im)

# Rotate the colorbar tick labels using tick_params
cbar.ax.tick_params(axis='y', rotation=60, labelsize=10)

# Set the title
plt.title("Rotated Colorbar Tick Labels with tick_params - how2matplotlib.com")

# Show the plot
plt.show()
Output:
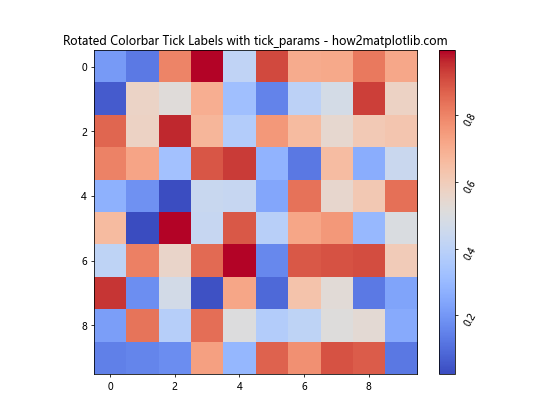
In this example, we use cbar.ax.tick_params() to rotate the colorbar tick labels by 60 degrees and set their font size to 10 points. This method offers more control over various tick properties in a single function call.
Customizing Individual Tick Labels
For even more precise control, you can customize individual tick labels. This is particularly useful when you want different rotations or styles for different labels:
import matplotlib.pyplot as plt
import numpy as np

# Create sample data
data = np.random.rand(10, 10)

# Create a figure and axis
fig, ax = plt.subplots(figsize=(8, 6))

# Create a color-mapped plot
im = ax.imshow(data, cmap='plasma')

# Add a colorbar
cbar = plt.colorbar(im)

# Get the current tick locations and labels
locs = cbar.ax.get_yticks()
labels = cbar.ax.get_yticklabels()

# Customize individual labels
new_labels = []
for i, label in enumerate(labels):
    if i % 2 == 0:
        label.set_rotation(30)
    else:
        label.set_rotation(60)
    new_labels.append(label)

# Set the new labels
cbar.ax.set_yticklabels(new_labels)

# Set the title
plt.title("Customized Individual Colorbar Tick Labels - how2matplotlib.com")

# Show the plot
plt.show()
Output:
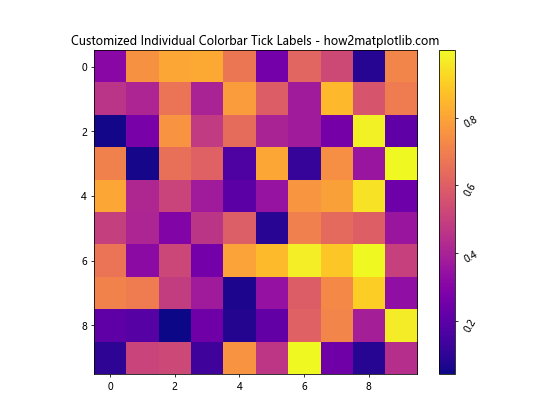
In this example, we alternate between 30-degree and 60-degree rotations for the colorbar tick labels, demonstrating how to apply different rotations to individual labels.
Handling Long Labels in Colorbar Tick Rotation
When dealing with long labels, rotation of colorbar tick labels in Matplotlib becomes even more crucial for readability. Let’s explore some techniques to handle long labels effectively.
Adjusting Colorbar Position
One approach is to adjust the position of the colorbar to accommodate rotated long labels:
import matplotlib.pyplot as plt
import numpy as np

# Create sample data
data = np.random.rand(10, 10)

# Create a figure and axis
fig, ax = plt.subplots(figsize=(10, 6))

# Create a color-mapped plot
im = ax.imshow(data, cmap='viridis')

# Add a colorbar with adjusted position
cbar = plt.colorbar(im, pad=0.2)

# Set long labels
long_labels = [f"Long Label {i} - how2matplotlib.com" for i in range(5)]
cbar.set_ticks(np.linspace(0, 1, 5))
cbar.set_ticklabels(long_labels)

# Rotate the colorbar tick labels
cbar.ax.set_yticklabels(cbar.ax.get_yticklabels(), rotation=45, ha='right')

# Set the title
plt.title("Rotated Long Colorbar Tick Labels - how2matplotlib.com")

# Show the plot
plt.show()
Output:
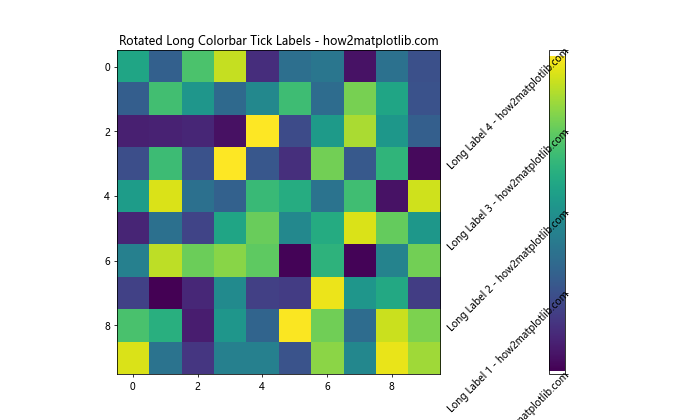
In this example, we use pad=0.2 when creating the colorbar to give more space for the rotated labels. We also set ha='right' to align the rotated labels properly.
Using Text Wrapping for Long Labels
Another approach is to wrap long text labels instead of rotating them:
import matplotlib.pyplot as plt
import numpy as np
import textwrap

# Create sample data
data = np.random.rand(10, 10)

# Create a figure and axis
fig, ax = plt.subplots(figsize=(10, 6))

# Create a color-mapped plot
im = ax.imshow(data, cmap='viridis')

# Add a colorbar
cbar = plt.colorbar(im)

# Set long labels and wrap them
long_labels = [f"Long Label {i} for how2matplotlib.com" for i in range(5)]
wrapped_labels = [textwrap.fill(label, width=20) for label in long_labels]

cbar.set_ticks(np.linspace(0, 1, 5))
cbar.set_ticklabels(wrapped_labels)

# Set the title
plt.title("Wrapped Long Colorbar Tick Labels - how2matplotlib.com")

# Show the plot
plt.show()
Output:
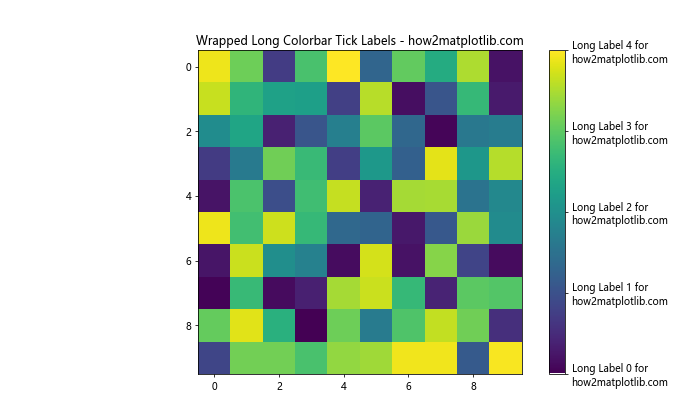
In this example, we use the textwrap.fill() function to wrap long labels instead of rotating them. This can be a good alternative when rotation doesn’t provide satisfactory results.
Colorbar Tick Label Rotation in Different Plot Types
The rotation of colorbar tick labels in Matplotlib can be applied to various types of plots. Let’s explore how to rotate colorbar tick labels in different plot types.
Heatmaps
Heatmaps are a common use case for colorbars. Here’s an example of rotating colorbar tick labels in a heatmap:
import matplotlib.pyplot as plt
import numpy as np

# Create sample data
data = np.random.rand(10, 12)

# Create a figure and axis
fig, ax = plt.subplots(figsize=(10, 8))

# Create a heatmap
im = ax.imshow(data, cmap='YlOrRd')

# Add a colorbar
cbar = plt.colorbar(im)

# Rotate the colorbar tick labels
cbar.ax.set_yticklabels(cbar.ax.get_yticklabels(), rotation=45, ha='right')

# Set the title
plt.title("Heatmap with Rotated Colorbar Tick Labels - how2matplotlib.com")

# Show the plot
plt.show()
Output:
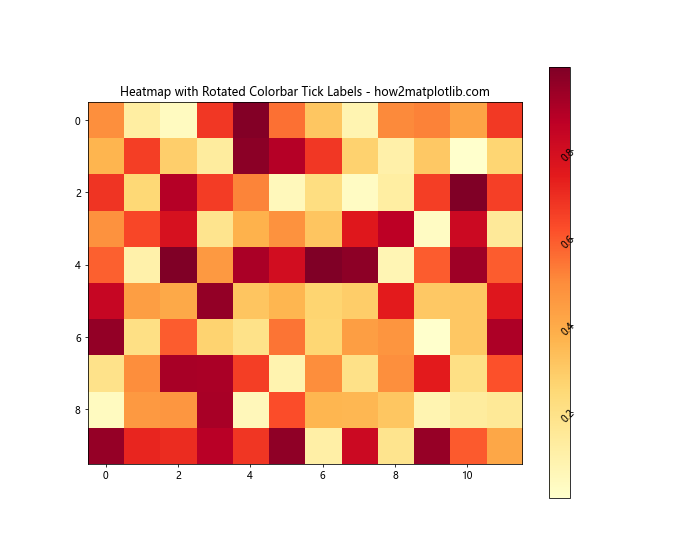
In this heatmap example, we rotate the colorbar tick labels by 45 degrees and align them to the right for better readability.
Contour Plots
Contour plots also benefit from colorbar tick label rotation. Here’s an example:
import matplotlib.pyplot as plt
import numpy as np

# Create sample data
x = np.linspace(-3, 3, 100)
y = np.linspace(-3, 3, 100)
X, Y = np.meshgrid(x, y)
Z = np.sin(X) * np.cos(Y)

# Create a figure and axis
fig, ax = plt.subplots(figsize=(10, 8))

# Create a contour plot
cs = ax.contourf(X, Y, Z, cmap='coolwarm')

# Add a colorbar
cbar = plt.colorbar(cs)

# Rotate the colorbar tick labels
cbar.ax.set_yticklabels(cbar.ax.get_yticklabels(), rotation=30)

# Set the title
plt.title("Contour Plot with Rotated Colorbar Tick Labels - how2matplotlib.com")

# Show the plot
plt.show()
Output:
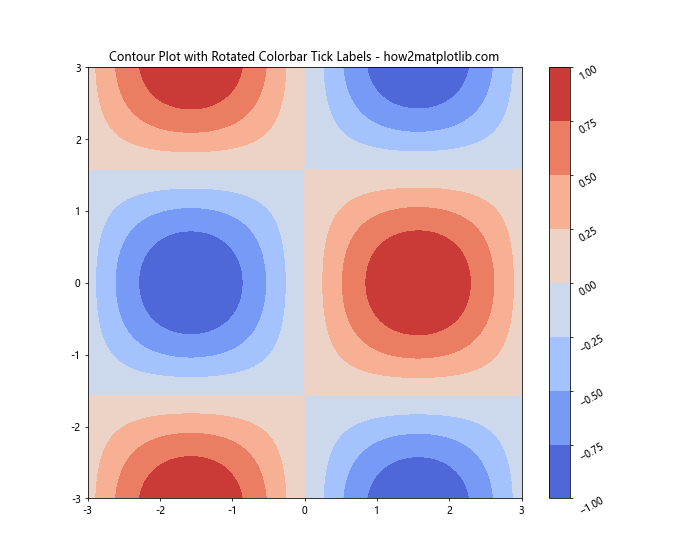
In this contour plot example, we rotate the colorbar tick labels by 30 degrees to improve their visibility without overlapping.
Advanced Customization of Rotated Colorbar Tick Labels
Let’s explore some advanced customization options for rotation of colorbar tick labels in Matplotlib.
Changing Font Properties
You can change various font properties of the rotated tick labels:
import matplotlib.pyplot as plt
import numpy as np

# Create sample data
data = np.random.rand(10, 10)

# Create a figure and axis
fig, ax = plt.subplots(figsize=(10, 8))

# Create a color-mapped plot
im = ax.imshow(data, cmap='viridis')

# Add a colorbar
cbar = plt.colorbar(im)

# Customize and rotate the colorbar tick labels
for label in cbar.ax.get_yticklabels():
    label.set_rotation(45)
    label.set_fontname('Arial')
    label.set_fontsize(10)
    label.set_fontweight('bold')

# Set the title
plt.title("Customized Font for Rotated Colorbar Tick Labels - how2matplotlib.com")

# Show the plot
plt.show()
Output:
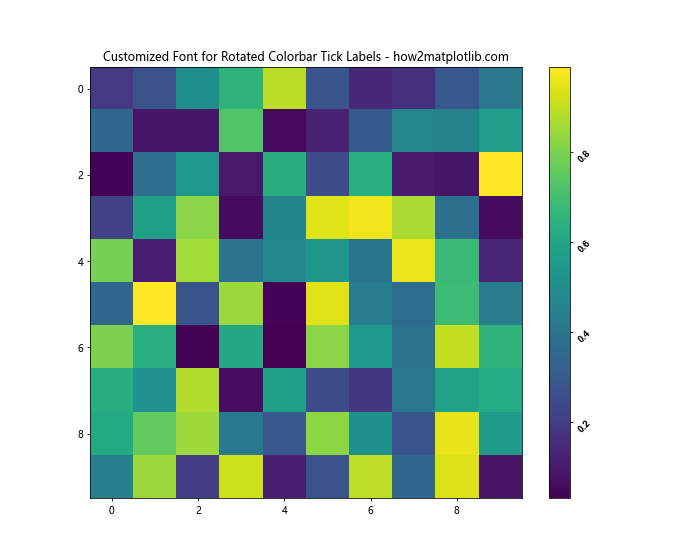
In this example, we customize the font properties of each rotated tick label, changing the font family, size, and weight.
Adding a Background to Rotated Labels
To improve readability, you can add a background to the rotated labels:
import matplotlib.pyplot as plt
import numpy as np

# Create sample data
data = np.random.rand(10, 10)

# Create a figure and axis
fig, ax = plt.subplots(figsize=(10, 8))

# Create a color-mapped plot
im = ax.imshow(data, cmap='plasma')

# Add a colorbar
cbar = plt.colorbar(im)

# Rotate and add background to colorbar tick labels
for label in cbar.ax.get_yticklabels():
    label.set_rotation(45)
    label.set_bbox(dict(facecolor='white', edgecolor='none', alpha=0.7))

# Set the title
plt.title("Rotated Colorbar Tick Labels with Background - how2matplotlib.com")

# Show the plot
plt.show()
Output:
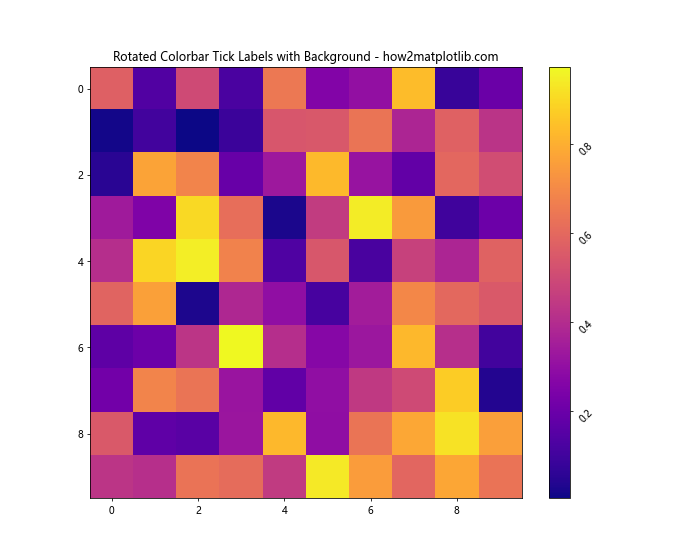
In this example, we add a semi-transparent white background to each rotated label to make them stand out against the colorbar.
Handling Colorbar Tick Label Rotation in Subplots
When working with subplots, you may need to rotate colorbar tick labels for multiple plots. Here’s an example of how to handle this:
import matplotlib.pyplot as plt
import numpy as np

# Create sample data
data1 = np.random.rand(10, 10)
data2 = np.random.rand(10, 10)

# Create a figure with two subplots
fig, (ax1, ax2) = plt.subplots(1, 2, figsize=(15, 6))

# Create color-mapped plots
im1 = ax1.imshow(data1, cmap='viridis')
im2 = ax2.imshow(data2, cmap='plasma')

# Add colorbars to each subplot
cbar1 = plt.colorbar(im1, ax=ax1)
cbar2 = plt.colorbar(im2, ax=ax2)

# Rotate colorbar tick labels for both subplots
for cbar in [cbar1, cbar2]:
    cbar.ax.set_yticklabels(cbar.ax.get_yticklabels(), rotation=45, ha='right')

# Set titles
ax1.set_title("Subplot 1 - how2matplotlib.com")
ax2.set_title("Subplot 2 - how2matplotlib.com")
fig.suptitle("Rotated Colorbar Tick Labels in Subplots", fontsize=16)

# Show the plot
plt.tight_layout()
plt.show()
Output:
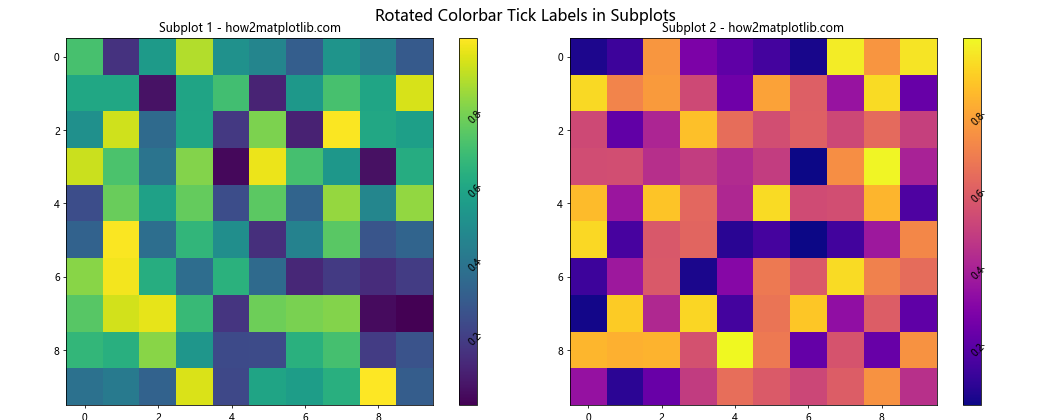
In this example, we create two subplots, each with its own colorbar, and rotate the tick labels for both colorbars.
Best Practices for Colorbar Tick Label Rotation
When implementing rotation of colorbar tick labels in Matplotlib, consider these best practices:
- Choose an appropriate rotation angle: Usually, angles between 30 and 60 degrees work well.
- Adjust the colorbar position if needed to accommodate rotated labels.
- Use
ha='right'orha='left'to align rotated labels properly. - Consider wrapping long labels instead of rotating them if rotation causes overlap.
- Ensure consistent rotation across all colorbars in a multi-plot figure.
Troubleshooting Common Issues in Colorbar Tick Label Rotation
When working with rotation of colorbar tick labels in Matplotlib, you might encounter some common issues. Let’s address a few of them:
Misaligned Labels
If rotated labels appear misaligned, you can adjust their alignment and padding:
import matplotlib.pyplot as plt
import numpy as np

# Create sample data
data = np.random.rand(10, 10)

# Create a figure and axis
fig, ax = plt.subplots(figsize=(10, 8))

# Create a color-mapped plot
im = ax.imshow(data, cmap='coolwarm')

# Add a colorbar
cbar = plt.colorbar(im)

# Rotate and align the colorbar tick labels
cbar.ax.set_yticklabels(cbar.ax.get_yticklabels(), rotation=45, ha='right', va='center')
cbar.ax.yaxis.set_tick_params(pad=40)

# Set the title
plt.title("Aligned Rotated Colorbar Tick Labels - how2matplotlib.com")

# Show the plot
plt.show()
Output:
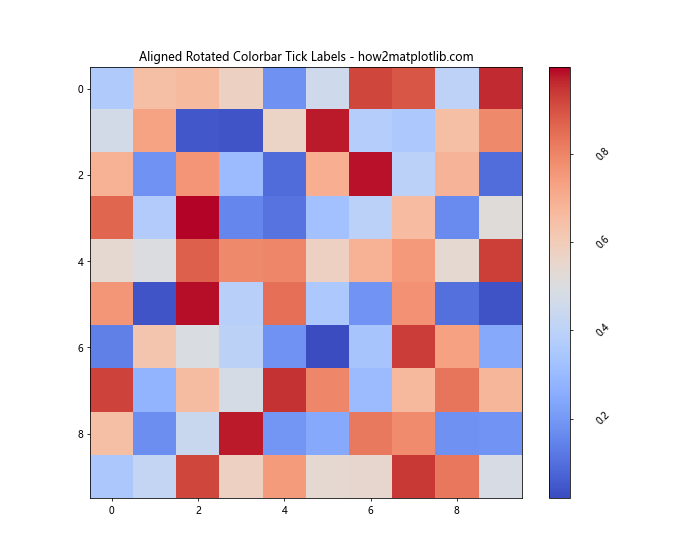
In this example, we use ha='right' and va='center' to align the labels, and adjust the padding with set_tick_params(pad=40) to position them correctly.
Advanced Topics in Colorbar Tick Label Rotation
Let’s explore some advanced topics related to rotation of colorbar tick labels in Matplotlib.
Custom Tick Locations and Labels
You can create custom tick locations and labels for your rotated colorbar:
import matplotlib.pyplot as plt
import numpy as np

# Create sample data
data = np.random.rand(10, 10)

# Create a figure and axis
fig, ax = plt.subplots(figsize=(10, 8))

# Create a color-mapped plot
im = ax.imshow(data, cmap='viridis')

# Add a colorbar with custom ticks and labels
cbar = plt.colorbar(im, ticks=[0, 0.3, 0.7, 1])
custom_labels = ['Low', 'Medium', 'High', 'Very High']
cbar.ax.set_yticklabels(custom_labels)

# Rotate the colorbar tick labels
cbar.ax.set_yticklabels(custom_labels, rotation=45, ha='right')

# Set the title
plt.title("Custom Rotated Colorbar Tick Labels - how2matplotlib.com")

# Show the plot
plt.show()
Output:
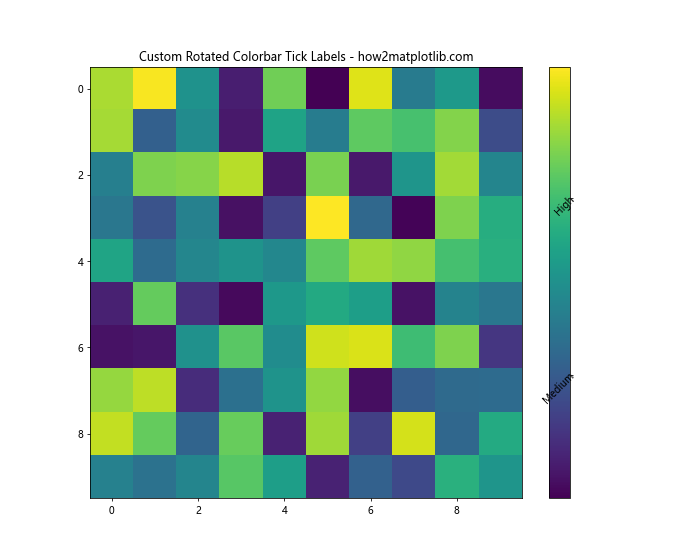
In this example, we set custom tick locations and labels, then rotate them for better visibility.
Colorbar Tick Label Rotation in Different Matplotlib Styles
Matplotlib offers various built-in styles that can affect the appearance of your plots, including colorbars and their labels. Let’s explore how rotation of colorbar tick labels in Matplotlib works with different styles.
Using the ‘ggplot’ Style
import matplotlib.pyplot as plt
import numpy as np

# Set the style to 'ggplot'
plt.style.use('ggplot')

# Create sample data
data = np.random.rand(10, 10)

# Create a figure and axis
fig, ax = plt.subplots(figsize=(10, 8))

# Create a color-mapped plot
im = ax.imshow(data, cmap='viridis')

# Add a colorbar
cbar = plt.colorbar(im)

# Rotate the colorbar tick labels
cbar.ax.set_yticklabels(cbar.ax.get_yticklabels(), rotation=45, ha='right')

# Set the title
plt.title("Rotated Colorbar Tick Labels with 'ggplot' Style - how2matplotlib.com")

# Show the plot
plt.show()
Output:
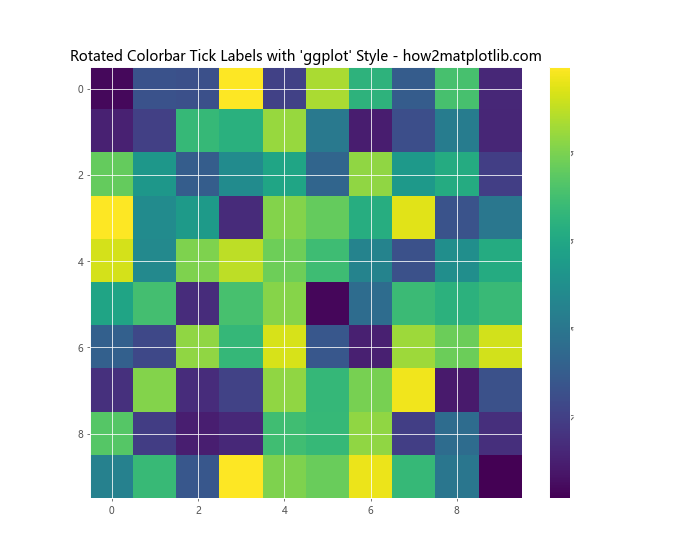
This example demonstrates how the ‘ggplot’ style affects the appearance of the plot and rotated colorbar tick labels.
Using the ‘dark_background’ Style
import matplotlib.pyplot as plt
import numpy as np

# Set the style to 'dark_background'
plt.style.use('dark_background')

# Create sample data
data = np.random.rand(10, 10)

# Create a figure and axis
fig, ax = plt.subplots(figsize=(10, 8))

# Create a color-mapped plot
im = ax.imshow(data, cmap='plasma')

# Add a colorbar
cbar = plt.colorbar(im)

# Rotate the colorbar tick labels
cbar.ax.set_yticklabels(cbar.ax.get_yticklabels(), rotation=45, ha='right')

# Set the title
plt.title("Rotated Colorbar Tick Labels with 'dark_background' Style - how2matplotlib.com")

# Show the plot
plt.show()
Output:
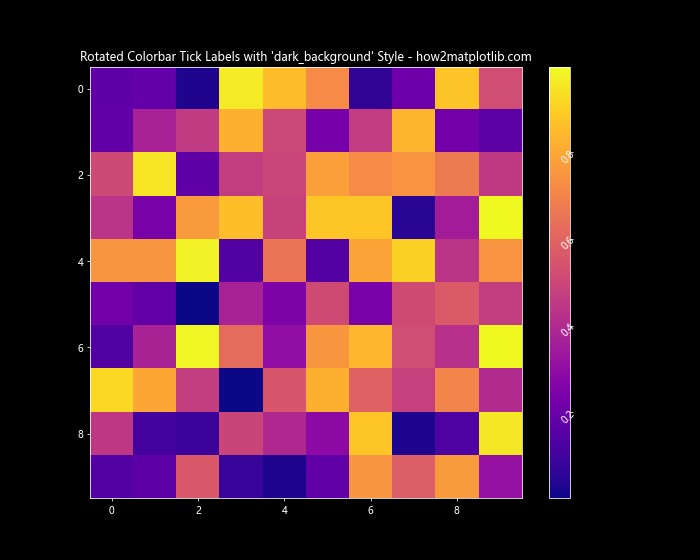
This example shows how the ‘dark_background’ style changes the overall look of the plot, including the rotated colorbar tick labels.
Colorbar Tick Label Rotation in 3D Plots
Rotation of colorbar tick labels in Matplotlib can also be applied to 3D plots. Let’s see an example:
import matplotlib.pyplot as plt
import numpy as np
from mpl_toolkits.mplot3d import Axes3D

# Create sample data
x = y = np.arange(-3.0, 3.0, 0.05)
X, Y = np.meshgrid(x, y)
Z = np.exp(-(X**2 + Y**2))

# Create a figure and 3D axis
fig = plt.figure(figsize=(10, 8))
ax = fig.add_subplot(111, projection='3d')

# Create a surface plot
surf = ax.plot_surface(X, Y, Z, cmap='viridis')

# Add a colorbar
cbar = fig.colorbar(surf)

# Rotate the colorbar tick labels
cbar.ax.set_yticklabels(cbar.ax.get_yticklabels(), rotation=45, ha='right')

# Set the title
plt.title("3D Plot with Rotated Colorbar Tick Labels - how2matplotlib.com")

# Show the plot
plt.show()
Output:
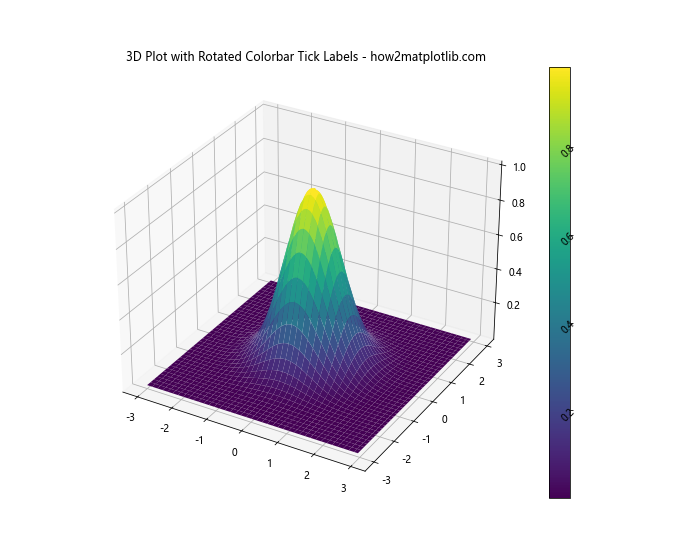
This example demonstrates how to apply rotation to colorbar tick labels in a 3D surface plot.
Conclusion
Rotation of colorbar tick labels in Matplotlib is a powerful technique that can significantly enhance the readability and aesthetics of your data visualizations. Throughout this comprehensive guide, we’ve explored various aspects of this topic, from basic rotation techniques to advanced customization options.
We’ve covered:
- Basic methods for rotating colorbar tick labels
- Handling long labels and different plot types
- Advanced customization of rotated labels
- Troubleshooting common issues
- Applying rotation in different Matplotlib styles and 3D plots